

Key Insights
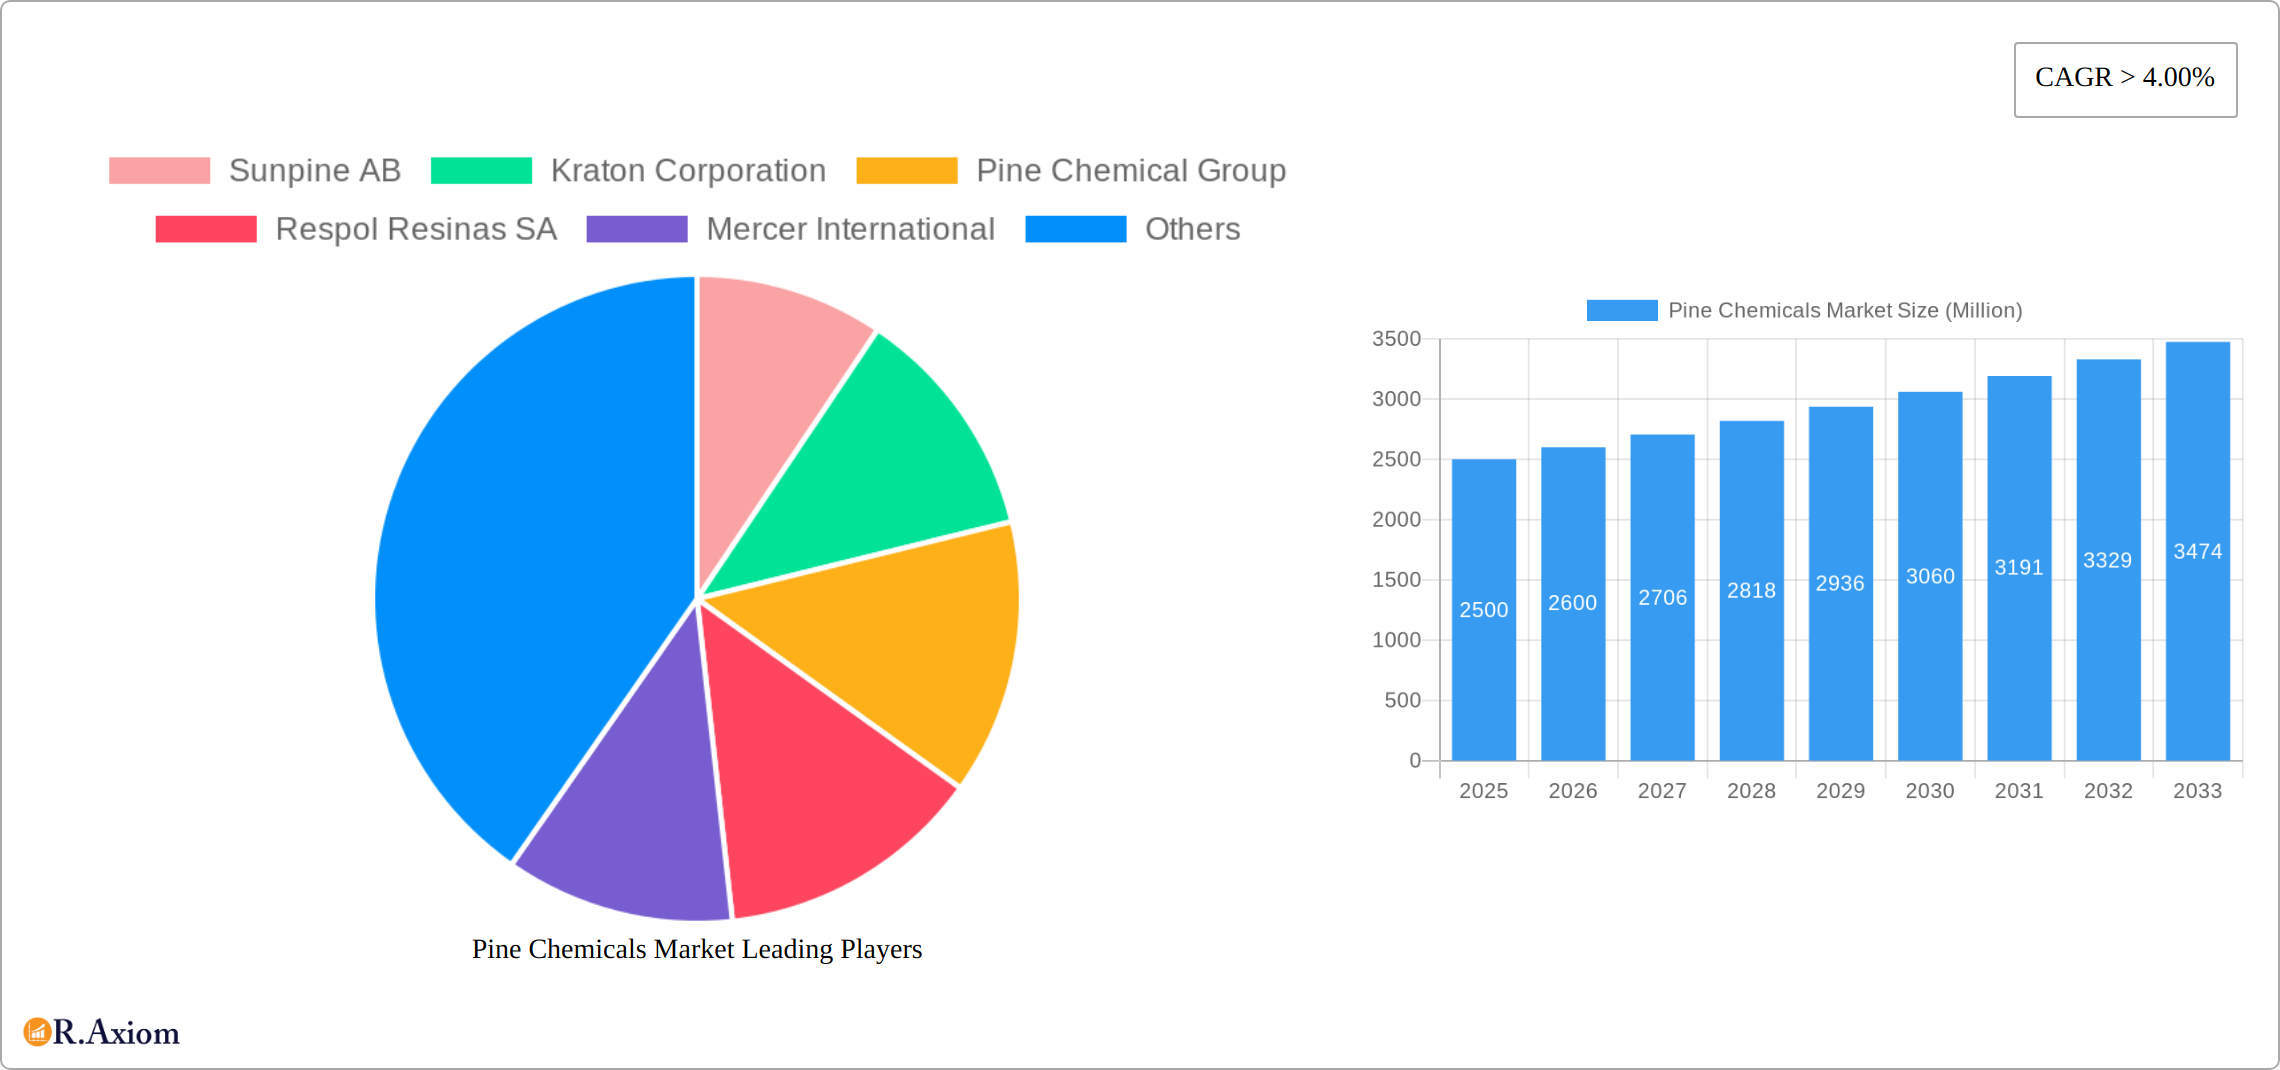
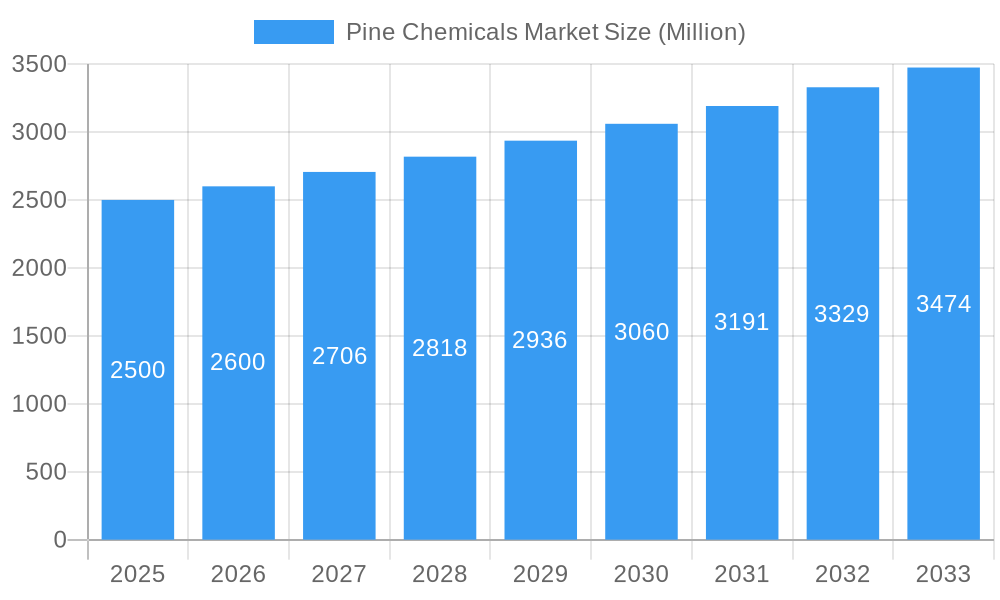
The global Pine Chemicals market, valued at $17.3 billion in 2025, is projected for significant expansion with a Compound Annual Growth Rate (CAGR) of 5% from 2025 to 2033. Key growth drivers include the escalating demand for sustainable and bio-based materials in adhesives, coatings, and paper industries. The increasing adoption of renewable resources and stringent environmental regulations further support market growth. Tall oil, a crucial pine chemical component, is experiencing elevated demand due to its wide applicability in soaps, detergents, and asphalt. Technological advancements in extraction and processing enhance production efficiency and sustainability. However, market growth may be constrained by raw material price volatility and sustainable harvesting practices. North America and Europe currently dominate market share, while the Asia-Pacific region is expected to witness rapid growth driven by industrialization and construction.
Pine Chemicals Market Market Size (In Billion)
The competitive landscape features both established multinational corporations and regional players. Key companies are leveraging distribution networks and technological expertise to maintain market positions. Strategic partnerships and acquisitions are common, aiming to broaden product portfolios and market reach. Future growth hinges on continuous innovation, focus on high-value applications, and enhanced supply chain sustainability. Adapting to evolving chemical usage regulations and environmental protection standards is vital for sustained success. The forecast period (2025-2033) anticipates sustained expansion, driven by the ongoing demand for eco-friendly chemical alternatives.
Pine Chemicals Market Company Market Share
This comprehensive report analyzes the global Pine Chemicals market, providing critical insights for stakeholders, investors, and decision-makers. The study period spans 2019-2033, with 2025 as the base and estimated year. It offers detailed segmentation by product type (e.g., Tall Oil, Rosin, Turpentine) and application, delivering granular insights and actionable strategies for navigating this dynamic sector.
Pine Chemicals Market Market Concentration & Innovation
The global pine chemicals market is characterized by a moderately concentrated landscape, with a handful of prominent players wielding considerable market influence. The distribution of market share, however, is not uniform across all product segments; some exhibit higher degrees of concentration than others. For example, the Tall Oil segment is likely dominated by a select group of large-scale producers, whereas the Wood Rosin segment may present a more fragmented picture with numerous smaller participants. Mergers and acquisitions (M&A) serve as a significant catalyst for market consolidation, as exemplified by recent strategic deals such as Grupo Resinas Brasil's acquisition of Pinopine. These transactions, valued at approximately **[Insert Specific M&A Value Here] Million** (replace 'xx' with actual figures), underscore substantial investment within the sector and are instrumental in driving strategic expansion and bolstering competitive positioning.
- Market Concentration: Moderate, with discernible variations across specific product segments, indicating opportunities for both consolidation and niche player growth.
- Innovation Drivers: Key innovation trajectories are steered by the imperative for sustainable sourcing, the burgeoning demand for bio-based alternatives, and the continuous pursuit of enhanced performance characteristics in pine-derived products.
- Regulatory Frameworks: Stringent environmental regulations are a crucial influencing factor, impacting production methodologies, waste management protocols, and the overall sustainability of the pine chemicals value chain.
- Product Substitutes: The market faces competitive pressure from synthetic resins and petroleum-based alternatives, necessitating ongoing efforts to highlight the unique advantages and sustainability credentials of pine chemicals.
- End-User Trends: Robust and expanding demand from critical end-use industries, including adhesives, coatings, and paper manufacturing, is a primary engine for market growth and product development.
- M&A Activities: Recent strategic acquisitions, such as the notable Grupo Resinas Brasil/Pinopine deal (valued at **[Insert Specific M&A Value Here] Million** - replace 'xx' with actual figures), serve as clear indicators of ongoing market consolidation and the strategic pursuit of expanded market reach and capabilities.
Pine Chemicals Market Industry Trends & Insights
The global pine chemicals market is experiencing a period of sustained and robust growth. This expansion is primarily fueled by the increasing demand emanating from a diverse array of end-use industries, including construction, packaging, and paper manufacturing. Projections indicate that the market will likely exhibit a Compound Annual Growth Rate (CAGR) of **[Insert Specific CAGR Here]%** during the forecast period of 2025-2033 (replace 'xx' with actual figures). Technological advancements are playing a pivotal role, particularly in refining processes, which are leading to greater efficiency and the development of novel applications for pine-based chemicals. Furthermore, a significant shift in consumer preferences towards eco-friendly and sustainable products is directly stimulating the demand for bio-based alternatives, thereby acting as a powerful catalyst for market expansion. Nevertheless, the market landscape is not without its challenges, including competitive dynamics characterized by price volatility and the persistent availability of substitute products. It is also noteworthy that market penetration rates exhibit considerable variation across different geographical regions and specific application areas.
Dominant Markets & Segments in Pine Chemicals Market
The North American region, especially the US and Canada, currently holds the largest market share, due to substantial pulp and paper industries. The European Union also holds a significant market share, driven by high demand in various end-use sectors. Within the product segments, Tall Oil, Rosin, and Turpentine are major contributors to the overall market value, accounting for approximately xx Million, xx Million, and xx Million respectively in 2025.
- Key Drivers (North America): Established pulp and paper industry, strong infrastructure, supportive economic policies.
- Key Drivers (Europe): High demand across several end-use industries, robust chemical manufacturing sector.
- Dominance Analysis: High concentration in North America due to established infrastructure and production facilities. Strong but fragmented market in Europe.
Pine Chemicals Market Product Developments
Recent years have witnessed significant advancements in pine chemical processing, leading to the development of new products with enhanced properties and broader applications. The focus is on sustainability, leading to the creation of bio-based alternatives and improved extraction methods minimizing environmental impact. This is evident in DRT's launch of DERTOPHALT, a 100% natural plant-based binder. These innovations enhance the competitive advantage of producers by offering environmentally conscious solutions to end users.
Report Scope & Segmentation Analysis
This comprehensive report offers a detailed segmentation of the pine chemicals market, categorized by product type (including Tall Oil, Tall Oil Pitch (TOP), Rosin, Wood Rosin, Turpentine, and Other Turpentines) and by application. Each segment is subjected to an in-depth analysis, meticulously considering market size, projected growth trajectories, and the prevailing competitive dynamics. For instance, the Tall Oil segment is anticipated to witness a robust CAGR of **[Insert Specific CAGR Here]%** (replace 'xx' with actual figures), largely propelled by its increasing utilization in the biofuel industry and its role as a fundamental raw material in the production of various other chemicals. In contrast, the Rosin segment is projected to exhibit a comparatively more moderate growth rate of **[Insert Specific CAGR Here]%** (replace 'xx' with actual figures), primarily driven by its established traditional applications. Similar granular and detailed analyses are furnished for all identified market segments, providing a holistic view of the industry's structure and potential.
Key Drivers of Pine Chemicals Market Growth
The trajectory of growth within the pine chemicals market is significantly propelled by a confluence of potent factors:
- Surging Demand: An escalating demand from a wide spectrum of industries, including but not limited to construction, adhesives, coatings, and paper manufacturing, forms a foundational driver for market expansion.
- Technological Advancements: Continuous innovation and improvements in refining processes are leading to enhanced yields, superior product quality, and the potential for developing new, high-value applications.
- Sustainable Sourcing Initiatives: The global pivot towards sustainability is fostering a growing preference for bio-based and renewable alternatives, positioning pine chemicals as a desirable and environmentally responsible choice.
- Government Support & Policy: Favorable government policies and initiatives that promote sustainable forestry practices and the utilization of bio-based materials are providing a supportive ecosystem for market growth.
Challenges in the Pine Chemicals Market Sector
The pine chemicals market faces several challenges:
- Fluctuating raw material prices: The price volatility of wood pulp and other raw materials impacts profitability.
- Stringent environmental regulations: Compliance costs and the need for sustainable practices add pressure.
- Competition from synthetic substitutes: Synthetic resins and petroleum-based alternatives offer competition.
- Supply chain disruptions: Global events can impact the availability and cost of raw materials.
Emerging Opportunities in Pine Chemicals Market
Several opportunities exist within the pine chemicals market:
- Expansion into new applications: Exploration of novel applications for pine-based chemicals in emerging industries.
- Development of high-value products: Focus on value-added products with enhanced performance properties.
- Bio-based innovations: Further development of sustainable and eco-friendly alternatives.
- Strategic partnerships: Collaborations to improve supply chains and access new markets.
Leading Players in the Pine Chemicals Market Market
- Sunpine AB
- Kraton Corporation
- Pine Chemical Group
- Respol Resinas SA
- Mercer International
- Harima Chemicals Group Inc
- OOO Torgoviy Dom Lesokhimik
- Ingevity Corporation
- Forchem Oyj
- Synthomer Plc
- Arakawa Chemical Industries Ltd
- DRT (Dérivés Résiniques et Terpéniques)
Key Developments in Pine Chemicals Market Industry
- March 2024: Grupo Resinas Brasil acquires Pinopine, expanding its market share in gum rosin derivatives.
- September 2023: DRT invests in a new production facility in France, boosting its capacity for hydrogenated rosin and resin derivatives.
- June 2022: DRT launches DERTOPHALT, a 100% natural plant-based binder, showcasing innovation in sustainable products.
Strategic Outlook for Pine Chemicals Market Market
The pine chemicals market is strategically positioned for sustained and dynamic growth, primarily propelled by the increasing global imperative for sustainable and bio-based materials. Future success within this evolving market will hinge on a multi-faceted approach encompassing continuous innovation in product development, the forging of strategic partnerships to expand market reach and capabilities, and the proactive exploration and penetration of new, high-potential application areas. A steadfast commitment to sustainability principles, coupled with the adept development of high-value pine chemical products, will be paramount for stakeholders seeking to thrive and achieve significant market share in this competitive and forward-looking industry.
Pine Chemicals Market Segmentation
-
1. Product Type
-
1.1. Tall Oil
- 1.1.1. Crude Tall Oil (CTO)
- 1.1.2. Tall Oil Fatty Acid (TOFA)
- 1.1.3. Distilled Tall Oil (DTO)
- 1.1.4. Tall Oil Pitch (TOP)
-
1.2. Rosin
- 1.2.1. Tall Oil Rosin
- 1.2.2. Gum Rosin
- 1.2.3. Wood Rosin
-
1.3. Turpentine
- 1.3.1. Gum/Wood Turpentine
- 1.3.2. Crude Sulphate Turpentine
- 1.3.3. Other Turpentines
-
1.4. Application
- 1.4.1. Adhesives and Sealants
- 1.4.2. Coatings
- 1.4.3. Printing Inks
- 1.4.4. Lubricants and Lubricity Additives
- 1.4.5. Biofuels
- 1.4.6. Paper Sizing
- 1.4.7. Rubber
- 1.4.8. Soaps and Detergents
- 1.4.9. Other Ap
-
1.1. Tall Oil
Pine Chemicals Market Segmentation By Geography
-
1. Asia Pacific
- 1.1. China
- 1.2. India
- 1.3. Japan
- 1.4. South Korea
- 1.5. ASEAN Countries
- 1.6. Rest of Asia Pacific
-
2. North America
- 2.1. United States
- 2.2. Canada
- 2.3. Mexico
-
3. Europe
- 3.1. Germany
- 3.2. United Kingdom
- 3.3. Italy
- 3.4. France
- 3.5. Rest of Europe
-
4. South America
- 4.1. Brazil
- 4.2. Argentina
- 4.3. Rest of South America
-
5. Middle East and Africa
- 5.1. Saudi Arabia
- 5.2. South Africa
- 5.3. Rest of Middle East and Africa
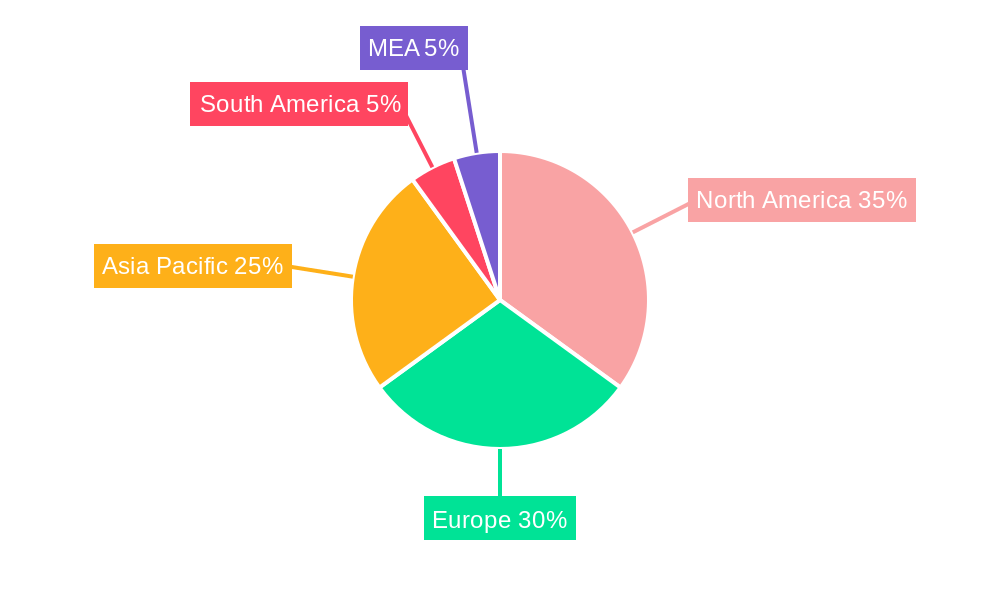
Pine Chemicals Market Regional Market Share
Geographic Coverage of Pine Chemicals Market
Pine Chemicals Market REPORT HIGHLIGHTS
| Aspects | Details |
|---|---|
| Study Period | 2020-2034 |
| Base Year | 2025 |
| Estimated Year | 2026 |
| Forecast Period | 2026-2034 |
| Historical Period | 2020-2025 |
| Growth Rate | CAGR of 5% from 2020-2034 |
| Segmentation |
|
Table of Contents
- 1. Introduction
- 1.1. Research Scope
- 1.2. Market Segmentation
- 1.3. Research Objective
- 1.4. Definitions and Assumptions
- 2. Executive Summary
- 2.1. Market Snapshot
- 3. Market Dynamics
- 3.1. Market Drivers
- 3.2. Market Restrains
- 3.3. Market Trends
- 3.4. Market Opportunities
- 4. Market Factor Analysis
- 4.1. Porters Five Forces
- 4.1.1. Bargaining Power of Suppliers
- 4.1.2. Bargaining Power of Buyers
- 4.1.3. Threat of New Entrants
- 4.1.4. Threat of Substitutes
- 4.1.5. Competitive Rivalry
- 4.2. PESTEL analysis
- 4.3. BCG Analysis
- 4.3.1. Stars (High Growth, High Market Share)
- 4.3.2. Cash Cows (Low Growth, High Market Share)
- 4.3.3. Question Mark (High Growth, Low Market Share)
- 4.3.4. Dogs (Low Growth, Low Market Share)
- 4.4. Ansoff Matrix Analysis
- 4.5. Supply Chain Analysis
- 4.6. Regulatory Landscape
- 4.7. Current Market Potential and Opportunity Assessment (TAM–SAM–SOM Framework)
- 4.8. RAX Analyst Note
- 4.1. Porters Five Forces
- 5. Market Analysis, Insights and Forecast 2021-2033
- 5.1. Market Analysis, Insights and Forecast - by Product Type
- 5.1.1. Tall Oil
- 5.1.1.1. Crude Tall Oil (CTO)
- 5.1.1.2. Tall Oil Fatty Acid (TOFA)
- 5.1.1.3. Distilled Tall Oil (DTO)
- 5.1.1.4. Tall Oil Pitch (TOP)
- 5.1.2. Rosin
- 5.1.2.1. Tall Oil Rosin
- 5.1.2.2. Gum Rosin
- 5.1.2.3. Wood Rosin
- 5.1.3. Turpentine
- 5.1.3.1. Gum/Wood Turpentine
- 5.1.3.2. Crude Sulphate Turpentine
- 5.1.3.3. Other Turpentines
- 5.1.4. Application
- 5.1.4.1. Adhesives and Sealants
- 5.1.4.2. Coatings
- 5.1.4.3. Printing Inks
- 5.1.4.4. Lubricants and Lubricity Additives
- 5.1.4.5. Biofuels
- 5.1.4.6. Paper Sizing
- 5.1.4.7. Rubber
- 5.1.4.8. Soaps and Detergents
- 5.1.4.9. Other Ap
- 5.1.1. Tall Oil
- 5.2. Market Analysis, Insights and Forecast - by Region
- 5.2.1. Asia Pacific
- 5.2.2. North America
- 5.2.3. Europe
- 5.2.4. South America
- 5.2.5. Middle East and Africa
- 5.1. Market Analysis, Insights and Forecast - by Product Type
- 6. Global Pine Chemicals Market Analysis, Insights and Forecast, 2021-2033
- 6.1. Market Analysis, Insights and Forecast - by Product Type
- 6.1.1. Tall Oil
- 6.1.1.1. Crude Tall Oil (CTO)
- 6.1.1.2. Tall Oil Fatty Acid (TOFA)
- 6.1.1.3. Distilled Tall Oil (DTO)
- 6.1.1.4. Tall Oil Pitch (TOP)
- 6.1.2. Rosin
- 6.1.2.1. Tall Oil Rosin
- 6.1.2.2. Gum Rosin
- 6.1.2.3. Wood Rosin
- 6.1.3. Turpentine
- 6.1.3.1. Gum/Wood Turpentine
- 6.1.3.2. Crude Sulphate Turpentine
- 6.1.3.3. Other Turpentines
- 6.1.4. Application
- 6.1.4.1. Adhesives and Sealants
- 6.1.4.2. Coatings
- 6.1.4.3. Printing Inks
- 6.1.4.4. Lubricants and Lubricity Additives
- 6.1.4.5. Biofuels
- 6.1.4.6. Paper Sizing
- 6.1.4.7. Rubber
- 6.1.4.8. Soaps and Detergents
- 6.1.4.9. Other Ap
- 6.1.1. Tall Oil
- 6.1. Market Analysis, Insights and Forecast - by Product Type
- 7. Asia Pacific Pine Chemicals Market Analysis, Insights and Forecast, 2020-2032
- 7.1. Market Analysis, Insights and Forecast - by Product Type
- 7.1.1. Tall Oil
- 7.1.1.1. Crude Tall Oil (CTO)
- 7.1.1.2. Tall Oil Fatty Acid (TOFA)
- 7.1.1.3. Distilled Tall Oil (DTO)
- 7.1.1.4. Tall Oil Pitch (TOP)
- 7.1.2. Rosin
- 7.1.2.1. Tall Oil Rosin
- 7.1.2.2. Gum Rosin
- 7.1.2.3. Wood Rosin
- 7.1.3. Turpentine
- 7.1.3.1. Gum/Wood Turpentine
- 7.1.3.2. Crude Sulphate Turpentine
- 7.1.3.3. Other Turpentines
- 7.1.4. Application
- 7.1.4.1. Adhesives and Sealants
- 7.1.4.2. Coatings
- 7.1.4.3. Printing Inks
- 7.1.4.4. Lubricants and Lubricity Additives
- 7.1.4.5. Biofuels
- 7.1.4.6. Paper Sizing
- 7.1.4.7. Rubber
- 7.1.4.8. Soaps and Detergents
- 7.1.4.9. Other Ap
- 7.1.1. Tall Oil
- 7.1. Market Analysis, Insights and Forecast - by Product Type
- 8. North America Pine Chemicals Market Analysis, Insights and Forecast, 2020-2032
- 8.1. Market Analysis, Insights and Forecast - by Product Type
- 8.1.1. Tall Oil
- 8.1.1.1. Crude Tall Oil (CTO)
- 8.1.1.2. Tall Oil Fatty Acid (TOFA)
- 8.1.1.3. Distilled Tall Oil (DTO)
- 8.1.1.4. Tall Oil Pitch (TOP)
- 8.1.2. Rosin
- 8.1.2.1. Tall Oil Rosin
- 8.1.2.2. Gum Rosin
- 8.1.2.3. Wood Rosin
- 8.1.3. Turpentine
- 8.1.3.1. Gum/Wood Turpentine
- 8.1.3.2. Crude Sulphate Turpentine
- 8.1.3.3. Other Turpentines
- 8.1.4. Application
- 8.1.4.1. Adhesives and Sealants
- 8.1.4.2. Coatings
- 8.1.4.3. Printing Inks
- 8.1.4.4. Lubricants and Lubricity Additives
- 8.1.4.5. Biofuels
- 8.1.4.6. Paper Sizing
- 8.1.4.7. Rubber
- 8.1.4.8. Soaps and Detergents
- 8.1.4.9. Other Ap
- 8.1.1. Tall Oil
- 8.1. Market Analysis, Insights and Forecast - by Product Type
- 9. Europe Pine Chemicals Market Analysis, Insights and Forecast, 2020-2032
- 9.1. Market Analysis, Insights and Forecast - by Product Type
- 9.1.1. Tall Oil
- 9.1.1.1. Crude Tall Oil (CTO)
- 9.1.1.2. Tall Oil Fatty Acid (TOFA)
- 9.1.1.3. Distilled Tall Oil (DTO)
- 9.1.1.4. Tall Oil Pitch (TOP)
- 9.1.2. Rosin
- 9.1.2.1. Tall Oil Rosin
- 9.1.2.2. Gum Rosin
- 9.1.2.3. Wood Rosin
- 9.1.3. Turpentine
- 9.1.3.1. Gum/Wood Turpentine
- 9.1.3.2. Crude Sulphate Turpentine
- 9.1.3.3. Other Turpentines
- 9.1.4. Application
- 9.1.4.1. Adhesives and Sealants
- 9.1.4.2. Coatings
- 9.1.4.3. Printing Inks
- 9.1.4.4. Lubricants and Lubricity Additives
- 9.1.4.5. Biofuels
- 9.1.4.6. Paper Sizing
- 9.1.4.7. Rubber
- 9.1.4.8. Soaps and Detergents
- 9.1.4.9. Other Ap
- 9.1.1. Tall Oil
- 9.1. Market Analysis, Insights and Forecast - by Product Type
- 10. South America Pine Chemicals Market Analysis, Insights and Forecast, 2020-2032
- 10.1. Market Analysis, Insights and Forecast - by Product Type
- 10.1.1. Tall Oil
- 10.1.1.1. Crude Tall Oil (CTO)
- 10.1.1.2. Tall Oil Fatty Acid (TOFA)
- 10.1.1.3. Distilled Tall Oil (DTO)
- 10.1.1.4. Tall Oil Pitch (TOP)
- 10.1.2. Rosin
- 10.1.2.1. Tall Oil Rosin
- 10.1.2.2. Gum Rosin
- 10.1.2.3. Wood Rosin
- 10.1.3. Turpentine
- 10.1.3.1. Gum/Wood Turpentine
- 10.1.3.2. Crude Sulphate Turpentine
- 10.1.3.3. Other Turpentines
- 10.1.4. Application
- 10.1.4.1. Adhesives and Sealants
- 10.1.4.2. Coatings
- 10.1.4.3. Printing Inks
- 10.1.4.4. Lubricants and Lubricity Additives
- 10.1.4.5. Biofuels
- 10.1.4.6. Paper Sizing
- 10.1.4.7. Rubber
- 10.1.4.8. Soaps and Detergents
- 10.1.4.9. Other Ap
- 10.1.1. Tall Oil
- 10.1. Market Analysis, Insights and Forecast - by Product Type
- 11. Middle East and Africa Pine Chemicals Market Analysis, Insights and Forecast, 2020-2032
- 11.1. Market Analysis, Insights and Forecast - by Product Type
- 11.1.1. Tall Oil
- 11.1.1.1. Crude Tall Oil (CTO)
- 11.1.1.2. Tall Oil Fatty Acid (TOFA)
- 11.1.1.3. Distilled Tall Oil (DTO)
- 11.1.1.4. Tall Oil Pitch (TOP)
- 11.1.2. Rosin
- 11.1.2.1. Tall Oil Rosin
- 11.1.2.2. Gum Rosin
- 11.1.2.3. Wood Rosin
- 11.1.3. Turpentine
- 11.1.3.1. Gum/Wood Turpentine
- 11.1.3.2. Crude Sulphate Turpentine
- 11.1.3.3. Other Turpentines
- 11.1.4. Application
- 11.1.4.1. Adhesives and Sealants
- 11.1.4.2. Coatings
- 11.1.4.3. Printing Inks
- 11.1.4.4. Lubricants and Lubricity Additives
- 11.1.4.5. Biofuels
- 11.1.4.6. Paper Sizing
- 11.1.4.7. Rubber
- 11.1.4.8. Soaps and Detergents
- 11.1.4.9. Other Ap
- 11.1.1. Tall Oil
- 11.1. Market Analysis, Insights and Forecast - by Product Type
- 12. Competitive Analysis
- 12.1. Company Profiles
- 12.1.1 Sunpine AB
- 12.1.1.1. Company Overview
- 12.1.1.2. Products
- 12.1.1.3. Company Financials
- 12.1.1.4. SWOT Analysis
- 12.1.2 Kraton Corporation
- 12.1.2.1. Company Overview
- 12.1.2.2. Products
- 12.1.2.3. Company Financials
- 12.1.2.4. SWOT Analysis
- 12.1.3 Pine Chemical Group
- 12.1.3.1. Company Overview
- 12.1.3.2. Products
- 12.1.3.3. Company Financials
- 12.1.3.4. SWOT Analysis
- 12.1.4 Respol Resinas SA
- 12.1.4.1. Company Overview
- 12.1.4.2. Products
- 12.1.4.3. Company Financials
- 12.1.4.4. SWOT Analysis
- 12.1.5 Mercer International
- 12.1.5.1. Company Overview
- 12.1.5.2. Products
- 12.1.5.3. Company Financials
- 12.1.5.4. SWOT Analysis
- 12.1.6 Harima Chemicals Group Inc
- 12.1.6.1. Company Overview
- 12.1.6.2. Products
- 12.1.6.3. Company Financials
- 12.1.6.4. SWOT Analysis
- 12.1.7 OOO Torgoviy Dom Lesokhimik
- 12.1.7.1. Company Overview
- 12.1.7.2. Products
- 12.1.7.3. Company Financials
- 12.1.7.4. SWOT Analysis
- 12.1.8 Ingevity Corporation
- 12.1.8.1. Company Overview
- 12.1.8.2. Products
- 12.1.8.3. Company Financials
- 12.1.8.4. SWOT Analysis
- 12.1.9 Forchem Oyj
- 12.1.9.1. Company Overview
- 12.1.9.2. Products
- 12.1.9.3. Company Financials
- 12.1.9.4. SWOT Analysis
- 12.1.10 Synthomer Plc
- 12.1.10.1. Company Overview
- 12.1.10.2. Products
- 12.1.10.3. Company Financials
- 12.1.10.4. SWOT Analysis
- 12.1.11 Arakawa Chemical Industries Ltd
- 12.1.11.1. Company Overview
- 12.1.11.2. Products
- 12.1.11.3. Company Financials
- 12.1.11.4. SWOT Analysis
- 12.1.12 DRT (Dérivés Résiniques et Terpéniques)
- 12.1.12.1. Company Overview
- 12.1.12.2. Products
- 12.1.12.3. Company Financials
- 12.1.12.4. SWOT Analysis
- 12.1.1 Sunpine AB
- 12.2. Market Entropy
- 12.2.1 Company's Key Areas Served
- 12.2.2 Recent Developments
- 12.3. Company Market Share Analysis 2025
- 12.3.1 Top 5 Companies Market Share Analysis
- 12.3.2 Top 3 Companies Market Share Analysis
- 12.4. List of Potential Customers
- 13. Research Methodology
List of Figures
- Figure 1: Global Pine Chemicals Market Revenue Breakdown (billion, %) by Region 2025 & 2033
- Figure 2: Global Pine Chemicals Market Volume Breakdown (K Tons, %) by Region 2025 & 2033
- Figure 3: Asia Pacific Pine Chemicals Market Revenue (billion), by Product Type 2025 & 2033
- Figure 4: Asia Pacific Pine Chemicals Market Volume (K Tons), by Product Type 2025 & 2033
- Figure 5: Asia Pacific Pine Chemicals Market Revenue Share (%), by Product Type 2025 & 2033
- Figure 6: Asia Pacific Pine Chemicals Market Volume Share (%), by Product Type 2025 & 2033
- Figure 7: Asia Pacific Pine Chemicals Market Revenue (billion), by Country 2025 & 2033
- Figure 8: Asia Pacific Pine Chemicals Market Volume (K Tons), by Country 2025 & 2033
- Figure 9: Asia Pacific Pine Chemicals Market Revenue Share (%), by Country 2025 & 2033
- Figure 10: Asia Pacific Pine Chemicals Market Volume Share (%), by Country 2025 & 2033
- Figure 11: North America Pine Chemicals Market Revenue (billion), by Product Type 2025 & 2033
- Figure 12: North America Pine Chemicals Market Volume (K Tons), by Product Type 2025 & 2033
- Figure 13: North America Pine Chemicals Market Revenue Share (%), by Product Type 2025 & 2033
- Figure 14: North America Pine Chemicals Market Volume Share (%), by Product Type 2025 & 2033
- Figure 15: North America Pine Chemicals Market Revenue (billion), by Country 2025 & 2033
- Figure 16: North America Pine Chemicals Market Volume (K Tons), by Country 2025 & 2033
- Figure 17: North America Pine Chemicals Market Revenue Share (%), by Country 2025 & 2033
- Figure 18: North America Pine Chemicals Market Volume Share (%), by Country 2025 & 2033
- Figure 19: Europe Pine Chemicals Market Revenue (billion), by Product Type 2025 & 2033
- Figure 20: Europe Pine Chemicals Market Volume (K Tons), by Product Type 2025 & 2033
- Figure 21: Europe Pine Chemicals Market Revenue Share (%), by Product Type 2025 & 2033
- Figure 22: Europe Pine Chemicals Market Volume Share (%), by Product Type 2025 & 2033
- Figure 23: Europe Pine Chemicals Market Revenue (billion), by Country 2025 & 2033
- Figure 24: Europe Pine Chemicals Market Volume (K Tons), by Country 2025 & 2033
- Figure 25: Europe Pine Chemicals Market Revenue Share (%), by Country 2025 & 2033
- Figure 26: Europe Pine Chemicals Market Volume Share (%), by Country 2025 & 2033
- Figure 27: South America Pine Chemicals Market Revenue (billion), by Product Type 2025 & 2033
- Figure 28: South America Pine Chemicals Market Volume (K Tons), by Product Type 2025 & 2033
- Figure 29: South America Pine Chemicals Market Revenue Share (%), by Product Type 2025 & 2033
- Figure 30: South America Pine Chemicals Market Volume Share (%), by Product Type 2025 & 2033
- Figure 31: South America Pine Chemicals Market Revenue (billion), by Country 2025 & 2033
- Figure 32: South America Pine Chemicals Market Volume (K Tons), by Country 2025 & 2033
- Figure 33: South America Pine Chemicals Market Revenue Share (%), by Country 2025 & 2033
- Figure 34: South America Pine Chemicals Market Volume Share (%), by Country 2025 & 2033
- Figure 35: Middle East and Africa Pine Chemicals Market Revenue (billion), by Product Type 2025 & 2033
- Figure 36: Middle East and Africa Pine Chemicals Market Volume (K Tons), by Product Type 2025 & 2033
- Figure 37: Middle East and Africa Pine Chemicals Market Revenue Share (%), by Product Type 2025 & 2033
- Figure 38: Middle East and Africa Pine Chemicals Market Volume Share (%), by Product Type 2025 & 2033
- Figure 39: Middle East and Africa Pine Chemicals Market Revenue (billion), by Country 2025 & 2033
- Figure 40: Middle East and Africa Pine Chemicals Market Volume (K Tons), by Country 2025 & 2033
- Figure 41: Middle East and Africa Pine Chemicals Market Revenue Share (%), by Country 2025 & 2033
- Figure 42: Middle East and Africa Pine Chemicals Market Volume Share (%), by Country 2025 & 2033
List of Tables
- Table 1: Global Pine Chemicals Market Revenue billion Forecast, by Product Type 2020 & 2033
- Table 2: Global Pine Chemicals Market Volume K Tons Forecast, by Product Type 2020 & 2033
- Table 3: Global Pine Chemicals Market Revenue billion Forecast, by Region 2020 & 2033
- Table 4: Global Pine Chemicals Market Volume K Tons Forecast, by Region 2020 & 2033
- Table 5: Global Pine Chemicals Market Revenue billion Forecast, by Product Type 2020 & 2033
- Table 6: Global Pine Chemicals Market Volume K Tons Forecast, by Product Type 2020 & 2033
- Table 7: Global Pine Chemicals Market Revenue billion Forecast, by Country 2020 & 2033
- Table 8: Global Pine Chemicals Market Volume K Tons Forecast, by Country 2020 & 2033
- Table 9: China Pine Chemicals Market Revenue (billion) Forecast, by Application 2020 & 2033
- Table 10: China Pine Chemicals Market Volume (K Tons) Forecast, by Application 2020 & 2033
- Table 11: India Pine Chemicals Market Revenue (billion) Forecast, by Application 2020 & 2033
- Table 12: India Pine Chemicals Market Volume (K Tons) Forecast, by Application 2020 & 2033
- Table 13: Japan Pine Chemicals Market Revenue (billion) Forecast, by Application 2020 & 2033
- Table 14: Japan Pine Chemicals Market Volume (K Tons) Forecast, by Application 2020 & 2033
- Table 15: South Korea Pine Chemicals Market Revenue (billion) Forecast, by Application 2020 & 2033
- Table 16: South Korea Pine Chemicals Market Volume (K Tons) Forecast, by Application 2020 & 2033
- Table 17: ASEAN Countries Pine Chemicals Market Revenue (billion) Forecast, by Application 2020 & 2033
- Table 18: ASEAN Countries Pine Chemicals Market Volume (K Tons) Forecast, by Application 2020 & 2033
- Table 19: Rest of Asia Pacific Pine Chemicals Market Revenue (billion) Forecast, by Application 2020 & 2033
- Table 20: Rest of Asia Pacific Pine Chemicals Market Volume (K Tons) Forecast, by Application 2020 & 2033
- Table 21: Global Pine Chemicals Market Revenue billion Forecast, by Product Type 2020 & 2033
- Table 22: Global Pine Chemicals Market Volume K Tons Forecast, by Product Type 2020 & 2033
- Table 23: Global Pine Chemicals Market Revenue billion Forecast, by Country 2020 & 2033
- Table 24: Global Pine Chemicals Market Volume K Tons Forecast, by Country 2020 & 2033
- Table 25: United States Pine Chemicals Market Revenue (billion) Forecast, by Application 2020 & 2033
- Table 26: United States Pine Chemicals Market Volume (K Tons) Forecast, by Application 2020 & 2033
- Table 27: Canada Pine Chemicals Market Revenue (billion) Forecast, by Application 2020 & 2033
- Table 28: Canada Pine Chemicals Market Volume (K Tons) Forecast, by Application 2020 & 2033
- Table 29: Mexico Pine Chemicals Market Revenue (billion) Forecast, by Application 2020 & 2033
- Table 30: Mexico Pine Chemicals Market Volume (K Tons) Forecast, by Application 2020 & 2033
- Table 31: Global Pine Chemicals Market Revenue billion Forecast, by Product Type 2020 & 2033
- Table 32: Global Pine Chemicals Market Volume K Tons Forecast, by Product Type 2020 & 2033
- Table 33: Global Pine Chemicals Market Revenue billion Forecast, by Country 2020 & 2033
- Table 34: Global Pine Chemicals Market Volume K Tons Forecast, by Country 2020 & 2033
- Table 35: Germany Pine Chemicals Market Revenue (billion) Forecast, by Application 2020 & 2033
- Table 36: Germany Pine Chemicals Market Volume (K Tons) Forecast, by Application 2020 & 2033
- Table 37: United Kingdom Pine Chemicals Market Revenue (billion) Forecast, by Application 2020 & 2033
- Table 38: United Kingdom Pine Chemicals Market Volume (K Tons) Forecast, by Application 2020 & 2033
- Table 39: Italy Pine Chemicals Market Revenue (billion) Forecast, by Application 2020 & 2033
- Table 40: Italy Pine Chemicals Market Volume (K Tons) Forecast, by Application 2020 & 2033
- Table 41: France Pine Chemicals Market Revenue (billion) Forecast, by Application 2020 & 2033
- Table 42: France Pine Chemicals Market Volume (K Tons) Forecast, by Application 2020 & 2033
- Table 43: Rest of Europe Pine Chemicals Market Revenue (billion) Forecast, by Application 2020 & 2033
- Table 44: Rest of Europe Pine Chemicals Market Volume (K Tons) Forecast, by Application 2020 & 2033
- Table 45: Global Pine Chemicals Market Revenue billion Forecast, by Product Type 2020 & 2033
- Table 46: Global Pine Chemicals Market Volume K Tons Forecast, by Product Type 2020 & 2033
- Table 47: Global Pine Chemicals Market Revenue billion Forecast, by Country 2020 & 2033
- Table 48: Global Pine Chemicals Market Volume K Tons Forecast, by Country 2020 & 2033
- Table 49: Brazil Pine Chemicals Market Revenue (billion) Forecast, by Application 2020 & 2033
- Table 50: Brazil Pine Chemicals Market Volume (K Tons) Forecast, by Application 2020 & 2033
- Table 51: Argentina Pine Chemicals Market Revenue (billion) Forecast, by Application 2020 & 2033
- Table 52: Argentina Pine Chemicals Market Volume (K Tons) Forecast, by Application 2020 & 2033
- Table 53: Rest of South America Pine Chemicals Market Revenue (billion) Forecast, by Application 2020 & 2033
- Table 54: Rest of South America Pine Chemicals Market Volume (K Tons) Forecast, by Application 2020 & 2033
- Table 55: Global Pine Chemicals Market Revenue billion Forecast, by Product Type 2020 & 2033
- Table 56: Global Pine Chemicals Market Volume K Tons Forecast, by Product Type 2020 & 2033
- Table 57: Global Pine Chemicals Market Revenue billion Forecast, by Country 2020 & 2033
- Table 58: Global Pine Chemicals Market Volume K Tons Forecast, by Country 2020 & 2033
- Table 59: Saudi Arabia Pine Chemicals Market Revenue (billion) Forecast, by Application 2020 & 2033
- Table 60: Saudi Arabia Pine Chemicals Market Volume (K Tons) Forecast, by Application 2020 & 2033
- Table 61: South Africa Pine Chemicals Market Revenue (billion) Forecast, by Application 2020 & 2033
- Table 62: South Africa Pine Chemicals Market Volume (K Tons) Forecast, by Application 2020 & 2033
- Table 63: Rest of Middle East and Africa Pine Chemicals Market Revenue (billion) Forecast, by Application 2020 & 2033
- Table 64: Rest of Middle East and Africa Pine Chemicals Market Volume (K Tons) Forecast, by Application 2020 & 2033
Frequently Asked Questions
1. What is the projected Compound Annual Growth Rate (CAGR) of the Pine Chemicals Market?
The projected CAGR is approximately 5%.
2. Which companies are prominent players in the Pine Chemicals Market?
Key companies in the market include Sunpine AB, Kraton Corporation, Pine Chemical Group, Respol Resinas SA, Mercer International, Harima Chemicals Group Inc, OOO Torgoviy Dom Lesokhimik, Ingevity Corporation, Forchem Oyj, Synthomer Plc, Arakawa Chemical Industries Ltd, DRT (Dérivés Résiniques et Terpéniques).
3. What are the main segments of the Pine Chemicals Market?
The market segments include Product Type.
4. Can you provide details about the market size?
The market size is estimated to be USD 17.3 billion as of 2022.
5. What are some drivers contributing to market growth?
Increasing Demand for Pine Chemicals in Mining and Flotation Chemicals and Lubricants; Increasing Demand from the Flavors and Fragrances Industry.
6. What are the notable trends driving market growth?
The Adhesives and Sealants Segment is expected to Dominate the Market.
7. Are there any restraints impacting market growth?
Diversion of CTO to Biofuels due to Government Incentives; Increase in the Availability of Cheaper Substitutes.
8. Can you provide examples of recent developments in the market?
March 2024: Brazilian pine chemicals group agrees to take over Pinopine, Portugal, gum rosin derivatives manufacturer. Grupo Resinas brasil (RB), one of the largest Brazilian pine chemicals producers, takes the majority share in derivatives producer Pinopine, located in Portugal.
9. What pricing options are available for accessing the report?
Pricing options include single-user, multi-user, and enterprise licenses priced at USD 4750, USD 5250, and USD 8750 respectively.
10. Is the market size provided in terms of value or volume?
The market size is provided in terms of value, measured in billion and volume, measured in K Tons.
11. Are there any specific market keywords associated with the report?
Yes, the market keyword associated with the report is "Pine Chemicals Market," which aids in identifying and referencing the specific market segment covered.
12. How do I determine which pricing option suits my needs best?
The pricing options vary based on user requirements and access needs. Individual users may opt for single-user licenses, while businesses requiring broader access may choose multi-user or enterprise licenses for cost-effective access to the report.
13. Are there any additional resources or data provided in the Pine Chemicals Market report?
While the report offers comprehensive insights, it's advisable to review the specific contents or supplementary materials provided to ascertain if additional resources or data are available.
14. How can I stay updated on further developments or reports in the Pine Chemicals Market?
To stay informed about further developments, trends, and reports in the Pine Chemicals Market, consider subscribing to industry newsletters, following relevant companies and organizations, or regularly checking reputable industry news sources and publications.
Methodology
Step 1 - Identification of Relevant Samples Size from Population Database


Step 2 - Approaches for Defining Global Market Size (Value, Volume* & Price*)

Note*: In applicable scenarios
Step 3 - Data Sources
Primary Research
- Web Analytics
- Survey Reports
- Research Institute
- Latest Research Reports
- Opinion Leaders
Secondary Research
- Annual Reports
- White Paper
- Latest Press Release
- Industry Association
- Paid Database
- Investor Presentations

Step 4 - Data Triangulation
Involves using different sources of information in order to increase the validity of a study
These sources are likely to be stakeholders in a program - participants, other researchers, program staff, other community members, and so on.
Then we put all data in single framework & apply various statistical tools to find out the dynamic on the market.
During the analysis stage, feedback from the stakeholder groups would be compared to determine areas of agreement as well as areas of divergence