Key Insights
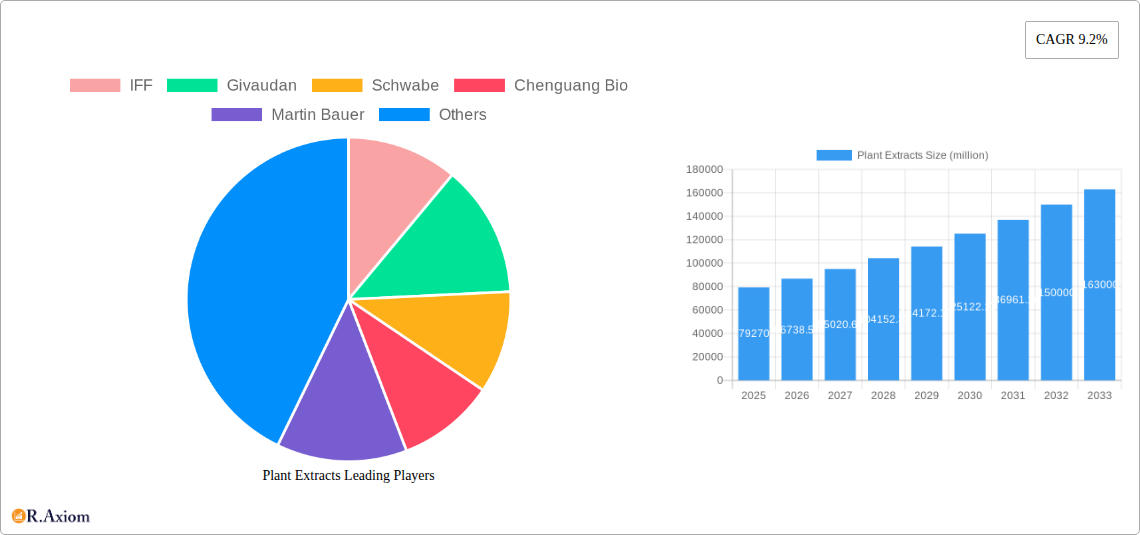
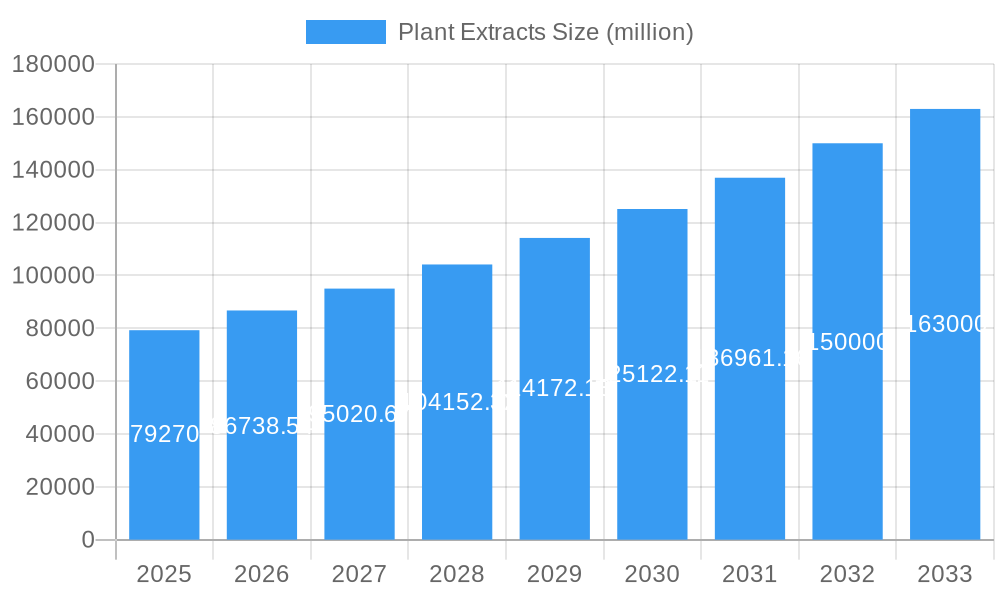
The global plant extracts market, valued at $79.27 billion in 2025, is projected to experience robust growth, driven by increasing consumer demand for natural and organic products across various industries. The market's Compound Annual Growth Rate (CAGR) of 9.2% from 2019 to 2033 signifies a significant expansion, particularly fueled by the burgeoning health and wellness sector, where plant extracts are increasingly incorporated into dietary supplements, functional foods, and beverages. Growing awareness of the health benefits associated with natural ingredients, coupled with stricter regulations on synthetic alternatives, further propels market growth. Key application areas include pharmaceuticals, cosmetics, and food and beverage, each contributing significantly to the overall market value. Competitive landscape analysis reveals a mix of large multinational corporations like IFF and Givaudan, alongside numerous smaller regional players such as Arjuna Natural Extracts and Sami-Sabinsa Group, indicating opportunities for both established businesses and emerging companies. The market’s segmentation, while not explicitly provided, likely includes various extract types (e.g., herbal extracts, fruit extracts, etc.) and their corresponding applications, further enhancing market complexity and diversification. The forecast period of 2025-2033 promises continued expansion, with growth likely influenced by factors such as technological advancements in extraction methods, increasing research and development in phytochemicals, and evolving consumer preferences toward sustainable and ethically sourced ingredients.
Plant Extracts Market Size (In Billion)
Continued growth in the plant extracts market hinges on several factors. These include successful integration of plant extracts into innovative product formulations, strategic partnerships between extract suppliers and consumer goods manufacturers, and continuous investment in research to validate the efficacy and safety of plant-based ingredients. Furthermore, addressing supply chain challenges, ensuring consistent product quality, and managing sustainability concerns will be crucial for long-term success within this dynamic and competitive market. Regional variations in market dynamics are anticipated, influenced by factors such as cultural preferences, regulatory landscapes, and economic development levels. North America and Europe are expected to maintain substantial market share, while Asia-Pacific is poised for strong growth given its large and expanding consumer base and increasing focus on traditional medicine and natural remedies. The presence of numerous companies in the market indicates a competitive landscape driving innovation and product development.
Plant Extracts Company Market Share
Plant Extracts Market Report: 2019-2033 - A Comprehensive Analysis of Growth, Innovation, and Key Players
This comprehensive report provides an in-depth analysis of the global plant extracts market, offering valuable insights into market trends, growth drivers, competitive dynamics, and future opportunities. Covering the period from 2019 to 2033, with a base year of 2025 and a forecast period from 2025 to 2033, this report is an essential resource for industry stakeholders, investors, and researchers seeking to understand and capitalize on the evolving landscape of the plant extracts sector. The market value is predicted to reach xx million by 2033.
Plant Extracts Market Concentration & Innovation
The global plant extracts market exhibits a moderately concentrated landscape, with several large multinational companies and numerous smaller regional players vying for market share. IFF, Givaudan, and Schwabe are amongst the leading players, holding a combined market share estimated at xx%. However, the market is characterized by significant innovation, driven by factors such as growing consumer demand for natural and organic products, advancements in extraction technologies, and the increasing use of plant extracts in various applications, including food and beverages, pharmaceuticals, cosmetics, and dietary supplements. Regulatory frameworks governing the use of plant extracts vary across regions, influencing market dynamics. The presence of synthetic substitutes presents competition, though the demand for natural alternatives continues to drive growth. End-user trends are strongly influenced by health and wellness concerns, leading to a preference for plant-based ingredients. Mergers and acquisitions (M&A) activity has been moderate in recent years, with deal values totaling approximately xx million in the last five years. Key examples include [insert specific M&A examples if available, otherwise state “Limited publicly available data on specific M&A activity prevents detailed examples here.”].
- Market Leaders: IFF, Givaudan, Schwabe
- Market Share of Top 3: xx%
- M&A Deal Value (2019-2024): xx million
Plant Extracts Industry Trends & Insights
The global plant extracts market is experiencing robust growth, fueled by several key factors. The increasing consumer preference for natural and organic products is a primary driver, as is the growing awareness of the health benefits associated with plant-based ingredients. Technological advancements in extraction techniques, leading to higher quality and yield, further contribute to market expansion. The rising demand for plant extracts in diverse industries, such as pharmaceuticals, cosmetics, and food and beverage, is another crucial driver. The market is also experiencing significant competitive dynamics, with both established players and new entrants vying for market share. This competition fosters innovation and product diversification. The compound annual growth rate (CAGR) for the forecast period (2025-2033) is projected to be xx%, with market penetration steadily increasing across various regions. Specific regional penetration rates and CAGR figures are detailed in subsequent sections.
Dominant Markets & Segments in Plant Extracts
The Asia-Pacific region holds the dominant position in the global plant extracts market, owing to several factors:
- Abundant Raw Material Supply: The region boasts diverse flora, offering a readily available source of raw materials.
- Growing Demand from Emerging Economies: Rising disposable incomes and increasing health consciousness in countries like China and India fuel strong demand.
- Favorable Government Policies: Supportive government regulations and initiatives promoting the herbal and natural products industries contribute to market growth.
- Established Manufacturing Base: The presence of a substantial manufacturing base and skilled workforce creates cost advantages.
China, in particular, is a major market driver due to its vast population, increasing disposable incomes, and a growing preference for traditional medicine.
Plant Extracts Product Developments
Recent advancements in extraction technologies, such as supercritical fluid extraction (SFE) and ultrasound-assisted extraction (UAE), have led to the development of higher-quality plant extracts with enhanced efficacy and purity. These improvements are particularly evident in the pharmaceutical and nutraceutical sectors, where the demand for standardized extracts with precisely defined concentrations of bioactive compounds is high. The growing focus on sustainability and environmentally friendly extraction methods is also shaping product development, with companies actively exploring eco-friendly solvents and energy-efficient processes. These innovations enable manufacturers to offer superior plant extracts while addressing growing consumer concerns about environmental impact.
Report Scope & Segmentation Analysis
This report segments the plant extracts market based on several factors, including type of extract, application, and region. Growth projections for each segment are provided, reflecting varying market dynamics. Competitive dynamics within each segment are also analyzed. [Information on each segmentation needs to be added here, e.g., By Type: (Herbs, Fruits, Vegetables, etc., with individual market sizes and growth projections), By Application: (Pharmaceuticals, Food & Beverage, Cosmetics, etc., with individual market sizes and growth projections), By Region: (North America, Europe, Asia-Pacific, etc., with individual market sizes and growth projections)].
Key Drivers of Plant Extracts Growth
Several key factors contribute to the growth of the plant extracts market. The increasing demand for natural and organic products driven by health-conscious consumers is a primary driver. Technological advancements in extraction and purification techniques are improving the quality, efficacy, and consistency of plant extracts. Favorable regulatory environments in certain regions are also supporting market expansion. The rising use of plant extracts in various applications, from pharmaceuticals and nutraceuticals to cosmetics and food and beverages, further fuels market growth.
Challenges in the Plant Extracts Sector
The plant extracts industry faces several challenges, including: fluctuating raw material prices due to seasonal variations and weather conditions, stringent regulatory requirements for quality control and safety, potential for adulteration and counterfeiting, and intense competition from synthetic alternatives. These factors can lead to supply chain disruptions, increased production costs, and market instability. The need for consistent quality control and traceability across the supply chain is paramount to ensure product safety and efficacy.
Emerging Opportunities in Plant Extracts
The plant extracts market presents several promising opportunities. Growing interest in personalized medicine and functional foods is driving demand for specialized extracts with targeted health benefits. The expansion of emerging markets in Asia and Africa offers substantial growth potential. Advancements in extraction technologies enable the development of novel extracts with enhanced efficacy and bioactivity. The increasing use of plant extracts in cosmeceuticals and personal care products is also creating new opportunities for growth.
Key Developments in Plant Extracts Industry
- [Year/Month]: [Specific development, e.g., Launch of a new extraction technology by Company X]
- [Year/Month]: [Specific development, e.g., Acquisition of Company Y by Company Z]
- [Year/Month]: [Specific development, e.g., New regulatory guidelines implemented in Region A]
- [Year/Month]: [Specific development, e.g., Introduction of a novel plant extract with enhanced efficacy by Company W] (Add more bullet points as needed)
Strategic Outlook for Plant Extracts Market
The plant extracts market is poised for sustained growth over the forecast period, driven by several factors. Continued consumer demand for natural and health-promoting ingredients will fuel market expansion. Technological innovations will enhance the quality and efficacy of plant extracts, further driving adoption. The increasing regulatory scrutiny and focus on safety and quality will create opportunities for manufacturers who adhere to high standards. Expansion into new markets and applications will create additional avenues for growth. Companies that invest in research and development, sustainable practices, and robust quality control systems will be best positioned to succeed in this dynamic market.
Plant Extracts Segmentation
-
1. Application
- 1.1. Botanical Preparations
- 1.2. Food & Beverage and Health Products
- 1.3. Skin Care Products
- 1.4. Feed
- 1.5. Others
-
2. Type
- 2.1. Powdered extracts
- 2.2. Liquid extracts
Plant Extracts Segmentation By Geography
-
1. North America
- 1.1. United States
- 1.2. Canada
- 1.3. Mexico
-
2. South America
- 2.1. Brazil
- 2.2. Argentina
- 2.3. Rest of South America
-
3. Europe
- 3.1. United Kingdom
- 3.2. Germany
- 3.3. France
- 3.4. Italy
- 3.5. Spain
- 3.6. Russia
- 3.7. Benelux
- 3.8. Nordics
- 3.9. Rest of Europe
-
4. Middle East & Africa
- 4.1. Turkey
- 4.2. Israel
- 4.3. GCC
- 4.4. North Africa
- 4.5. South Africa
- 4.6. Rest of Middle East & Africa
-
5. Asia Pacific
- 5.1. China
- 5.2. India
- 5.3. Japan
- 5.4. South Korea
- 5.5. ASEAN
- 5.6. Oceania
- 5.7. Rest of Asia Pacific

Plant Extracts Regional Market Share
Geographic Coverage of Plant Extracts
Plant Extracts REPORT HIGHLIGHTS
| Aspects | Details |
|---|---|
| Study Period | 2020-2034 |
| Base Year | 2025 |
| Estimated Year | 2026 |
| Forecast Period | 2026-2034 |
| Historical Period | 2020-2025 |
| Growth Rate | CAGR of 9.2% from 2020-2034 |
| Segmentation |
|
Table of Contents
- 1. Introduction
- 1.1. Research Scope
- 1.2. Market Segmentation
- 1.3. Research Objective
- 1.4. Definitions and Assumptions
- 2. Executive Summary
- 2.1. Market Snapshot
- 3. Market Dynamics
- 3.1. Market Drivers
- 3.2. Market Restrains
- 3.3. Market Trends
- 3.4. Market Opportunities
- 4. Market Factor Analysis
- 4.1. Porters Five Forces
- 4.1.1. Bargaining Power of Suppliers
- 4.1.2. Bargaining Power of Buyers
- 4.1.3. Threat of New Entrants
- 4.1.4. Threat of Substitutes
- 4.1.5. Competitive Rivalry
- 4.2. PESTEL analysis
- 4.3. BCG Analysis
- 4.3.1. Stars (High Growth, High Market Share)
- 4.3.2. Cash Cows (Low Growth, High Market Share)
- 4.3.3. Question Mark (High Growth, Low Market Share)
- 4.3.4. Dogs (Low Growth, Low Market Share)
- 4.4. Ansoff Matrix Analysis
- 4.5. Supply Chain Analysis
- 4.6. Regulatory Landscape
- 4.7. Current Market Potential and Opportunity Assessment (TAM–SAM–SOM Framework)
- 4.8. RAX Analyst Note
- 4.1. Porters Five Forces
- 5. Market Analysis, Insights and Forecast 2021-2033
- 5.1. Market Analysis, Insights and Forecast - by Application
- 5.1.1. Botanical Preparations
- 5.1.2. Food & Beverage and Health Products
- 5.1.3. Skin Care Products
- 5.1.4. Feed
- 5.1.5. Others
- 5.2. Market Analysis, Insights and Forecast - by Type
- 5.2.1. Powdered extracts
- 5.2.2. Liquid extracts
- 5.3. Market Analysis, Insights and Forecast - by Region
- 5.3.1. North America
- 5.3.2. South America
- 5.3.3. Europe
- 5.3.4. Middle East & Africa
- 5.3.5. Asia Pacific
- 5.1. Market Analysis, Insights and Forecast - by Application
- 6. Global Plant Extracts Analysis, Insights and Forecast, 2021-2033
- 6.1. Market Analysis, Insights and Forecast - by Application
- 6.1.1. Botanical Preparations
- 6.1.2. Food & Beverage and Health Products
- 6.1.3. Skin Care Products
- 6.1.4. Feed
- 6.1.5. Others
- 6.2. Market Analysis, Insights and Forecast - by Type
- 6.2.1. Powdered extracts
- 6.2.2. Liquid extracts
- 6.1. Market Analysis, Insights and Forecast - by Application
- 7. North America Plant Extracts Analysis, Insights and Forecast, 2020-2032
- 7.1. Market Analysis, Insights and Forecast - by Application
- 7.1.1. Botanical Preparations
- 7.1.2. Food & Beverage and Health Products
- 7.1.3. Skin Care Products
- 7.1.4. Feed
- 7.1.5. Others
- 7.2. Market Analysis, Insights and Forecast - by Type
- 7.2.1. Powdered extracts
- 7.2.2. Liquid extracts
- 7.1. Market Analysis, Insights and Forecast - by Application
- 8. South America Plant Extracts Analysis, Insights and Forecast, 2020-2032
- 8.1. Market Analysis, Insights and Forecast - by Application
- 8.1.1. Botanical Preparations
- 8.1.2. Food & Beverage and Health Products
- 8.1.3. Skin Care Products
- 8.1.4. Feed
- 8.1.5. Others
- 8.2. Market Analysis, Insights and Forecast - by Type
- 8.2.1. Powdered extracts
- 8.2.2. Liquid extracts
- 8.1. Market Analysis, Insights and Forecast - by Application
- 9. Europe Plant Extracts Analysis, Insights and Forecast, 2020-2032
- 9.1. Market Analysis, Insights and Forecast - by Application
- 9.1.1. Botanical Preparations
- 9.1.2. Food & Beverage and Health Products
- 9.1.3. Skin Care Products
- 9.1.4. Feed
- 9.1.5. Others
- 9.2. Market Analysis, Insights and Forecast - by Type
- 9.2.1. Powdered extracts
- 9.2.2. Liquid extracts
- 9.1. Market Analysis, Insights and Forecast - by Application
- 10. Middle East & Africa Plant Extracts Analysis, Insights and Forecast, 2020-2032
- 10.1. Market Analysis, Insights and Forecast - by Application
- 10.1.1. Botanical Preparations
- 10.1.2. Food & Beverage and Health Products
- 10.1.3. Skin Care Products
- 10.1.4. Feed
- 10.1.5. Others
- 10.2. Market Analysis, Insights and Forecast - by Type
- 10.2.1. Powdered extracts
- 10.2.2. Liquid extracts
- 10.1. Market Analysis, Insights and Forecast - by Application
- 11. Asia Pacific Plant Extracts Analysis, Insights and Forecast, 2020-2032
- 11.1. Market Analysis, Insights and Forecast - by Application
- 11.1.1. Botanical Preparations
- 11.1.2. Food & Beverage and Health Products
- 11.1.3. Skin Care Products
- 11.1.4. Feed
- 11.1.5. Others
- 11.2. Market Analysis, Insights and Forecast - by Type
- 11.2.1. Powdered extracts
- 11.2.2. Liquid extracts
- 11.1. Market Analysis, Insights and Forecast - by Application
- 12. Competitive Analysis
- 12.1. Company Profiles
- 12.1.1 IFF
- 12.1.1.1. Company Overview
- 12.1.1.2. Products
- 12.1.1.3. Company Financials
- 12.1.1.4. SWOT Analysis
- 12.1.2 Givaudan
- 12.1.2.1. Company Overview
- 12.1.2.2. Products
- 12.1.2.3. Company Financials
- 12.1.2.4. SWOT Analysis
- 12.1.3 Schwabe
- 12.1.3.1. Company Overview
- 12.1.3.2. Products
- 12.1.3.3. Company Financials
- 12.1.3.4. SWOT Analysis
- 12.1.4 Chenguang Bio
- 12.1.4.1. Company Overview
- 12.1.4.2. Products
- 12.1.4.3. Company Financials
- 12.1.4.4. SWOT Analysis
- 12.1.5 Martin Bauer
- 12.1.5.1. Company Overview
- 12.1.5.2. Products
- 12.1.5.3. Company Financials
- 12.1.5.4. SWOT Analysis
- 12.1.6 Jiahe Bio
- 12.1.6.1. Company Overview
- 12.1.6.2. Products
- 12.1.6.3. Company Financials
- 12.1.6.4. SWOT Analysis
- 12.1.7 Synthite
- 12.1.7.1. Company Overview
- 12.1.7.2. Products
- 12.1.7.3. Company Financials
- 12.1.7.4. SWOT Analysis
- 12.1.8 Kalsec
- 12.1.8.1. Company Overview
- 12.1.8.2. Products
- 12.1.8.3. Company Financials
- 12.1.8.4. SWOT Analysis
- 12.1.9 Laiyin Bio
- 12.1.9.1. Company Overview
- 12.1.9.2. Products
- 12.1.9.3. Company Financials
- 12.1.9.4. SWOT Analysis
- 12.1.10 Indena
- 12.1.10.1. Company Overview
- 12.1.10.2. Products
- 12.1.10.3. Company Financials
- 12.1.10.4. SWOT Analysis
- 12.1.11 Sami-Sabinsa Group
- 12.1.11.1. Company Overview
- 12.1.11.2. Products
- 12.1.11.3. Company Financials
- 12.1.11.4. SWOT Analysis
- 12.1.12 CONBA Pharma
- 12.1.12.1. Company Overview
- 12.1.12.2. Products
- 12.1.12.3. Company Financials
- 12.1.12.4. SWOT Analysis
- 12.1.13 Lvzhijian Pharma
- 12.1.13.1. Company Overview
- 12.1.13.2. Products
- 12.1.13.3. Company Financials
- 12.1.13.4. SWOT Analysis
- 12.1.14 Natural Remedies
- 12.1.14.1. Company Overview
- 12.1.14.2. Products
- 12.1.14.3. Company Financials
- 12.1.14.4. SWOT Analysis
- 12.1.15 Arjuna Natural Extracts
- 12.1.15.1. Company Overview
- 12.1.15.2. Products
- 12.1.15.3. Company Financials
- 12.1.15.4. SWOT Analysis
- 12.1.16 Oukang Bio
- 12.1.16.1. Company Overview
- 12.1.16.2. Products
- 12.1.16.3. Company Financials
- 12.1.16.4. SWOT Analysis
- 12.1.17 Jiangsu Tiansheng
- 12.1.17.1. Company Overview
- 12.1.17.2. Products
- 12.1.17.3. Company Financials
- 12.1.17.4. SWOT Analysis
- 12.1.18 Lvman Bio
- 12.1.18.1. Company Overview
- 12.1.18.2. Products
- 12.1.18.3. Company Financials
- 12.1.18.4. SWOT Analysis
- 12.1.19 Hanzhong TRG Bio
- 12.1.19.1. Company Overview
- 12.1.19.2. Products
- 12.1.19.3. Company Financials
- 12.1.19.4. SWOT Analysis
- 12.1.20 Kanglong Bio
- 12.1.20.1. Company Overview
- 12.1.20.2. Products
- 12.1.20.3. Company Financials
- 12.1.20.4. SWOT Analysis
- 12.1.1 IFF
- 12.2. Market Entropy
- 12.2.1 Company's Key Areas Served
- 12.2.2 Recent Developments
- 12.3. Company Market Share Analysis 2025
- 12.3.1 Top 5 Companies Market Share Analysis
- 12.3.2 Top 3 Companies Market Share Analysis
- 12.4. List of Potential Customers
- 13. Research Methodology
List of Figures
- Figure 1: Global Plant Extracts Revenue Breakdown (million, %) by Region 2025 & 2033
- Figure 2: North America Plant Extracts Revenue (million), by Application 2025 & 2033
- Figure 3: North America Plant Extracts Revenue Share (%), by Application 2025 & 2033
- Figure 4: North America Plant Extracts Revenue (million), by Type 2025 & 2033
- Figure 5: North America Plant Extracts Revenue Share (%), by Type 2025 & 2033
- Figure 6: North America Plant Extracts Revenue (million), by Country 2025 & 2033
- Figure 7: North America Plant Extracts Revenue Share (%), by Country 2025 & 2033
- Figure 8: South America Plant Extracts Revenue (million), by Application 2025 & 2033
- Figure 9: South America Plant Extracts Revenue Share (%), by Application 2025 & 2033
- Figure 10: South America Plant Extracts Revenue (million), by Type 2025 & 2033
- Figure 11: South America Plant Extracts Revenue Share (%), by Type 2025 & 2033
- Figure 12: South America Plant Extracts Revenue (million), by Country 2025 & 2033
- Figure 13: South America Plant Extracts Revenue Share (%), by Country 2025 & 2033
- Figure 14: Europe Plant Extracts Revenue (million), by Application 2025 & 2033
- Figure 15: Europe Plant Extracts Revenue Share (%), by Application 2025 & 2033
- Figure 16: Europe Plant Extracts Revenue (million), by Type 2025 & 2033
- Figure 17: Europe Plant Extracts Revenue Share (%), by Type 2025 & 2033
- Figure 18: Europe Plant Extracts Revenue (million), by Country 2025 & 2033
- Figure 19: Europe Plant Extracts Revenue Share (%), by Country 2025 & 2033
- Figure 20: Middle East & Africa Plant Extracts Revenue (million), by Application 2025 & 2033
- Figure 21: Middle East & Africa Plant Extracts Revenue Share (%), by Application 2025 & 2033
- Figure 22: Middle East & Africa Plant Extracts Revenue (million), by Type 2025 & 2033
- Figure 23: Middle East & Africa Plant Extracts Revenue Share (%), by Type 2025 & 2033
- Figure 24: Middle East & Africa Plant Extracts Revenue (million), by Country 2025 & 2033
- Figure 25: Middle East & Africa Plant Extracts Revenue Share (%), by Country 2025 & 2033
- Figure 26: Asia Pacific Plant Extracts Revenue (million), by Application 2025 & 2033
- Figure 27: Asia Pacific Plant Extracts Revenue Share (%), by Application 2025 & 2033
- Figure 28: Asia Pacific Plant Extracts Revenue (million), by Type 2025 & 2033
- Figure 29: Asia Pacific Plant Extracts Revenue Share (%), by Type 2025 & 2033
- Figure 30: Asia Pacific Plant Extracts Revenue (million), by Country 2025 & 2033
- Figure 31: Asia Pacific Plant Extracts Revenue Share (%), by Country 2025 & 2033
List of Tables
- Table 1: Global Plant Extracts Revenue million Forecast, by Application 2020 & 2033
- Table 2: Global Plant Extracts Revenue million Forecast, by Type 2020 & 2033
- Table 3: Global Plant Extracts Revenue million Forecast, by Region 2020 & 2033
- Table 4: Global Plant Extracts Revenue million Forecast, by Application 2020 & 2033
- Table 5: Global Plant Extracts Revenue million Forecast, by Type 2020 & 2033
- Table 6: Global Plant Extracts Revenue million Forecast, by Country 2020 & 2033
- Table 7: United States Plant Extracts Revenue (million) Forecast, by Application 2020 & 2033
- Table 8: Canada Plant Extracts Revenue (million) Forecast, by Application 2020 & 2033
- Table 9: Mexico Plant Extracts Revenue (million) Forecast, by Application 2020 & 2033
- Table 10: Global Plant Extracts Revenue million Forecast, by Application 2020 & 2033
- Table 11: Global Plant Extracts Revenue million Forecast, by Type 2020 & 2033
- Table 12: Global Plant Extracts Revenue million Forecast, by Country 2020 & 2033
- Table 13: Brazil Plant Extracts Revenue (million) Forecast, by Application 2020 & 2033
- Table 14: Argentina Plant Extracts Revenue (million) Forecast, by Application 2020 & 2033
- Table 15: Rest of South America Plant Extracts Revenue (million) Forecast, by Application 2020 & 2033
- Table 16: Global Plant Extracts Revenue million Forecast, by Application 2020 & 2033
- Table 17: Global Plant Extracts Revenue million Forecast, by Type 2020 & 2033
- Table 18: Global Plant Extracts Revenue million Forecast, by Country 2020 & 2033
- Table 19: United Kingdom Plant Extracts Revenue (million) Forecast, by Application 2020 & 2033
- Table 20: Germany Plant Extracts Revenue (million) Forecast, by Application 2020 & 2033
- Table 21: France Plant Extracts Revenue (million) Forecast, by Application 2020 & 2033
- Table 22: Italy Plant Extracts Revenue (million) Forecast, by Application 2020 & 2033
- Table 23: Spain Plant Extracts Revenue (million) Forecast, by Application 2020 & 2033
- Table 24: Russia Plant Extracts Revenue (million) Forecast, by Application 2020 & 2033
- Table 25: Benelux Plant Extracts Revenue (million) Forecast, by Application 2020 & 2033
- Table 26: Nordics Plant Extracts Revenue (million) Forecast, by Application 2020 & 2033
- Table 27: Rest of Europe Plant Extracts Revenue (million) Forecast, by Application 2020 & 2033
- Table 28: Global Plant Extracts Revenue million Forecast, by Application 2020 & 2033
- Table 29: Global Plant Extracts Revenue million Forecast, by Type 2020 & 2033
- Table 30: Global Plant Extracts Revenue million Forecast, by Country 2020 & 2033
- Table 31: Turkey Plant Extracts Revenue (million) Forecast, by Application 2020 & 2033
- Table 32: Israel Plant Extracts Revenue (million) Forecast, by Application 2020 & 2033
- Table 33: GCC Plant Extracts Revenue (million) Forecast, by Application 2020 & 2033
- Table 34: North Africa Plant Extracts Revenue (million) Forecast, by Application 2020 & 2033
- Table 35: South Africa Plant Extracts Revenue (million) Forecast, by Application 2020 & 2033
- Table 36: Rest of Middle East & Africa Plant Extracts Revenue (million) Forecast, by Application 2020 & 2033
- Table 37: Global Plant Extracts Revenue million Forecast, by Application 2020 & 2033
- Table 38: Global Plant Extracts Revenue million Forecast, by Type 2020 & 2033
- Table 39: Global Plant Extracts Revenue million Forecast, by Country 2020 & 2033
- Table 40: China Plant Extracts Revenue (million) Forecast, by Application 2020 & 2033
- Table 41: India Plant Extracts Revenue (million) Forecast, by Application 2020 & 2033
- Table 42: Japan Plant Extracts Revenue (million) Forecast, by Application 2020 & 2033
- Table 43: South Korea Plant Extracts Revenue (million) Forecast, by Application 2020 & 2033
- Table 44: ASEAN Plant Extracts Revenue (million) Forecast, by Application 2020 & 2033
- Table 45: Oceania Plant Extracts Revenue (million) Forecast, by Application 2020 & 2033
- Table 46: Rest of Asia Pacific Plant Extracts Revenue (million) Forecast, by Application 2020 & 2033
Frequently Asked Questions
1. What is the projected Compound Annual Growth Rate (CAGR) of the Plant Extracts?
The projected CAGR is approximately 9.2%.
2. Which companies are prominent players in the Plant Extracts?
Key companies in the market include IFF, Givaudan, Schwabe, Chenguang Bio, Martin Bauer, Jiahe Bio, Synthite, Kalsec, Laiyin Bio, Indena, Sami-Sabinsa Group, CONBA Pharma, Lvzhijian Pharma, Natural Remedies, Arjuna Natural Extracts, Oukang Bio, Jiangsu Tiansheng, Lvman Bio, Hanzhong TRG Bio, Kanglong Bio.
3. What are the main segments of the Plant Extracts?
The market segments include Application, Type.
4. Can you provide details about the market size?
The market size is estimated to be USD 79270 million as of 2022.
5. What are some drivers contributing to market growth?
N/A
6. What are the notable trends driving market growth?
N/A
7. Are there any restraints impacting market growth?
N/A
8. Can you provide examples of recent developments in the market?
N/A
9. What pricing options are available for accessing the report?
Pricing options include single-user, multi-user, and enterprise licenses priced at USD 2900.00, USD 4350.00, and USD 5800.00 respectively.
10. Is the market size provided in terms of value or volume?
The market size is provided in terms of value, measured in million.
11. Are there any specific market keywords associated with the report?
Yes, the market keyword associated with the report is "Plant Extracts," which aids in identifying and referencing the specific market segment covered.
12. How do I determine which pricing option suits my needs best?
The pricing options vary based on user requirements and access needs. Individual users may opt for single-user licenses, while businesses requiring broader access may choose multi-user or enterprise licenses for cost-effective access to the report.
13. Are there any additional resources or data provided in the Plant Extracts report?
While the report offers comprehensive insights, it's advisable to review the specific contents or supplementary materials provided to ascertain if additional resources or data are available.
14. How can I stay updated on further developments or reports in the Plant Extracts?
To stay informed about further developments, trends, and reports in the Plant Extracts, consider subscribing to industry newsletters, following relevant companies and organizations, or regularly checking reputable industry news sources and publications.
Methodology
Step 1 - Identification of Relevant Samples Size from Population Database


Step 2 - Approaches for Defining Global Market Size (Value, Volume* & Price*)

Note*: In applicable scenarios
Step 3 - Data Sources
Primary Research
- Web Analytics
- Survey Reports
- Research Institute
- Latest Research Reports
- Opinion Leaders
Secondary Research
- Annual Reports
- White Paper
- Latest Press Release
- Industry Association
- Paid Database
- Investor Presentations

Step 4 - Data Triangulation
Involves using different sources of information in order to increase the validity of a study
These sources are likely to be stakeholders in a program - participants, other researchers, program staff, other community members, and so on.
Then we put all data in single framework & apply various statistical tools to find out the dynamic on the market.
During the analysis stage, feedback from the stakeholder groups would be compared to determine areas of agreement as well as areas of divergence

