

Key Insights
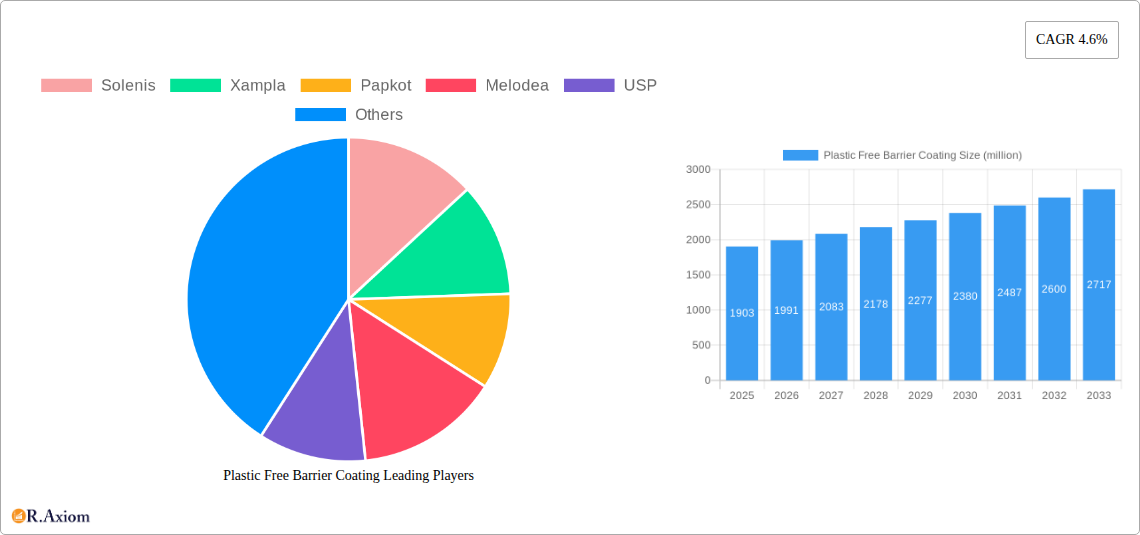
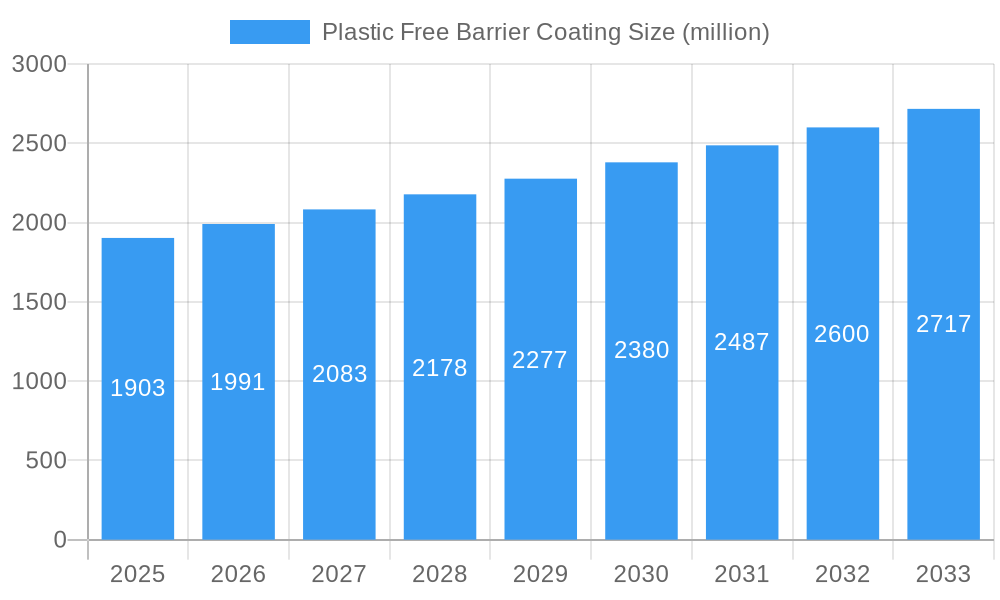
The global Plastic-Free Barrier Coating market is poised for significant expansion, with an estimated market size of USD 1903 million in 2025. Driven by an escalating consumer demand for sustainable packaging solutions and increasingly stringent environmental regulations worldwide, the market is projected to witness a robust Compound Annual Growth Rate (CAGR) of 4.6% throughout the forecast period of 2025-2033. This growth is underpinned by a growing awareness of plastic pollution's detrimental effects and a proactive shift by manufacturers to embrace eco-friendly alternatives. Key applications like flexible packaging, paperboard, and other specialized uses are benefiting from advancements in bio-based and water-based coating technologies, offering excellent barrier properties against moisture, grease, and oxygen without compromising recyclability or compostability. The inherent advantages of these coatings in reducing environmental footprint are compelling brands to invest in this sustainable innovation.
Plastic Free Barrier Coating Market Size (In Billion)
The market's upward trajectory is further fueled by ongoing research and development in advanced coating formulations, including sophisticated bio-based polymers and novel ceramic applications, which promise enhanced performance and broader applicability. While the market is largely driven by sustainability mandates and consumer preferences, potential restraints include the initial cost of implementation for some bio-based solutions and the need for further standardization in recycling infrastructure for certain novel materials. However, the long-term economic and environmental benefits, coupled with strategic collaborations between key players such as Solenis, Xampla, and Ingredion, are expected to mitigate these challenges. The market is characterized by a diverse range of segments, with bio-based coatings and water-based coatings leading the charge in type, catering to applications that demand both performance and environmental responsibility, thereby shaping a greener future for the packaging industry.
Plastic Free Barrier Coating Company Market Share
Plastic Free Barrier Coating Market Concentration & Innovation
The global plastic-free barrier coating market exhibits a moderate to high concentration, driven by the increasing demand for sustainable packaging solutions. Key players like Solenis, Covestro, Kemira, and Lubrizol hold significant market share, estimated to be over $250 million collectively in the base year of 2025. Innovation is a primary catalyst, with substantial investment flowing into developing novel bio-based and ceramic barrier technologies. Regulatory frameworks, particularly in Europe and North America, mandating reduced plastic usage and promoting circular economy principles, are accelerating market penetration. For instance, Extended Producer Responsibility (EPR) schemes are incentivizing the adoption of recyclable and compostable packaging.
Product substitutes, including traditional plastic films and metalized materials, are being actively displaced by high-performance plastic-free alternatives. End-user trends overwhelmingly favor sustainable packaging, with consumers demonstrating a willingness to pay a premium for eco-friendly products. This sentiment is reflected in the food and beverage, pharmaceutical, and cosmetic sectors. Mergers and acquisitions (M&A) are playing a crucial role in market consolidation and innovation. Expected M&A deal values in the sector are projected to reach over $50 million annually between 2025 and 2033, as larger companies seek to acquire specialized technologies and expand their sustainable product portfolios.
Plastic Free Barrier Coating Industry Trends & Insights
The plastic-free barrier coating market is experiencing robust growth, projected at a Compound Annual Growth Rate (CAGR) of approximately 12.5% from 2025 to 2033. This upward trajectory is fueled by a confluence of powerful market drivers and transformative industry trends. A primary driver is the escalating global concern over plastic pollution and its detrimental environmental impact. Governments worldwide are implementing stricter regulations, including outright bans on single-use plastics and mandatory recycled content mandates, creating a fertile ground for plastic-free alternatives. Consumer preferences are undergoing a significant shift, with an increasing demand for sustainable, recyclable, and compostable packaging. This conscious consumerism translates into substantial market penetration for innovative barrier solutions.
Technological disruptions are at the forefront of this evolution. Companies are heavily investing in research and development to create advanced bio-based coatings derived from renewable resources such as starch, cellulose, chitin, and PHA (polyhydroxyalkanoates). These materials offer comparable or superior barrier properties to traditional plastics, providing excellent resistance to oxygen, moisture, and grease. Ceramic barrier coatings, another burgeoning segment, are gaining traction for their high-performance characteristics and suitability for demanding applications. The integration of advanced manufacturing techniques, including digital printing and precision coating, is further enhancing the efficiency and scalability of plastic-free barrier coating production.
Competitive dynamics are intensifying as established chemical companies, specialty coating manufacturers, and innovative startups vie for market dominance. Strategic collaborations and partnerships are becoming commonplace, enabling players to leverage complementary expertise and accelerate product development and market entry. The increasing focus on the circular economy principles is also driving innovation in the end-of-life management of plastic-free packaging, with a growing emphasis on compostability and recyclability. The market penetration of these solutions is expected to surpass 30% by 2030, driven by both regulatory push and consumer pull. The historical period of 2019-2024 saw the foundational development and initial adoption of these technologies, laying the groundwork for the accelerated growth anticipated in the forecast period of 2025-2033.
Dominant Markets & Segments in Plastic Free Barrier Coating
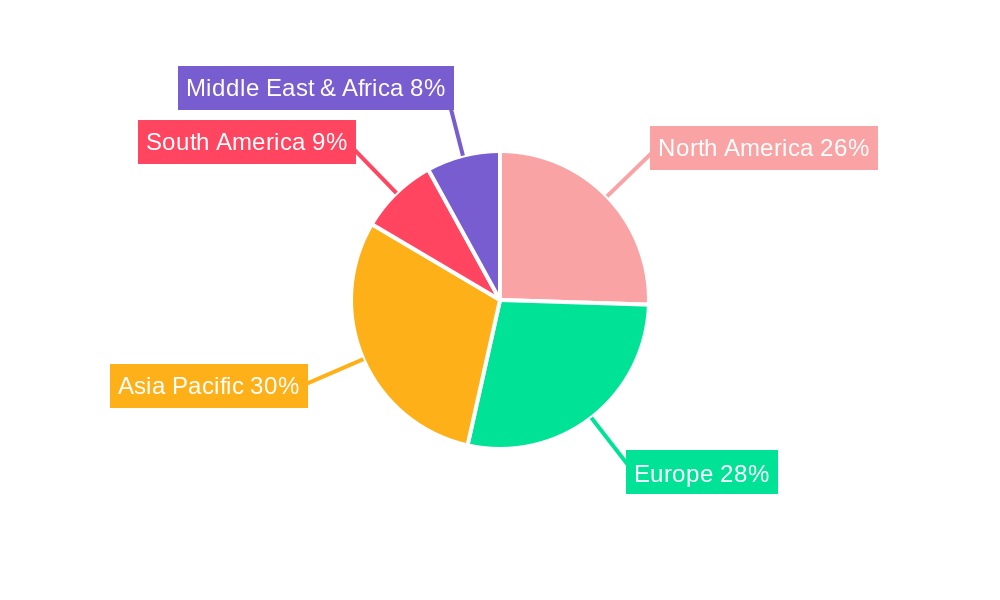
The plastic-free barrier coating market demonstrates significant regional and segment dominance, driven by a combination of proactive regulatory environments, robust industrial bases, and evolving consumer demands. Europe currently leads the market, largely due to stringent environmental legislation and a strong consumer appetite for sustainable products. Countries like Germany, France, and the UK are at the forefront of adopting plastic-free packaging solutions, supported by government initiatives and industry-led sustainability targets.
Within the Application segmentation, Flexible Packaging Paper is a dominant segment, accounting for an estimated 45% of the market share in the base year of 2025. The vastness of the flexible packaging industry, encompassing food and beverage, pharmaceutical, and personal care products, makes it a primary beneficiary of plastic-free barrier coatings. The inherent recyclability and compostability of paper-based flexible packaging, when enhanced with these coatings, offer a compelling alternative to conventional plastic laminates.
The Paperboard segment is also a significant and growing contributor, projected to capture approximately 35% of the market by 2025. Its widespread use in secondary and tertiary packaging, alongside an increasing demand for sustainable primary packaging for products like ready-to-eat meals and cosmetics, fuels its dominance. Key drivers for paperboard include its renewable nature and established recycling infrastructure.
The Type segmentation reveals the Bio-Based Coatings segment as the fastest-growing and a key driver of market dominance, expected to hold over 50% market share by 2025. This growth is fueled by advancements in material science and the development of high-performance bio-polymers and natural derivatives. Companies like Xampla, Melodea, OrganoClick, and Ingredion are instrumental in this segment's expansion.
Water-Based Coatings represent another substantial segment, projected to account for around 30% of the market in 2025. Their environmental advantages, lower VOC emissions, and compatibility with existing paper and board manufacturing processes make them a popular choice for numerous applications. Solenis, Kemira, and USP are prominent players in this area.
The dominance of these segments is underpinned by several factors:
- Economic Policies: Subsidies for sustainable materials, taxes on virgin plastics, and circular economy incentives significantly boost the adoption of plastic-free barrier coatings. The European Union's Green Deal and similar initiatives worldwide are direct catalysts.
- Infrastructure Development: The availability of robust recycling and composting infrastructure for paper and paperboard packaging supports the demand for coated materials. Investments in new waste management technologies further strengthen this advantage.
- Technological Advancements: Continuous innovation in barrier performance, cost-effectiveness, and application methods makes plastic-free solutions increasingly competitive with traditional plastics. This includes enhanced grease, moisture, and oxygen barrier properties.
- Consumer Preferences: Growing environmental awareness and a desire for eco-friendly products drive brand owners to adopt sustainable packaging, thus creating pull for these specialized coatings.
- Regulatory Frameworks: Bans on specific plastic items and mandates for reduced plastic usage are powerful drivers, compelling manufacturers to seek viable alternatives.
The Others category for both Application and Type segments, while smaller, represents niche markets and emerging technologies that are expected to grow significantly in the forecast period.
Plastic Free Barrier Coating Product Developments
Product innovation in the plastic-free barrier coating market is characterized by advancements in bio-based materials, enhanced barrier properties, and improved sustainability profiles. Companies are developing novel coatings derived from renewable sources like seaweed, plant starches, and agricultural by-products, offering excellent moisture, grease, and oxygen barrier performance. For instance, Xampla's edible and biodegradable barrier coatings, derived from plant proteins, are revolutionizing food packaging. Melodea's cellulose-based coatings provide a sustainable alternative with high barrier capabilities. The focus is on creating coatings that are not only functional but also compostable or readily recyclable, aligning with circular economy principles. These developments offer significant competitive advantages by meeting stringent environmental regulations and appealing to eco-conscious consumers.
Report Scope & Segmentation Analysis
This report provides a comprehensive analysis of the global plastic-free barrier coating market, segmented across key areas to offer detailed insights. The Application segmentation includes Flexible Packaging Paper, which encompasses a wide array of paper-based materials used for pouches, sachets, and wraps, projected to witness a CAGR of 13.0% from 2025-2033. Paperboard applications, used in cartons, boxes, and folding cartons, are expected to grow at a CAGR of 11.5%. The Others segment, comprising specialty papers and emerging applications, is anticipated to expand at a CAGR of 10.0%.
The Type segmentation delves into the core technologies driving market growth. Bio-Based Coatings are projected to experience the highest CAGR of 14.5%, driven by strong sustainability demands. Ceramic Coatings, offering superior barrier properties for demanding applications, are forecast to grow at a CAGR of 11.0%. Water-Based Coatings, a well-established and environmentally friendly option, are expected to grow at a CAGR of 10.5%. The Others segment, encompassing emerging technologies and hybrid solutions, is projected to grow at a CAGR of 9.5%. Each segment's market size and competitive dynamics have been meticulously analyzed for the study period.
Key Drivers of Plastic Free Barrier Coating Growth
The plastic-free barrier coating market is propelled by several intertwined growth drivers. Stringent environmental regulations worldwide, mandating reduced plastic usage and promoting circularity, are a paramount factor. For example, the EU's Single-Use Plastics Directive and various national EPR schemes are creating a significant pull for alternative materials. Escalating consumer demand for sustainable products is another powerful catalyst, with consumers actively seeking brands that demonstrate environmental responsibility. This sentiment translates into brand owner adoption of eco-friendly packaging. Technological advancements in bio-based and high-performance barrier materials are making these solutions increasingly viable and cost-competitive with traditional plastics. Innovations in cellulose, chitin, and PHA-based coatings are expanding application possibilities. Furthermore, the growing awareness of microplastic pollution and its ecological impact is accelerating the shift away from plastic-based packaging.
Challenges in the Plastic Free Barrier Coating Sector
Despite the strong growth trajectory, the plastic-free barrier coating sector faces several challenges. Scalability and cost-competitiveness remain key hurdles. While innovations are ongoing, achieving economies of scale comparable to established plastic production can be difficult, leading to higher initial costs for some plastic-free alternatives. Performance limitations in specific applications can also be a restraint; achieving the exact same barrier properties (e.g., extreme heat resistance or prolonged shelf-life for highly sensitive products) as some traditional plastics can still be challenging with certain bio-based or paper coatings. Infrastructure for end-of-life management, particularly for compostable materials, can be inconsistent across regions, leading to confusion and improper disposal. Finally, supply chain complexities and raw material sourcing for novel bio-based materials can present challenges in ensuring consistent availability and quality.
Emerging Opportunities in Plastic Free Barrier Coating
The plastic-free barrier coating market is ripe with emerging opportunities. The expansion into new end-use industries beyond food and beverage, such as pharmaceuticals, cosmetics, and e-commerce packaging, presents significant growth potential. The development of highly specialized barrier coatings tailored for specific product requirements, like advanced oxygen barriers for sensitive electronics or grease barriers for fast food packaging, offers niche market advantages. The integration of smart functionalities into plastic-free packaging, such as indicators for freshness or tamper evidence, opens up innovative product development avenues. Furthermore, the increasing focus on enabling true circularity through improved recyclability and compostability certifications and infrastructure development presents a substantial opportunity for market leadership. The development of cost-effective and high-volume production technologies will also unlock broader market adoption.
Leading Players in the Plastic Free Barrier Coating Market
Solenis Xampla Papkot Melodea USP APC Group Covestro Greendot Biopak Ingredion Kemira Lubrizol Nordic Barrier Coating OrganoClick
Key Developments in Plastic Free Barrier Coating Industry
- 2024: Launch of a new generation of high-barrier bio-based coatings by OrganoClick, offering enhanced moisture and oxygen resistance for food packaging.
- 2023: Xampla secures significant funding to scale production of its plant-protein-based barrier coatings for food and beverage applications.
- 2023: Covestro introduces a new series of water-based polyurethane dispersions for paper and board coatings, focusing on improved sustainability.
- 2022: Solenis expands its portfolio of functional barrier coatings for paper and board, emphasizing PFAS-free solutions.
- 2022: Melodea develops advanced cellulose nanofiber-based coatings for enhanced barrier properties in flexible packaging.
- 2021: Papkot announces strategic partnerships to develop compostable paperboard packaging solutions for the confectionery industry.
- 2021: Ingredion launches a new line of bio-based polymers designed for barrier coating applications in paper packaging.
- 2020: APC Group invests in R&D for ceramic barrier coatings, targeting high-performance industrial packaging.
- 2020: Greendot Biopak introduces innovative PLA-based coatings for compostable flexible packaging solutions.
- 2019: Kemira focuses on sustainable water-based barrier coatings to replace traditional plastic laminates in food packaging.
- 2019: Lubrizol explores novel bio-based chemistries for barrier coating formulations with improved environmental profiles.
- 2019: Nordic Barrier Coating launches a new range of PFAS-free, oil-and-grease resistant coatings for paper packaging.
- 2019: USP highlights advancements in water-based barrier coatings for enhanced recyclability of paper packaging.
Strategic Outlook for Plastic Free Barrier Coating Market
The strategic outlook for the plastic-free barrier coating market is exceptionally positive, driven by a convergence of regulatory mandates, shifting consumer preferences, and continuous technological innovation. The forecast period of 2025-2033 is poised to witness accelerated adoption as performance and cost-effectiveness continue to improve. Key growth catalysts include the ongoing expansion of bio-based materials, the development of high-barrier ceramic solutions for specialized applications, and the increasing integration of these coatings into global supply chains. Strategic collaborations between raw material suppliers, coating manufacturers, and packaging converters will be crucial for scaling production and ensuring market penetration. The industry's ability to address remaining challenges in cost and performance variability will further solidify its position as the dominant packaging barrier solution of the future, offering a clear path toward a more sustainable and circular economy.
Plastic Free Barrier Coating Segmentation
-
1. Application
- 1.1. Flexible Packaging Paper
- 1.2. Paperboard
- 1.3. Others
-
2. Type
- 2.1. Bio-Based Coatings
- 2.2. Ceramic Coatings
- 2.3. Water-Based Coatings
- 2.4. Others
Plastic Free Barrier Coating Segmentation By Geography
-
1. North America
- 1.1. United States
- 1.2. Canada
- 1.3. Mexico
-
2. South America
- 2.1. Brazil
- 2.2. Argentina
- 2.3. Rest of South America
-
3. Europe
- 3.1. United Kingdom
- 3.2. Germany
- 3.3. France
- 3.4. Italy
- 3.5. Spain
- 3.6. Russia
- 3.7. Benelux
- 3.8. Nordics
- 3.9. Rest of Europe
-
4. Middle East & Africa
- 4.1. Turkey
- 4.2. Israel
- 4.3. GCC
- 4.4. North Africa
- 4.5. South Africa
- 4.6. Rest of Middle East & Africa
-
5. Asia Pacific
- 5.1. China
- 5.2. India
- 5.3. Japan
- 5.4. South Korea
- 5.5. ASEAN
- 5.6. Oceania
- 5.7. Rest of Asia Pacific
Plastic Free Barrier Coating Regional Market Share
Geographic Coverage of Plastic Free Barrier Coating
Plastic Free Barrier Coating REPORT HIGHLIGHTS
| Aspects | Details |
|---|---|
| Study Period | 2020-2034 |
| Base Year | 2025 |
| Estimated Year | 2026 |
| Forecast Period | 2026-2034 |
| Historical Period | 2020-2025 |
| Growth Rate | CAGR of 4.6% from 2020-2034 |
| Segmentation |
|
Table of Contents
- 1. Introduction
- 1.1. Research Scope
- 1.2. Market Segmentation
- 1.3. Research Objective
- 1.4. Definitions and Assumptions
- 2. Executive Summary
- 2.1. Market Snapshot
- 3. Market Dynamics
- 3.1. Market Drivers
- 3.2. Market Restrains
- 3.3. Market Trends
- 3.4. Market Opportunities
- 4. Market Factor Analysis
- 4.1. Porters Five Forces
- 4.1.1. Bargaining Power of Suppliers
- 4.1.2. Bargaining Power of Buyers
- 4.1.3. Threat of New Entrants
- 4.1.4. Threat of Substitutes
- 4.1.5. Competitive Rivalry
- 4.2. PESTEL analysis
- 4.3. BCG Analysis
- 4.3.1. Stars (High Growth, High Market Share)
- 4.3.2. Cash Cows (Low Growth, High Market Share)
- 4.3.3. Question Mark (High Growth, Low Market Share)
- 4.3.4. Dogs (Low Growth, Low Market Share)
- 4.4. Ansoff Matrix Analysis
- 4.5. Supply Chain Analysis
- 4.6. Regulatory Landscape
- 4.7. Current Market Potential and Opportunity Assessment (TAM–SAM–SOM Framework)
- 4.8. RAX Analyst Note
- 4.1. Porters Five Forces
- 5. Market Analysis, Insights and Forecast 2021-2033
- 5.1. Market Analysis, Insights and Forecast - by Application
- 5.1.1. Flexible Packaging Paper
- 5.1.2. Paperboard
- 5.1.3. Others
- 5.2. Market Analysis, Insights and Forecast - by Type
- 5.2.1. Bio-Based Coatings
- 5.2.2. Ceramic Coatings
- 5.2.3. Water-Based Coatings
- 5.2.4. Others
- 5.3. Market Analysis, Insights and Forecast - by Region
- 5.3.1. North America
- 5.3.2. South America
- 5.3.3. Europe
- 5.3.4. Middle East & Africa
- 5.3.5. Asia Pacific
- 5.1. Market Analysis, Insights and Forecast - by Application
- 6. Global Plastic Free Barrier Coating Analysis, Insights and Forecast, 2021-2033
- 6.1. Market Analysis, Insights and Forecast - by Application
- 6.1.1. Flexible Packaging Paper
- 6.1.2. Paperboard
- 6.1.3. Others
- 6.2. Market Analysis, Insights and Forecast - by Type
- 6.2.1. Bio-Based Coatings
- 6.2.2. Ceramic Coatings
- 6.2.3. Water-Based Coatings
- 6.2.4. Others
- 6.1. Market Analysis, Insights and Forecast - by Application
- 7. North America Plastic Free Barrier Coating Analysis, Insights and Forecast, 2020-2032
- 7.1. Market Analysis, Insights and Forecast - by Application
- 7.1.1. Flexible Packaging Paper
- 7.1.2. Paperboard
- 7.1.3. Others
- 7.2. Market Analysis, Insights and Forecast - by Type
- 7.2.1. Bio-Based Coatings
- 7.2.2. Ceramic Coatings
- 7.2.3. Water-Based Coatings
- 7.2.4. Others
- 7.1. Market Analysis, Insights and Forecast - by Application
- 8. South America Plastic Free Barrier Coating Analysis, Insights and Forecast, 2020-2032
- 8.1. Market Analysis, Insights and Forecast - by Application
- 8.1.1. Flexible Packaging Paper
- 8.1.2. Paperboard
- 8.1.3. Others
- 8.2. Market Analysis, Insights and Forecast - by Type
- 8.2.1. Bio-Based Coatings
- 8.2.2. Ceramic Coatings
- 8.2.3. Water-Based Coatings
- 8.2.4. Others
- 8.1. Market Analysis, Insights and Forecast - by Application
- 9. Europe Plastic Free Barrier Coating Analysis, Insights and Forecast, 2020-2032
- 9.1. Market Analysis, Insights and Forecast - by Application
- 9.1.1. Flexible Packaging Paper
- 9.1.2. Paperboard
- 9.1.3. Others
- 9.2. Market Analysis, Insights and Forecast - by Type
- 9.2.1. Bio-Based Coatings
- 9.2.2. Ceramic Coatings
- 9.2.3. Water-Based Coatings
- 9.2.4. Others
- 9.1. Market Analysis, Insights and Forecast - by Application
- 10. Middle East & Africa Plastic Free Barrier Coating Analysis, Insights and Forecast, 2020-2032
- 10.1. Market Analysis, Insights and Forecast - by Application
- 10.1.1. Flexible Packaging Paper
- 10.1.2. Paperboard
- 10.1.3. Others
- 10.2. Market Analysis, Insights and Forecast - by Type
- 10.2.1. Bio-Based Coatings
- 10.2.2. Ceramic Coatings
- 10.2.3. Water-Based Coatings
- 10.2.4. Others
- 10.1. Market Analysis, Insights and Forecast - by Application
- 11. Asia Pacific Plastic Free Barrier Coating Analysis, Insights and Forecast, 2020-2032
- 11.1. Market Analysis, Insights and Forecast - by Application
- 11.1.1. Flexible Packaging Paper
- 11.1.2. Paperboard
- 11.1.3. Others
- 11.2. Market Analysis, Insights and Forecast - by Type
- 11.2.1. Bio-Based Coatings
- 11.2.2. Ceramic Coatings
- 11.2.3. Water-Based Coatings
- 11.2.4. Others
- 11.1. Market Analysis, Insights and Forecast - by Application
- 12. Competitive Analysis
- 12.1. Company Profiles
- 12.1.1 Solenis
- 12.1.1.1. Company Overview
- 12.1.1.2. Products
- 12.1.1.3. Company Financials
- 12.1.1.4. SWOT Analysis
- 12.1.2 Xampla
- 12.1.2.1. Company Overview
- 12.1.2.2. Products
- 12.1.2.3. Company Financials
- 12.1.2.4. SWOT Analysis
- 12.1.3 Papkot
- 12.1.3.1. Company Overview
- 12.1.3.2. Products
- 12.1.3.3. Company Financials
- 12.1.3.4. SWOT Analysis
- 12.1.4 Melodea
- 12.1.4.1. Company Overview
- 12.1.4.2. Products
- 12.1.4.3. Company Financials
- 12.1.4.4. SWOT Analysis
- 12.1.5 USP
- 12.1.5.1. Company Overview
- 12.1.5.2. Products
- 12.1.5.3. Company Financials
- 12.1.5.4. SWOT Analysis
- 12.1.6 APC Group
- 12.1.6.1. Company Overview
- 12.1.6.2. Products
- 12.1.6.3. Company Financials
- 12.1.6.4. SWOT Analysis
- 12.1.7 Covestro
- 12.1.7.1. Company Overview
- 12.1.7.2. Products
- 12.1.7.3. Company Financials
- 12.1.7.4. SWOT Analysis
- 12.1.8 Greendot Biopak
- 12.1.8.1. Company Overview
- 12.1.8.2. Products
- 12.1.8.3. Company Financials
- 12.1.8.4. SWOT Analysis
- 12.1.9 Ingredion
- 12.1.9.1. Company Overview
- 12.1.9.2. Products
- 12.1.9.3. Company Financials
- 12.1.9.4. SWOT Analysis
- 12.1.10 Kemira
- 12.1.10.1. Company Overview
- 12.1.10.2. Products
- 12.1.10.3. Company Financials
- 12.1.10.4. SWOT Analysis
- 12.1.11 Lubrizol
- 12.1.11.1. Company Overview
- 12.1.11.2. Products
- 12.1.11.3. Company Financials
- 12.1.11.4. SWOT Analysis
- 12.1.12 Nordic Barrier Coating
- 12.1.12.1. Company Overview
- 12.1.12.2. Products
- 12.1.12.3. Company Financials
- 12.1.12.4. SWOT Analysis
- 12.1.13 OrganoClick
- 12.1.13.1. Company Overview
- 12.1.13.2. Products
- 12.1.13.3. Company Financials
- 12.1.13.4. SWOT Analysis
- 12.1.1 Solenis
- 12.2. Market Entropy
- 12.2.1 Company's Key Areas Served
- 12.2.2 Recent Developments
- 12.3. Company Market Share Analysis 2025
- 12.3.1 Top 5 Companies Market Share Analysis
- 12.3.2 Top 3 Companies Market Share Analysis
- 12.4. List of Potential Customers
- 13. Research Methodology
List of Figures
- Figure 1: Global Plastic Free Barrier Coating Revenue Breakdown (million, %) by Region 2025 & 2033
- Figure 2: Global Plastic Free Barrier Coating Volume Breakdown (K, %) by Region 2025 & 2033
- Figure 3: North America Plastic Free Barrier Coating Revenue (million), by Application 2025 & 2033
- Figure 4: North America Plastic Free Barrier Coating Volume (K), by Application 2025 & 2033
- Figure 5: North America Plastic Free Barrier Coating Revenue Share (%), by Application 2025 & 2033
- Figure 6: North America Plastic Free Barrier Coating Volume Share (%), by Application 2025 & 2033
- Figure 7: North America Plastic Free Barrier Coating Revenue (million), by Type 2025 & 2033
- Figure 8: North America Plastic Free Barrier Coating Volume (K), by Type 2025 & 2033
- Figure 9: North America Plastic Free Barrier Coating Revenue Share (%), by Type 2025 & 2033
- Figure 10: North America Plastic Free Barrier Coating Volume Share (%), by Type 2025 & 2033
- Figure 11: North America Plastic Free Barrier Coating Revenue (million), by Country 2025 & 2033
- Figure 12: North America Plastic Free Barrier Coating Volume (K), by Country 2025 & 2033
- Figure 13: North America Plastic Free Barrier Coating Revenue Share (%), by Country 2025 & 2033
- Figure 14: North America Plastic Free Barrier Coating Volume Share (%), by Country 2025 & 2033
- Figure 15: South America Plastic Free Barrier Coating Revenue (million), by Application 2025 & 2033
- Figure 16: South America Plastic Free Barrier Coating Volume (K), by Application 2025 & 2033
- Figure 17: South America Plastic Free Barrier Coating Revenue Share (%), by Application 2025 & 2033
- Figure 18: South America Plastic Free Barrier Coating Volume Share (%), by Application 2025 & 2033
- Figure 19: South America Plastic Free Barrier Coating Revenue (million), by Type 2025 & 2033
- Figure 20: South America Plastic Free Barrier Coating Volume (K), by Type 2025 & 2033
- Figure 21: South America Plastic Free Barrier Coating Revenue Share (%), by Type 2025 & 2033
- Figure 22: South America Plastic Free Barrier Coating Volume Share (%), by Type 2025 & 2033
- Figure 23: South America Plastic Free Barrier Coating Revenue (million), by Country 2025 & 2033
- Figure 24: South America Plastic Free Barrier Coating Volume (K), by Country 2025 & 2033
- Figure 25: South America Plastic Free Barrier Coating Revenue Share (%), by Country 2025 & 2033
- Figure 26: South America Plastic Free Barrier Coating Volume Share (%), by Country 2025 & 2033
- Figure 27: Europe Plastic Free Barrier Coating Revenue (million), by Application 2025 & 2033
- Figure 28: Europe Plastic Free Barrier Coating Volume (K), by Application 2025 & 2033
- Figure 29: Europe Plastic Free Barrier Coating Revenue Share (%), by Application 2025 & 2033
- Figure 30: Europe Plastic Free Barrier Coating Volume Share (%), by Application 2025 & 2033
- Figure 31: Europe Plastic Free Barrier Coating Revenue (million), by Type 2025 & 2033
- Figure 32: Europe Plastic Free Barrier Coating Volume (K), by Type 2025 & 2033
- Figure 33: Europe Plastic Free Barrier Coating Revenue Share (%), by Type 2025 & 2033
- Figure 34: Europe Plastic Free Barrier Coating Volume Share (%), by Type 2025 & 2033
- Figure 35: Europe Plastic Free Barrier Coating Revenue (million), by Country 2025 & 2033
- Figure 36: Europe Plastic Free Barrier Coating Volume (K), by Country 2025 & 2033
- Figure 37: Europe Plastic Free Barrier Coating Revenue Share (%), by Country 2025 & 2033
- Figure 38: Europe Plastic Free Barrier Coating Volume Share (%), by Country 2025 & 2033
- Figure 39: Middle East & Africa Plastic Free Barrier Coating Revenue (million), by Application 2025 & 2033
- Figure 40: Middle East & Africa Plastic Free Barrier Coating Volume (K), by Application 2025 & 2033
- Figure 41: Middle East & Africa Plastic Free Barrier Coating Revenue Share (%), by Application 2025 & 2033
- Figure 42: Middle East & Africa Plastic Free Barrier Coating Volume Share (%), by Application 2025 & 2033
- Figure 43: Middle East & Africa Plastic Free Barrier Coating Revenue (million), by Type 2025 & 2033
- Figure 44: Middle East & Africa Plastic Free Barrier Coating Volume (K), by Type 2025 & 2033
- Figure 45: Middle East & Africa Plastic Free Barrier Coating Revenue Share (%), by Type 2025 & 2033
- Figure 46: Middle East & Africa Plastic Free Barrier Coating Volume Share (%), by Type 2025 & 2033
- Figure 47: Middle East & Africa Plastic Free Barrier Coating Revenue (million), by Country 2025 & 2033
- Figure 48: Middle East & Africa Plastic Free Barrier Coating Volume (K), by Country 2025 & 2033
- Figure 49: Middle East & Africa Plastic Free Barrier Coating Revenue Share (%), by Country 2025 & 2033
- Figure 50: Middle East & Africa Plastic Free Barrier Coating Volume Share (%), by Country 2025 & 2033
- Figure 51: Asia Pacific Plastic Free Barrier Coating Revenue (million), by Application 2025 & 2033
- Figure 52: Asia Pacific Plastic Free Barrier Coating Volume (K), by Application 2025 & 2033
- Figure 53: Asia Pacific Plastic Free Barrier Coating Revenue Share (%), by Application 2025 & 2033
- Figure 54: Asia Pacific Plastic Free Barrier Coating Volume Share (%), by Application 2025 & 2033
- Figure 55: Asia Pacific Plastic Free Barrier Coating Revenue (million), by Type 2025 & 2033
- Figure 56: Asia Pacific Plastic Free Barrier Coating Volume (K), by Type 2025 & 2033
- Figure 57: Asia Pacific Plastic Free Barrier Coating Revenue Share (%), by Type 2025 & 2033
- Figure 58: Asia Pacific Plastic Free Barrier Coating Volume Share (%), by Type 2025 & 2033
- Figure 59: Asia Pacific Plastic Free Barrier Coating Revenue (million), by Country 2025 & 2033
- Figure 60: Asia Pacific Plastic Free Barrier Coating Volume (K), by Country 2025 & 2033
- Figure 61: Asia Pacific Plastic Free Barrier Coating Revenue Share (%), by Country 2025 & 2033
- Figure 62: Asia Pacific Plastic Free Barrier Coating Volume Share (%), by Country 2025 & 2033
List of Tables
- Table 1: Global Plastic Free Barrier Coating Revenue million Forecast, by Application 2020 & 2033
- Table 2: Global Plastic Free Barrier Coating Volume K Forecast, by Application 2020 & 2033
- Table 3: Global Plastic Free Barrier Coating Revenue million Forecast, by Type 2020 & 2033
- Table 4: Global Plastic Free Barrier Coating Volume K Forecast, by Type 2020 & 2033
- Table 5: Global Plastic Free Barrier Coating Revenue million Forecast, by Region 2020 & 2033
- Table 6: Global Plastic Free Barrier Coating Volume K Forecast, by Region 2020 & 2033
- Table 7: Global Plastic Free Barrier Coating Revenue million Forecast, by Application 2020 & 2033
- Table 8: Global Plastic Free Barrier Coating Volume K Forecast, by Application 2020 & 2033
- Table 9: Global Plastic Free Barrier Coating Revenue million Forecast, by Type 2020 & 2033
- Table 10: Global Plastic Free Barrier Coating Volume K Forecast, by Type 2020 & 2033
- Table 11: Global Plastic Free Barrier Coating Revenue million Forecast, by Country 2020 & 2033
- Table 12: Global Plastic Free Barrier Coating Volume K Forecast, by Country 2020 & 2033
- Table 13: United States Plastic Free Barrier Coating Revenue (million) Forecast, by Application 2020 & 2033
- Table 14: United States Plastic Free Barrier Coating Volume (K) Forecast, by Application 2020 & 2033
- Table 15: Canada Plastic Free Barrier Coating Revenue (million) Forecast, by Application 2020 & 2033
- Table 16: Canada Plastic Free Barrier Coating Volume (K) Forecast, by Application 2020 & 2033
- Table 17: Mexico Plastic Free Barrier Coating Revenue (million) Forecast, by Application 2020 & 2033
- Table 18: Mexico Plastic Free Barrier Coating Volume (K) Forecast, by Application 2020 & 2033
- Table 19: Global Plastic Free Barrier Coating Revenue million Forecast, by Application 2020 & 2033
- Table 20: Global Plastic Free Barrier Coating Volume K Forecast, by Application 2020 & 2033
- Table 21: Global Plastic Free Barrier Coating Revenue million Forecast, by Type 2020 & 2033
- Table 22: Global Plastic Free Barrier Coating Volume K Forecast, by Type 2020 & 2033
- Table 23: Global Plastic Free Barrier Coating Revenue million Forecast, by Country 2020 & 2033
- Table 24: Global Plastic Free Barrier Coating Volume K Forecast, by Country 2020 & 2033
- Table 25: Brazil Plastic Free Barrier Coating Revenue (million) Forecast, by Application 2020 & 2033
- Table 26: Brazil Plastic Free Barrier Coating Volume (K) Forecast, by Application 2020 & 2033
- Table 27: Argentina Plastic Free Barrier Coating Revenue (million) Forecast, by Application 2020 & 2033
- Table 28: Argentina Plastic Free Barrier Coating Volume (K) Forecast, by Application 2020 & 2033
- Table 29: Rest of South America Plastic Free Barrier Coating Revenue (million) Forecast, by Application 2020 & 2033
- Table 30: Rest of South America Plastic Free Barrier Coating Volume (K) Forecast, by Application 2020 & 2033
- Table 31: Global Plastic Free Barrier Coating Revenue million Forecast, by Application 2020 & 2033
- Table 32: Global Plastic Free Barrier Coating Volume K Forecast, by Application 2020 & 2033
- Table 33: Global Plastic Free Barrier Coating Revenue million Forecast, by Type 2020 & 2033
- Table 34: Global Plastic Free Barrier Coating Volume K Forecast, by Type 2020 & 2033
- Table 35: Global Plastic Free Barrier Coating Revenue million Forecast, by Country 2020 & 2033
- Table 36: Global Plastic Free Barrier Coating Volume K Forecast, by Country 2020 & 2033
- Table 37: United Kingdom Plastic Free Barrier Coating Revenue (million) Forecast, by Application 2020 & 2033
- Table 38: United Kingdom Plastic Free Barrier Coating Volume (K) Forecast, by Application 2020 & 2033
- Table 39: Germany Plastic Free Barrier Coating Revenue (million) Forecast, by Application 2020 & 2033
- Table 40: Germany Plastic Free Barrier Coating Volume (K) Forecast, by Application 2020 & 2033
- Table 41: France Plastic Free Barrier Coating Revenue (million) Forecast, by Application 2020 & 2033
- Table 42: France Plastic Free Barrier Coating Volume (K) Forecast, by Application 2020 & 2033
- Table 43: Italy Plastic Free Barrier Coating Revenue (million) Forecast, by Application 2020 & 2033
- Table 44: Italy Plastic Free Barrier Coating Volume (K) Forecast, by Application 2020 & 2033
- Table 45: Spain Plastic Free Barrier Coating Revenue (million) Forecast, by Application 2020 & 2033
- Table 46: Spain Plastic Free Barrier Coating Volume (K) Forecast, by Application 2020 & 2033
- Table 47: Russia Plastic Free Barrier Coating Revenue (million) Forecast, by Application 2020 & 2033
- Table 48: Russia Plastic Free Barrier Coating Volume (K) Forecast, by Application 2020 & 2033
- Table 49: Benelux Plastic Free Barrier Coating Revenue (million) Forecast, by Application 2020 & 2033
- Table 50: Benelux Plastic Free Barrier Coating Volume (K) Forecast, by Application 2020 & 2033
- Table 51: Nordics Plastic Free Barrier Coating Revenue (million) Forecast, by Application 2020 & 2033
- Table 52: Nordics Plastic Free Barrier Coating Volume (K) Forecast, by Application 2020 & 2033
- Table 53: Rest of Europe Plastic Free Barrier Coating Revenue (million) Forecast, by Application 2020 & 2033
- Table 54: Rest of Europe Plastic Free Barrier Coating Volume (K) Forecast, by Application 2020 & 2033
- Table 55: Global Plastic Free Barrier Coating Revenue million Forecast, by Application 2020 & 2033
- Table 56: Global Plastic Free Barrier Coating Volume K Forecast, by Application 2020 & 2033
- Table 57: Global Plastic Free Barrier Coating Revenue million Forecast, by Type 2020 & 2033
- Table 58: Global Plastic Free Barrier Coating Volume K Forecast, by Type 2020 & 2033
- Table 59: Global Plastic Free Barrier Coating Revenue million Forecast, by Country 2020 & 2033
- Table 60: Global Plastic Free Barrier Coating Volume K Forecast, by Country 2020 & 2033
- Table 61: Turkey Plastic Free Barrier Coating Revenue (million) Forecast, by Application 2020 & 2033
- Table 62: Turkey Plastic Free Barrier Coating Volume (K) Forecast, by Application 2020 & 2033
- Table 63: Israel Plastic Free Barrier Coating Revenue (million) Forecast, by Application 2020 & 2033
- Table 64: Israel Plastic Free Barrier Coating Volume (K) Forecast, by Application 2020 & 2033
- Table 65: GCC Plastic Free Barrier Coating Revenue (million) Forecast, by Application 2020 & 2033
- Table 66: GCC Plastic Free Barrier Coating Volume (K) Forecast, by Application 2020 & 2033
- Table 67: North Africa Plastic Free Barrier Coating Revenue (million) Forecast, by Application 2020 & 2033
- Table 68: North Africa Plastic Free Barrier Coating Volume (K) Forecast, by Application 2020 & 2033
- Table 69: South Africa Plastic Free Barrier Coating Revenue (million) Forecast, by Application 2020 & 2033
- Table 70: South Africa Plastic Free Barrier Coating Volume (K) Forecast, by Application 2020 & 2033
- Table 71: Rest of Middle East & Africa Plastic Free Barrier Coating Revenue (million) Forecast, by Application 2020 & 2033
- Table 72: Rest of Middle East & Africa Plastic Free Barrier Coating Volume (K) Forecast, by Application 2020 & 2033
- Table 73: Global Plastic Free Barrier Coating Revenue million Forecast, by Application 2020 & 2033
- Table 74: Global Plastic Free Barrier Coating Volume K Forecast, by Application 2020 & 2033
- Table 75: Global Plastic Free Barrier Coating Revenue million Forecast, by Type 2020 & 2033
- Table 76: Global Plastic Free Barrier Coating Volume K Forecast, by Type 2020 & 2033
- Table 77: Global Plastic Free Barrier Coating Revenue million Forecast, by Country 2020 & 2033
- Table 78: Global Plastic Free Barrier Coating Volume K Forecast, by Country 2020 & 2033
- Table 79: China Plastic Free Barrier Coating Revenue (million) Forecast, by Application 2020 & 2033
- Table 80: China Plastic Free Barrier Coating Volume (K) Forecast, by Application 2020 & 2033
- Table 81: India Plastic Free Barrier Coating Revenue (million) Forecast, by Application 2020 & 2033
- Table 82: India Plastic Free Barrier Coating Volume (K) Forecast, by Application 2020 & 2033
- Table 83: Japan Plastic Free Barrier Coating Revenue (million) Forecast, by Application 2020 & 2033
- Table 84: Japan Plastic Free Barrier Coating Volume (K) Forecast, by Application 2020 & 2033
- Table 85: South Korea Plastic Free Barrier Coating Revenue (million) Forecast, by Application 2020 & 2033
- Table 86: South Korea Plastic Free Barrier Coating Volume (K) Forecast, by Application 2020 & 2033
- Table 87: ASEAN Plastic Free Barrier Coating Revenue (million) Forecast, by Application 2020 & 2033
- Table 88: ASEAN Plastic Free Barrier Coating Volume (K) Forecast, by Application 2020 & 2033
- Table 89: Oceania Plastic Free Barrier Coating Revenue (million) Forecast, by Application 2020 & 2033
- Table 90: Oceania Plastic Free Barrier Coating Volume (K) Forecast, by Application 2020 & 2033
- Table 91: Rest of Asia Pacific Plastic Free Barrier Coating Revenue (million) Forecast, by Application 2020 & 2033
- Table 92: Rest of Asia Pacific Plastic Free Barrier Coating Volume (K) Forecast, by Application 2020 & 2033
Frequently Asked Questions
1. What is the projected Compound Annual Growth Rate (CAGR) of the Plastic Free Barrier Coating?
The projected CAGR is approximately 4.6%.
2. Which companies are prominent players in the Plastic Free Barrier Coating?
Key companies in the market include Solenis, Xampla, Papkot, Melodea, USP, APC Group, Covestro, Greendot Biopak, Ingredion, Kemira, Lubrizol, Nordic Barrier Coating, OrganoClick.
3. What are the main segments of the Plastic Free Barrier Coating?
The market segments include Application, Type.
4. Can you provide details about the market size?
The market size is estimated to be USD 1903 million as of 2022.
5. What are some drivers contributing to market growth?
N/A
6. What are the notable trends driving market growth?
N/A
7. Are there any restraints impacting market growth?
N/A
8. Can you provide examples of recent developments in the market?
N/A
9. What pricing options are available for accessing the report?
Pricing options include single-user, multi-user, and enterprise licenses priced at USD 3950.00, USD 5925.00, and USD 7900.00 respectively.
10. Is the market size provided in terms of value or volume?
The market size is provided in terms of value, measured in million and volume, measured in K.
11. Are there any specific market keywords associated with the report?
Yes, the market keyword associated with the report is "Plastic Free Barrier Coating," which aids in identifying and referencing the specific market segment covered.
12. How do I determine which pricing option suits my needs best?
The pricing options vary based on user requirements and access needs. Individual users may opt for single-user licenses, while businesses requiring broader access may choose multi-user or enterprise licenses for cost-effective access to the report.
13. Are there any additional resources or data provided in the Plastic Free Barrier Coating report?
While the report offers comprehensive insights, it's advisable to review the specific contents or supplementary materials provided to ascertain if additional resources or data are available.
14. How can I stay updated on further developments or reports in the Plastic Free Barrier Coating?
To stay informed about further developments, trends, and reports in the Plastic Free Barrier Coating, consider subscribing to industry newsletters, following relevant companies and organizations, or regularly checking reputable industry news sources and publications.
Methodology
Step 1 - Identification of Relevant Samples Size from Population Database


Step 2 - Approaches for Defining Global Market Size (Value, Volume* & Price*)

Note*: In applicable scenarios
Step 3 - Data Sources
Primary Research
- Web Analytics
- Survey Reports
- Research Institute
- Latest Research Reports
- Opinion Leaders
Secondary Research
- Annual Reports
- White Paper
- Latest Press Release
- Industry Association
- Paid Database
- Investor Presentations

Step 4 - Data Triangulation
Involves using different sources of information in order to increase the validity of a study
These sources are likely to be stakeholders in a program - participants, other researchers, program staff, other community members, and so on.
Then we put all data in single framework & apply various statistical tools to find out the dynamic on the market.
During the analysis stage, feedback from the stakeholder groups would be compared to determine areas of agreement as well as areas of divergence