

Key Insights
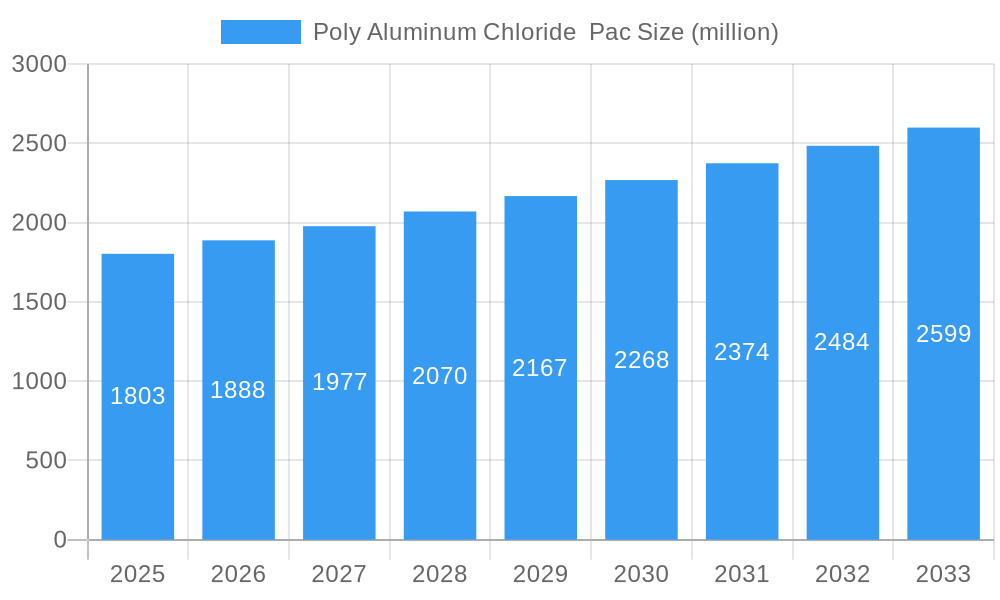
The global Poly Aluminum Chloride (PAC) market, valued at $1803 million in 2025, is projected to experience robust growth, driven by increasing demand from water treatment applications, particularly in municipal and industrial sectors. The rising global population and expanding industrialization are key factors fueling this demand, necessitating efficient and cost-effective water purification solutions. PAC's effectiveness in removing turbidity, color, and other impurities from water makes it a preferred coagulant, contributing to its market growth. Furthermore, stringent environmental regulations regarding water quality are compelling industries to adopt advanced water treatment technologies, further bolstering PAC adoption. The market's growth is also influenced by ongoing research and development efforts focused on enhancing PAC's performance and reducing its environmental impact. Specific advancements may focus on optimizing its production processes for improved efficiency and reducing production costs.
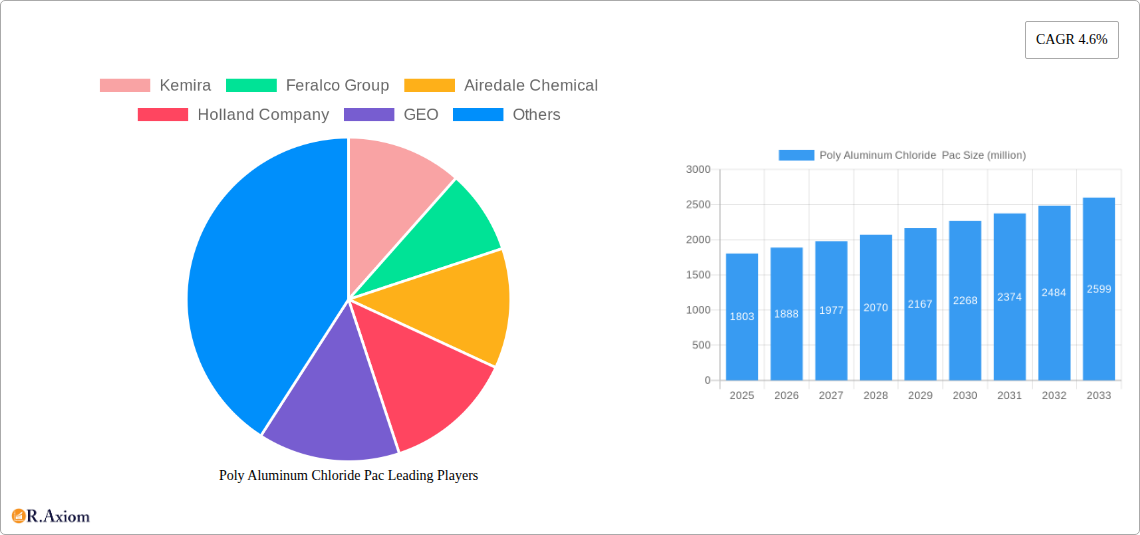
Poly Aluminum Chloride Pac Market Size (In Billion)
However, the market faces certain constraints. Fluctuations in raw material prices, particularly aluminum and chlorine, can impact PAC production costs and profitability. The competitive landscape, with several established players and emerging regional manufacturers, also influences market dynamics. Competition is likely centered around price competitiveness, product quality, and customer service. Despite these challenges, the long-term outlook for the PAC market remains positive, with the consistent need for effective water treatment solutions expected to drive market expansion throughout the forecast period (2025-2033). Geographical growth will likely be influenced by factors such as economic development, infrastructure investment, and the implementation of stricter environmental policies in different regions.
Poly Aluminum Chloride Pac Company Market Share
Poly Aluminum Chloride (PAC) Market Report: A Comprehensive Analysis (2019-2033)
This in-depth report provides a comprehensive analysis of the global Poly Aluminum Chloride (PAC) market, offering valuable insights for industry stakeholders, investors, and businesses involved in the manufacturing, distribution, and application of this crucial water treatment chemical. The report covers the period from 2019 to 2033, with 2025 serving as the base and estimated year. The study meticulously examines market dynamics, growth drivers, challenges, and emerging opportunities across various segments and geographical regions. With a focus on key players like Kemira, Feralco Group, Airedale Chemical, and others, this report is an indispensable resource for understanding and navigating the complexities of the PAC market. The total market value is estimated to reach xx million by 2033.
Poly Aluminum Chloride Pac Market Concentration & Innovation
The global Poly Aluminum Chloride (PAC) market exhibits a moderately concentrated structure, with a handful of major players holding significant market share. Kemira, Feralco Group, and Airedale Chemical are among the leading companies, collectively controlling an estimated xx% of the market in 2025. Market share fluctuations are influenced by factors such as technological advancements, M&A activities, and regulatory changes.
- Market Concentration: The Herfindahl-Hirschman Index (HHI) is estimated at xx in 2025, indicating a moderately concentrated market.
- Innovation Drivers: Demand for higher-efficiency PAC products, stringent environmental regulations, and the need for sustainable water treatment solutions are driving innovation in PAC technology.
- Regulatory Frameworks: Stringent environmental regulations regarding water quality are influencing the development and adoption of advanced PAC formulations.
- Product Substitutes: While PAC enjoys a dominant position, alternative coagulants like ferric chloride and alum pose competitive pressure.
- End-User Trends: The growing demand for clean water in various industries, including municipal water treatment, industrial wastewater treatment, and mining, fuels market expansion.
- M&A Activities: The past five years have witnessed xx M&A deals in the PAC market, with a total deal value of approximately xx million. These mergers and acquisitions have primarily focused on enhancing production capabilities, expanding geographical reach, and accessing new technologies.
Poly Aluminum Chloride Pac Industry Trends & Insights
The global Poly Aluminum Chloride (PAC) market is experiencing robust growth, driven by several key factors. The increasing global population, rapid industrialization, and stringent water quality regulations are significantly boosting the demand for effective water treatment solutions. Technological advancements, leading to improved PAC formulations with higher efficiency and reduced environmental impact, further fuel market expansion.
The compound annual growth rate (CAGR) for the PAC market is projected to be xx% during the forecast period (2025-2033). Market penetration in developing economies remains relatively low, presenting significant opportunities for expansion. Competitive dynamics are characterized by intense rivalry among established players and the emergence of new entrants. Consumer preference is shifting towards more sustainable and environmentally friendly PAC products, creating demand for innovative solutions. Technological disruptions, such as the development of advanced PAC formulations, are altering the competitive landscape.
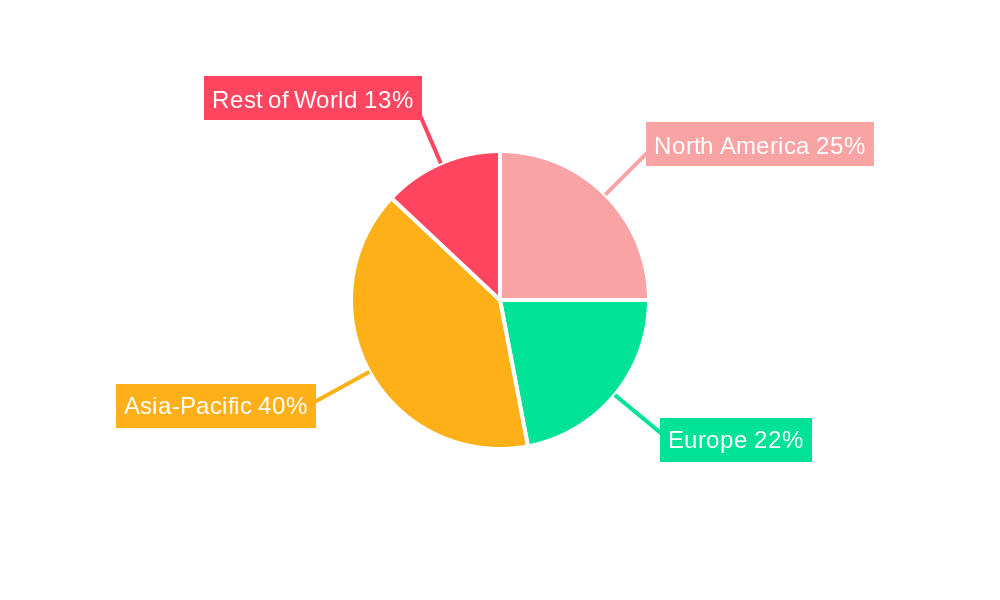
Dominant Markets & Segments in Poly Aluminum Chloride Pac
The Asia-Pacific region currently dominates the global Poly Aluminum Chloride (PAC) market, driven by rapid urbanization, industrial growth, and increasing investments in water infrastructure projects. China and India are particularly significant markets within this region.
- Key Drivers in Asia-Pacific:
- Rapid urbanization and industrialization leading to increased water treatment needs.
- Significant investments in water infrastructure projects by governments.
- Growing awareness of water pollution and its impact on public health.
- Favorable government policies and regulations promoting sustainable water management.
The dominance of the Asia-Pacific region is anticipated to continue throughout the forecast period. However, other regions, including North America and Europe, are also expected to witness considerable market growth, driven by factors such as stringent environmental regulations and rising awareness of water quality issues.
Poly Aluminum Chloride Pac Product Developments
Recent product innovations in the Poly Aluminum Chloride (PAC) market focus on enhancing coagulation efficiency, reducing sludge production, and minimizing environmental impact. Manufacturers are developing advanced PAC formulations with improved performance characteristics, tailored to meet the specific needs of different applications. These innovations address issues such as cost-effectiveness and environmental sustainability. The market is witnessing the increasing adoption of PAC with tailored molecular weights and improved flocculation properties.
Report Scope & Segmentation Analysis
This report segments the Poly Aluminum Chloride (PAC) market by type (liquid, solid), application (municipal water treatment, industrial wastewater treatment, other), and region (Asia-Pacific, North America, Europe, Middle East & Africa, South America). Each segment offers unique growth projections and competitive dynamics. For example, the liquid PAC segment is projected to hold the larger market share due to its ease of handling and application. The municipal water treatment segment accounts for the largest application, driven by increasing urbanization and rising concerns about waterborne diseases. The market size for each segment is projected to reach xx million by 2033.
Key Drivers of Poly Aluminum Chloride Pac Growth
Several factors contribute to the growth of the Poly Aluminum Chloride (PAC) market. These include:
- Stringent environmental regulations: Governments worldwide are implementing stricter regulations to improve water quality, driving the demand for effective water treatment solutions.
- Growing industrialization and urbanization: Rapid industrialization and urbanization lead to increased wastewater generation, necessitating efficient treatment technologies.
- Technological advancements: Innovations in PAC formulations, resulting in improved performance and reduced environmental impact, are boosting market growth.
- Rising disposable incomes: In developing economies, increased disposable incomes are fueling investments in improved water infrastructure and treatment facilities.
Challenges in the Poly Aluminum Chloride Pac Sector
Despite the positive growth outlook, the Poly Aluminum Chloride (PAC) market faces certain challenges:
- Fluctuations in raw material prices: Price volatility of raw materials, such as aluminum salts, can impact production costs and profitability.
- Stringent environmental regulations: Compliance with increasingly stringent environmental regulations requires significant investment in advanced treatment technologies.
- Intense competition: The market is characterized by intense competition, putting pressure on profit margins.
- Supply chain disruptions: Global events can disrupt supply chains, leading to shortages and price increases.
Emerging Opportunities in Poly Aluminum Chloride Pac
The Poly Aluminum Chloride (PAC) market presents several emerging opportunities:
- Growing demand in developing economies: The significant untapped potential in developing economies offers substantial growth opportunities.
- Development of sustainable PAC formulations: There's increasing demand for eco-friendly PAC products with reduced environmental impact.
- Expansion into new applications: Exploration of new applications for PAC in areas like oil and gas extraction and agriculture presents potential growth areas.
- Technological advancements: Development of advanced PAC formulations with enhanced performance characteristics opens new avenues for market expansion.
Leading Players in the Poly Aluminum Chloride Pac Market
- Kemira
- Feralco Group
- Airedale Chemical
- Holland Company
- GEO
- USALCO
- Taki
- Orica Watercare
- Shandong Zhongketianze
- Jingmen Yangfeng
- Yuanda
Key Developments in Poly Aluminum Chloride Pac Industry
- January 2023: Kemira launched a new, sustainable PAC formulation with improved efficiency.
- June 2022: Feralco Group announced a significant investment in expanding its PAC production capacity.
- October 2021: A strategic partnership between Airedale Chemical and a leading water treatment company was formed to expand market reach.
- (Add more entries with year/month and specific development details as needed)
Strategic Outlook for Poly Aluminum Chloride Pac Market
The Poly Aluminum Chloride (PAC) market is poised for continued growth, driven by several factors, including the increasing demand for clean water, stringent environmental regulations, and technological advancements in PAC formulations. The market's expansion into new applications and developing economies presents significant opportunities for growth. Players who prioritize sustainability, innovation, and efficient supply chains are well-positioned to capture market share and drive future growth. The continued focus on environmentally friendly solutions and cost-effective technologies will further shape the industry landscape.
Poly Aluminum Chloride Pac Segmentation
-
1. Application
- 1.1. Industrial And Municipal Water Treatment
- 1.2. Drinking Water Treatment
- 1.3. Paper Industry
- 1.4. Pharmaceutical Industry
- 1.5. Cosmetic Industry
- 1.6. Other
-
2. Type
- 2.1. Product Form
- 2.2. Basicity
Poly Aluminum Chloride Pac Segmentation By Geography
-
1. North America
- 1.1. United States
- 1.2. Canada
- 1.3. Mexico
-
2. South America
- 2.1. Brazil
- 2.2. Argentina
- 2.3. Rest of South America
-
3. Europe
- 3.1. United Kingdom
- 3.2. Germany
- 3.3. France
- 3.4. Italy
- 3.5. Spain
- 3.6. Russia
- 3.7. Benelux
- 3.8. Nordics
- 3.9. Rest of Europe
-
4. Middle East & Africa
- 4.1. Turkey
- 4.2. Israel
- 4.3. GCC
- 4.4. North Africa
- 4.5. South Africa
- 4.6. Rest of Middle East & Africa
-
5. Asia Pacific
- 5.1. China
- 5.2. India
- 5.3. Japan
- 5.4. South Korea
- 5.5. ASEAN
- 5.6. Oceania
- 5.7. Rest of Asia Pacific
Poly Aluminum Chloride Pac Regional Market Share
Geographic Coverage of Poly Aluminum Chloride Pac
Poly Aluminum Chloride Pac REPORT HIGHLIGHTS
| Aspects | Details |
|---|---|
| Study Period | 2020-2034 |
| Base Year | 2025 |
| Estimated Year | 2026 |
| Forecast Period | 2026-2034 |
| Historical Period | 2020-2025 |
| Growth Rate | CAGR of 4.6% from 2020-2034 |
| Segmentation |
|
Table of Contents
- 1. Introduction
- 1.1. Research Scope
- 1.2. Market Segmentation
- 1.3. Research Objective
- 1.4. Definitions and Assumptions
- 2. Executive Summary
- 2.1. Market Snapshot
- 3. Market Dynamics
- 3.1. Market Drivers
- 3.2. Market Restrains
- 3.3. Market Trends
- 3.4. Market Opportunities
- 4. Market Factor Analysis
- 4.1. Porters Five Forces
- 4.1.1. Bargaining Power of Suppliers
- 4.1.2. Bargaining Power of Buyers
- 4.1.3. Threat of New Entrants
- 4.1.4. Threat of Substitutes
- 4.1.5. Competitive Rivalry
- 4.2. PESTEL analysis
- 4.3. BCG Analysis
- 4.3.1. Stars (High Growth, High Market Share)
- 4.3.2. Cash Cows (Low Growth, High Market Share)
- 4.3.3. Question Mark (High Growth, Low Market Share)
- 4.3.4. Dogs (Low Growth, Low Market Share)
- 4.4. Ansoff Matrix Analysis
- 4.5. Supply Chain Analysis
- 4.6. Regulatory Landscape
- 4.7. Current Market Potential and Opportunity Assessment (TAM–SAM–SOM Framework)
- 4.8. RAX Analyst Note
- 4.1. Porters Five Forces
- 5. Market Analysis, Insights and Forecast 2021-2033
- 5.1. Market Analysis, Insights and Forecast - by Application
- 5.1.1. Industrial And Municipal Water Treatment
- 5.1.2. Drinking Water Treatment
- 5.1.3. Paper Industry
- 5.1.4. Pharmaceutical Industry
- 5.1.5. Cosmetic Industry
- 5.1.6. Other
- 5.2. Market Analysis, Insights and Forecast - by Type
- 5.2.1. Product Form
- 5.2.2. Basicity
- 5.3. Market Analysis, Insights and Forecast - by Region
- 5.3.1. North America
- 5.3.2. South America
- 5.3.3. Europe
- 5.3.4. Middle East & Africa
- 5.3.5. Asia Pacific
- 5.1. Market Analysis, Insights and Forecast - by Application
- 6. Global Poly Aluminum Chloride Pac Analysis, Insights and Forecast, 2021-2033
- 6.1. Market Analysis, Insights and Forecast - by Application
- 6.1.1. Industrial And Municipal Water Treatment
- 6.1.2. Drinking Water Treatment
- 6.1.3. Paper Industry
- 6.1.4. Pharmaceutical Industry
- 6.1.5. Cosmetic Industry
- 6.1.6. Other
- 6.2. Market Analysis, Insights and Forecast - by Type
- 6.2.1. Product Form
- 6.2.2. Basicity
- 6.1. Market Analysis, Insights and Forecast - by Application
- 7. North America Poly Aluminum Chloride Pac Analysis, Insights and Forecast, 2020-2032
- 7.1. Market Analysis, Insights and Forecast - by Application
- 7.1.1. Industrial And Municipal Water Treatment
- 7.1.2. Drinking Water Treatment
- 7.1.3. Paper Industry
- 7.1.4. Pharmaceutical Industry
- 7.1.5. Cosmetic Industry
- 7.1.6. Other
- 7.2. Market Analysis, Insights and Forecast - by Type
- 7.2.1. Product Form
- 7.2.2. Basicity
- 7.1. Market Analysis, Insights and Forecast - by Application
- 8. South America Poly Aluminum Chloride Pac Analysis, Insights and Forecast, 2020-2032
- 8.1. Market Analysis, Insights and Forecast - by Application
- 8.1.1. Industrial And Municipal Water Treatment
- 8.1.2. Drinking Water Treatment
- 8.1.3. Paper Industry
- 8.1.4. Pharmaceutical Industry
- 8.1.5. Cosmetic Industry
- 8.1.6. Other
- 8.2. Market Analysis, Insights and Forecast - by Type
- 8.2.1. Product Form
- 8.2.2. Basicity
- 8.1. Market Analysis, Insights and Forecast - by Application
- 9. Europe Poly Aluminum Chloride Pac Analysis, Insights and Forecast, 2020-2032
- 9.1. Market Analysis, Insights and Forecast - by Application
- 9.1.1. Industrial And Municipal Water Treatment
- 9.1.2. Drinking Water Treatment
- 9.1.3. Paper Industry
- 9.1.4. Pharmaceutical Industry
- 9.1.5. Cosmetic Industry
- 9.1.6. Other
- 9.2. Market Analysis, Insights and Forecast - by Type
- 9.2.1. Product Form
- 9.2.2. Basicity
- 9.1. Market Analysis, Insights and Forecast - by Application
- 10. Middle East & Africa Poly Aluminum Chloride Pac Analysis, Insights and Forecast, 2020-2032
- 10.1. Market Analysis, Insights and Forecast - by Application
- 10.1.1. Industrial And Municipal Water Treatment
- 10.1.2. Drinking Water Treatment
- 10.1.3. Paper Industry
- 10.1.4. Pharmaceutical Industry
- 10.1.5. Cosmetic Industry
- 10.1.6. Other
- 10.2. Market Analysis, Insights and Forecast - by Type
- 10.2.1. Product Form
- 10.2.2. Basicity
- 10.1. Market Analysis, Insights and Forecast - by Application
- 11. Asia Pacific Poly Aluminum Chloride Pac Analysis, Insights and Forecast, 2020-2032
- 11.1. Market Analysis, Insights and Forecast - by Application
- 11.1.1. Industrial And Municipal Water Treatment
- 11.1.2. Drinking Water Treatment
- 11.1.3. Paper Industry
- 11.1.4. Pharmaceutical Industry
- 11.1.5. Cosmetic Industry
- 11.1.6. Other
- 11.2. Market Analysis, Insights and Forecast - by Type
- 11.2.1. Product Form
- 11.2.2. Basicity
- 11.1. Market Analysis, Insights and Forecast - by Application
- 12. Competitive Analysis
- 12.1. Company Profiles
- 12.1.1 Kemira
- 12.1.1.1. Company Overview
- 12.1.1.2. Products
- 12.1.1.3. Company Financials
- 12.1.1.4. SWOT Analysis
- 12.1.2 Feralco Group
- 12.1.2.1. Company Overview
- 12.1.2.2. Products
- 12.1.2.3. Company Financials
- 12.1.2.4. SWOT Analysis
- 12.1.3 Airedale Chemical
- 12.1.3.1. Company Overview
- 12.1.3.2. Products
- 12.1.3.3. Company Financials
- 12.1.3.4. SWOT Analysis
- 12.1.4 Holland Company
- 12.1.4.1. Company Overview
- 12.1.4.2. Products
- 12.1.4.3. Company Financials
- 12.1.4.4. SWOT Analysis
- 12.1.5 GEO
- 12.1.5.1. Company Overview
- 12.1.5.2. Products
- 12.1.5.3. Company Financials
- 12.1.5.4. SWOT Analysis
- 12.1.6 USALCO
- 12.1.6.1. Company Overview
- 12.1.6.2. Products
- 12.1.6.3. Company Financials
- 12.1.6.4. SWOT Analysis
- 12.1.7 Taki
- 12.1.7.1. Company Overview
- 12.1.7.2. Products
- 12.1.7.3. Company Financials
- 12.1.7.4. SWOT Analysis
- 12.1.8 Orica Watercare
- 12.1.8.1. Company Overview
- 12.1.8.2. Products
- 12.1.8.3. Company Financials
- 12.1.8.4. SWOT Analysis
- 12.1.9 Shandong Zhongketianze
- 12.1.9.1. Company Overview
- 12.1.9.2. Products
- 12.1.9.3. Company Financials
- 12.1.9.4. SWOT Analysis
- 12.1.10 Jingmen Yangfeng
- 12.1.10.1. Company Overview
- 12.1.10.2. Products
- 12.1.10.3. Company Financials
- 12.1.10.4. SWOT Analysis
- 12.1.11 Yuanda
- 12.1.11.1. Company Overview
- 12.1.11.2. Products
- 12.1.11.3. Company Financials
- 12.1.11.4. SWOT Analysis
- 12.1.1 Kemira
- 12.2. Market Entropy
- 12.2.1 Company's Key Areas Served
- 12.2.2 Recent Developments
- 12.3. Company Market Share Analysis 2025
- 12.3.1 Top 5 Companies Market Share Analysis
- 12.3.2 Top 3 Companies Market Share Analysis
- 12.4. List of Potential Customers
- 13. Research Methodology
List of Figures
- Figure 1: Global Poly Aluminum Chloride Pac Revenue Breakdown (million, %) by Region 2025 & 2033
- Figure 2: North America Poly Aluminum Chloride Pac Revenue (million), by Application 2025 & 2033
- Figure 3: North America Poly Aluminum Chloride Pac Revenue Share (%), by Application 2025 & 2033
- Figure 4: North America Poly Aluminum Chloride Pac Revenue (million), by Type 2025 & 2033
- Figure 5: North America Poly Aluminum Chloride Pac Revenue Share (%), by Type 2025 & 2033
- Figure 6: North America Poly Aluminum Chloride Pac Revenue (million), by Country 2025 & 2033
- Figure 7: North America Poly Aluminum Chloride Pac Revenue Share (%), by Country 2025 & 2033
- Figure 8: South America Poly Aluminum Chloride Pac Revenue (million), by Application 2025 & 2033
- Figure 9: South America Poly Aluminum Chloride Pac Revenue Share (%), by Application 2025 & 2033
- Figure 10: South America Poly Aluminum Chloride Pac Revenue (million), by Type 2025 & 2033
- Figure 11: South America Poly Aluminum Chloride Pac Revenue Share (%), by Type 2025 & 2033
- Figure 12: South America Poly Aluminum Chloride Pac Revenue (million), by Country 2025 & 2033
- Figure 13: South America Poly Aluminum Chloride Pac Revenue Share (%), by Country 2025 & 2033
- Figure 14: Europe Poly Aluminum Chloride Pac Revenue (million), by Application 2025 & 2033
- Figure 15: Europe Poly Aluminum Chloride Pac Revenue Share (%), by Application 2025 & 2033
- Figure 16: Europe Poly Aluminum Chloride Pac Revenue (million), by Type 2025 & 2033
- Figure 17: Europe Poly Aluminum Chloride Pac Revenue Share (%), by Type 2025 & 2033
- Figure 18: Europe Poly Aluminum Chloride Pac Revenue (million), by Country 2025 & 2033
- Figure 19: Europe Poly Aluminum Chloride Pac Revenue Share (%), by Country 2025 & 2033
- Figure 20: Middle East & Africa Poly Aluminum Chloride Pac Revenue (million), by Application 2025 & 2033
- Figure 21: Middle East & Africa Poly Aluminum Chloride Pac Revenue Share (%), by Application 2025 & 2033
- Figure 22: Middle East & Africa Poly Aluminum Chloride Pac Revenue (million), by Type 2025 & 2033
- Figure 23: Middle East & Africa Poly Aluminum Chloride Pac Revenue Share (%), by Type 2025 & 2033
- Figure 24: Middle East & Africa Poly Aluminum Chloride Pac Revenue (million), by Country 2025 & 2033
- Figure 25: Middle East & Africa Poly Aluminum Chloride Pac Revenue Share (%), by Country 2025 & 2033
- Figure 26: Asia Pacific Poly Aluminum Chloride Pac Revenue (million), by Application 2025 & 2033
- Figure 27: Asia Pacific Poly Aluminum Chloride Pac Revenue Share (%), by Application 2025 & 2033
- Figure 28: Asia Pacific Poly Aluminum Chloride Pac Revenue (million), by Type 2025 & 2033
- Figure 29: Asia Pacific Poly Aluminum Chloride Pac Revenue Share (%), by Type 2025 & 2033
- Figure 30: Asia Pacific Poly Aluminum Chloride Pac Revenue (million), by Country 2025 & 2033
- Figure 31: Asia Pacific Poly Aluminum Chloride Pac Revenue Share (%), by Country 2025 & 2033
List of Tables
- Table 1: Global Poly Aluminum Chloride Pac Revenue million Forecast, by Application 2020 & 2033
- Table 2: Global Poly Aluminum Chloride Pac Revenue million Forecast, by Type 2020 & 2033
- Table 3: Global Poly Aluminum Chloride Pac Revenue million Forecast, by Region 2020 & 2033
- Table 4: Global Poly Aluminum Chloride Pac Revenue million Forecast, by Application 2020 & 2033
- Table 5: Global Poly Aluminum Chloride Pac Revenue million Forecast, by Type 2020 & 2033
- Table 6: Global Poly Aluminum Chloride Pac Revenue million Forecast, by Country 2020 & 2033
- Table 7: United States Poly Aluminum Chloride Pac Revenue (million) Forecast, by Application 2020 & 2033
- Table 8: Canada Poly Aluminum Chloride Pac Revenue (million) Forecast, by Application 2020 & 2033
- Table 9: Mexico Poly Aluminum Chloride Pac Revenue (million) Forecast, by Application 2020 & 2033
- Table 10: Global Poly Aluminum Chloride Pac Revenue million Forecast, by Application 2020 & 2033
- Table 11: Global Poly Aluminum Chloride Pac Revenue million Forecast, by Type 2020 & 2033
- Table 12: Global Poly Aluminum Chloride Pac Revenue million Forecast, by Country 2020 & 2033
- Table 13: Brazil Poly Aluminum Chloride Pac Revenue (million) Forecast, by Application 2020 & 2033
- Table 14: Argentina Poly Aluminum Chloride Pac Revenue (million) Forecast, by Application 2020 & 2033
- Table 15: Rest of South America Poly Aluminum Chloride Pac Revenue (million) Forecast, by Application 2020 & 2033
- Table 16: Global Poly Aluminum Chloride Pac Revenue million Forecast, by Application 2020 & 2033
- Table 17: Global Poly Aluminum Chloride Pac Revenue million Forecast, by Type 2020 & 2033
- Table 18: Global Poly Aluminum Chloride Pac Revenue million Forecast, by Country 2020 & 2033
- Table 19: United Kingdom Poly Aluminum Chloride Pac Revenue (million) Forecast, by Application 2020 & 2033
- Table 20: Germany Poly Aluminum Chloride Pac Revenue (million) Forecast, by Application 2020 & 2033
- Table 21: France Poly Aluminum Chloride Pac Revenue (million) Forecast, by Application 2020 & 2033
- Table 22: Italy Poly Aluminum Chloride Pac Revenue (million) Forecast, by Application 2020 & 2033
- Table 23: Spain Poly Aluminum Chloride Pac Revenue (million) Forecast, by Application 2020 & 2033
- Table 24: Russia Poly Aluminum Chloride Pac Revenue (million) Forecast, by Application 2020 & 2033
- Table 25: Benelux Poly Aluminum Chloride Pac Revenue (million) Forecast, by Application 2020 & 2033
- Table 26: Nordics Poly Aluminum Chloride Pac Revenue (million) Forecast, by Application 2020 & 2033
- Table 27: Rest of Europe Poly Aluminum Chloride Pac Revenue (million) Forecast, by Application 2020 & 2033
- Table 28: Global Poly Aluminum Chloride Pac Revenue million Forecast, by Application 2020 & 2033
- Table 29: Global Poly Aluminum Chloride Pac Revenue million Forecast, by Type 2020 & 2033
- Table 30: Global Poly Aluminum Chloride Pac Revenue million Forecast, by Country 2020 & 2033
- Table 31: Turkey Poly Aluminum Chloride Pac Revenue (million) Forecast, by Application 2020 & 2033
- Table 32: Israel Poly Aluminum Chloride Pac Revenue (million) Forecast, by Application 2020 & 2033
- Table 33: GCC Poly Aluminum Chloride Pac Revenue (million) Forecast, by Application 2020 & 2033
- Table 34: North Africa Poly Aluminum Chloride Pac Revenue (million) Forecast, by Application 2020 & 2033
- Table 35: South Africa Poly Aluminum Chloride Pac Revenue (million) Forecast, by Application 2020 & 2033
- Table 36: Rest of Middle East & Africa Poly Aluminum Chloride Pac Revenue (million) Forecast, by Application 2020 & 2033
- Table 37: Global Poly Aluminum Chloride Pac Revenue million Forecast, by Application 2020 & 2033
- Table 38: Global Poly Aluminum Chloride Pac Revenue million Forecast, by Type 2020 & 2033
- Table 39: Global Poly Aluminum Chloride Pac Revenue million Forecast, by Country 2020 & 2033
- Table 40: China Poly Aluminum Chloride Pac Revenue (million) Forecast, by Application 2020 & 2033
- Table 41: India Poly Aluminum Chloride Pac Revenue (million) Forecast, by Application 2020 & 2033
- Table 42: Japan Poly Aluminum Chloride Pac Revenue (million) Forecast, by Application 2020 & 2033
- Table 43: South Korea Poly Aluminum Chloride Pac Revenue (million) Forecast, by Application 2020 & 2033
- Table 44: ASEAN Poly Aluminum Chloride Pac Revenue (million) Forecast, by Application 2020 & 2033
- Table 45: Oceania Poly Aluminum Chloride Pac Revenue (million) Forecast, by Application 2020 & 2033
- Table 46: Rest of Asia Pacific Poly Aluminum Chloride Pac Revenue (million) Forecast, by Application 2020 & 2033
Frequently Asked Questions
1. What is the projected Compound Annual Growth Rate (CAGR) of the Poly Aluminum Chloride Pac?
The projected CAGR is approximately 4.6%.
2. Which companies are prominent players in the Poly Aluminum Chloride Pac?
Key companies in the market include Kemira, Feralco Group, Airedale Chemical, Holland Company, GEO, USALCO, Taki, Orica Watercare, Shandong Zhongketianze, Jingmen Yangfeng, Yuanda.
3. What are the main segments of the Poly Aluminum Chloride Pac?
The market segments include Application, Type.
4. Can you provide details about the market size?
The market size is estimated to be USD 1803 million as of 2022.
5. What are some drivers contributing to market growth?
N/A
6. What are the notable trends driving market growth?
N/A
7. Are there any restraints impacting market growth?
N/A
8. Can you provide examples of recent developments in the market?
N/A
9. What pricing options are available for accessing the report?
Pricing options include single-user, multi-user, and enterprise licenses priced at USD 5900.00, USD 8850.00, and USD 11800.00 respectively.
10. Is the market size provided in terms of value or volume?
The market size is provided in terms of value, measured in million.
11. Are there any specific market keywords associated with the report?
Yes, the market keyword associated with the report is "Poly Aluminum Chloride Pac," which aids in identifying and referencing the specific market segment covered.
12. How do I determine which pricing option suits my needs best?
The pricing options vary based on user requirements and access needs. Individual users may opt for single-user licenses, while businesses requiring broader access may choose multi-user or enterprise licenses for cost-effective access to the report.
13. Are there any additional resources or data provided in the Poly Aluminum Chloride Pac report?
While the report offers comprehensive insights, it's advisable to review the specific contents or supplementary materials provided to ascertain if additional resources or data are available.
14. How can I stay updated on further developments or reports in the Poly Aluminum Chloride Pac?
To stay informed about further developments, trends, and reports in the Poly Aluminum Chloride Pac, consider subscribing to industry newsletters, following relevant companies and organizations, or regularly checking reputable industry news sources and publications.
Methodology
Step 1 - Identification of Relevant Samples Size from Population Database


Step 2 - Approaches for Defining Global Market Size (Value, Volume* & Price*)

Note*: In applicable scenarios
Step 3 - Data Sources
Primary Research
- Web Analytics
- Survey Reports
- Research Institute
- Latest Research Reports
- Opinion Leaders
Secondary Research
- Annual Reports
- White Paper
- Latest Press Release
- Industry Association
- Paid Database
- Investor Presentations

Step 4 - Data Triangulation
Involves using different sources of information in order to increase the validity of a study
These sources are likely to be stakeholders in a program - participants, other researchers, program staff, other community members, and so on.
Then we put all data in single framework & apply various statistical tools to find out the dynamic on the market.
During the analysis stage, feedback from the stakeholder groups would be compared to determine areas of agreement as well as areas of divergence