

Key Insights
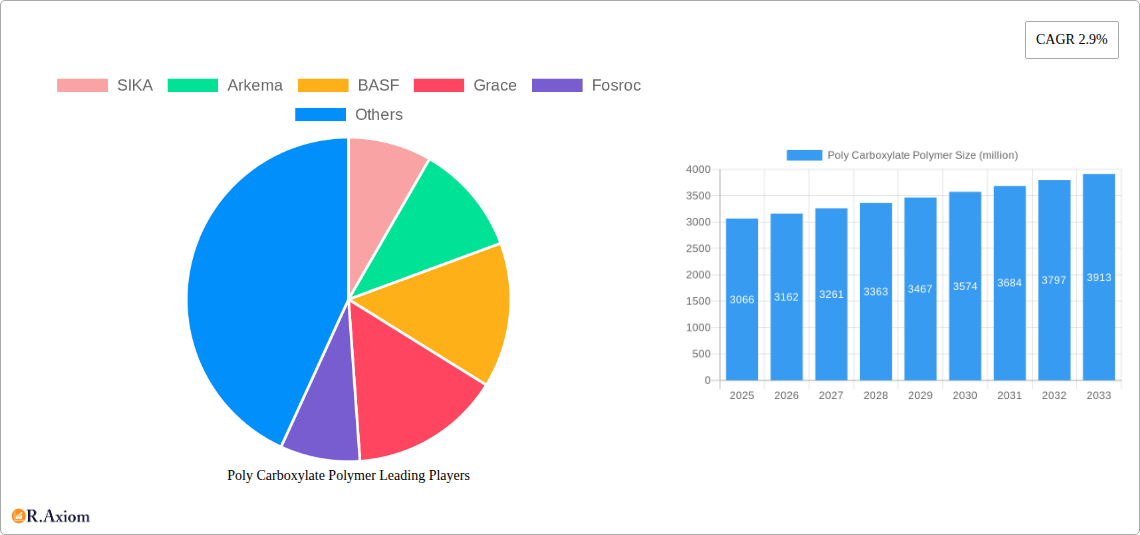
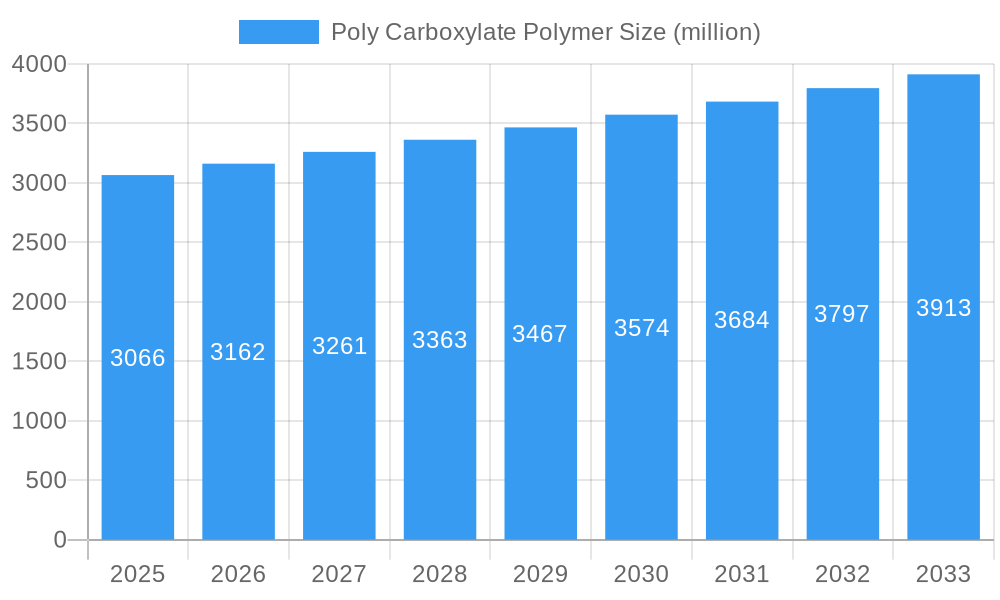
The global polycarboxylate polymer market, valued at approximately $3.066 billion in 2025, is projected to experience steady growth, driven by the increasing demand for high-performance concrete in construction and infrastructure projects. The compound annual growth rate (CAGR) of 2.9% from 2025 to 2033 reflects a consistent, albeit moderate, expansion. This growth is fueled by several key factors. Firstly, the rising construction activity globally, particularly in developing economies, significantly boosts the demand for concrete admixtures like polycarboxylate polymers. These polymers enhance concrete properties, including workability, strength, and durability, making them essential for large-scale projects like high-rise buildings, bridges, and transportation infrastructure. Secondly, stringent environmental regulations promoting sustainable construction practices are driving the adoption of polycarboxylate polymers, as they reduce the environmental footprint of concrete production by lowering cement consumption and improving water reduction efficiency. The market also benefits from ongoing technological advancements resulting in the development of more efficient and cost-effective polycarboxylate polymers with enhanced performance characteristics.
Poly Carboxylate Polymer Market Size (In Billion)
However, market growth may face certain challenges. Fluctuations in raw material prices, particularly for monomers used in polycarboxylate polymer synthesis, can impact profitability. Furthermore, the market is characterized by intense competition among established players and emerging manufacturers, potentially leading to price pressures. Despite these challenges, the long-term outlook for the polycarboxylate polymer market remains positive, driven by the continuous growth of the construction industry and the increasing preference for high-performance concrete. Further market segmentation analysis, focusing on specific applications (e.g., ready-mix concrete, self-compacting concrete) and geographical regions, could offer a more granular understanding of growth prospects and market dynamics. This detailed analysis would allow for more precise targeting of marketing and business strategies for stakeholders in the polycarboxylate polymer market.
Poly Carboxylate Polymer Company Market Share
Poly Carboxylate Polymer Market Report: 2019-2033
This comprehensive report provides an in-depth analysis of the global poly carboxylate polymer market, offering crucial insights for industry stakeholders, investors, and researchers. The report covers the period from 2019 to 2033, with 2025 as the base year and estimated year. The forecast period is 2025-2033, and the historical period is 2019-2024. The market size is projected to reach xx million USD by 2033, showcasing substantial growth potential.
Poly Carboxylate Polymer Market Concentration & Innovation
This section analyzes the competitive landscape of the poly carboxylate polymer market, examining market concentration, innovation drivers, regulatory frameworks, product substitutes, end-user trends, and mergers & acquisitions (M&A) activities. The market is characterized by a moderately concentrated structure, with key players such as SIKA, Arkema, BASF, and Grace holding significant market shares. However, the presence of numerous regional and smaller players fosters competition and innovation.
Market Share: SIKA holds an estimated xx% market share in 2025, followed by Arkema at xx%, BASF at xx%, and Grace at xx%. The remaining market share is distributed among numerous other players, including Fosroc, KAO, Mapei, and others.
M&A Activity: The last five years have witnessed several M&A deals, totaling approximately xx million USD in value, predominantly driven by expansion into new geographic regions and diversification of product portfolios. These acquisitions have led to increased market consolidation and enhanced technological capabilities for major players.
Innovation Drivers: Growing demand for high-performance concrete, stringent environmental regulations favoring sustainable construction materials, and the need for enhanced concrete properties are major drivers of innovation in poly carboxylate polymer technology.
Regulatory Frameworks: Government regulations concerning environmental protection and construction standards significantly impact the market. Compliance with these regulations is a key factor driving innovation in environmentally friendly and high-performance poly carboxylate polymers.
Product Substitutes: While poly carboxylate polymers dominate the market, alternative superplasticizers such as lignosulfonates and naphthalene sulfonate formaldehyde condensates exist. However, their market share is relatively small due to the superior performance characteristics of poly carboxylate polymers.
End-User Trends: The construction industry's increasing focus on sustainable practices, infrastructure development projects, and the demand for high-strength, durable concrete are driving significant market growth.
Poly Carboxylate Polymer Industry Trends & Insights
The global poly carboxylate polymer market is experiencing robust growth, driven by various factors. The compound annual growth rate (CAGR) during the forecast period (2025-2033) is projected to be xx%. This growth is primarily attributed to the increasing demand for high-performance concrete in infrastructure projects, residential construction, and industrial applications. Market penetration in developing economies is also contributing significantly to the overall growth. Technological advancements, such as the development of more efficient and sustainable poly carboxylate polymers, are further boosting market expansion. Competitive dynamics are marked by continuous innovation, product differentiation, and strategic partnerships among major players. Consumer preferences are increasingly shifting towards environmentally friendly and high-performance construction materials, which favors poly carboxylate polymers.
Dominant Markets & Segments in Poly Carboxylate Polymer
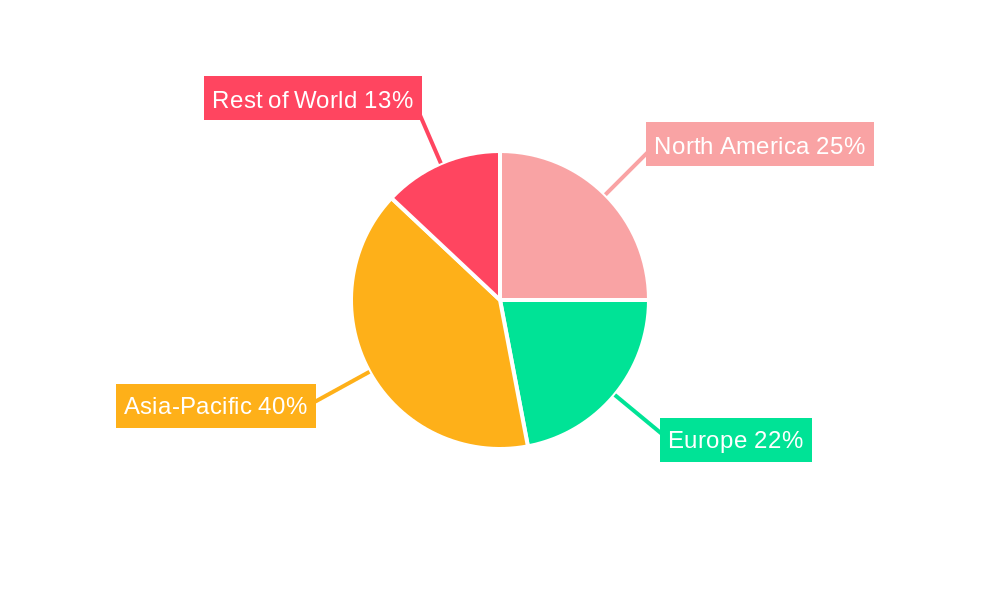
The Asia-Pacific region dominates the global poly carboxylate polymer market, accounting for approximately xx% of the total market share in 2025. This dominance is mainly attributed to rapid infrastructure development, urbanization, and robust construction activities in countries like China and India.
- Key Drivers in Asia-Pacific:
- Significant government investment in infrastructure projects.
- Rapid urbanization and increasing construction activities.
- Favorable economic policies supporting the construction sector.
Within the Asia-Pacific region, China is the leading national market, followed by India and other Southeast Asian nations. The high construction activity in these regions coupled with increasing demand for high-performance concrete is expected to propel growth in the coming years. Europe and North America also represent significant markets, driven by renovation and expansion projects and a focus on sustainable construction practices.
Poly Carboxylate Polymer Product Developments
Recent innovations focus on developing environmentally friendly, high-performance poly carboxylate polymers with enhanced properties such as improved workability, reduced water content, and increased durability. These developments cater to the increasing demand for sustainable and high-quality concrete in various applications. This trend is reflected in the introduction of new formulations with tailored properties to meet specific requirements, contributing to a competitive market landscape.
Report Scope & Segmentation Analysis
The report segments the poly carboxylate polymer market based on various factors including type (high range water reducer, medium range water reducer, etc.), application (ready-mix concrete, precast concrete, etc.), and region. Each segment exhibits unique growth dynamics and competitive landscapes. Growth projections vary across segments, with high-range water reducers expected to dominate due to their superior performance characteristics. Market size estimates are provided for each segment, along with detailed analyses of competitive dynamics and market shares.
Key Drivers of Poly Carboxylate Polymer Growth
The growth of the poly carboxylate polymer market is propelled by several key factors: the burgeoning global construction industry, increasing demand for high-performance concrete, stringent environmental regulations, and technological advancements leading to improved product efficiency and sustainability. Government initiatives supporting infrastructure development in emerging economies further stimulate market growth.
Challenges in the Poly Carboxylate Polymer Sector
The poly carboxylate polymer market faces several challenges, including fluctuating raw material prices, intense competition, and the potential for substitute products. Regulatory compliance and ensuring consistent product quality across diverse geographical regions also pose significant challenges. Supply chain disruptions can impact production and availability, affecting market stability.
Emerging Opportunities in Poly Carboxylate Polymer
Emerging opportunities lie in the development of advanced, sustainable poly carboxylate polymers with enhanced performance characteristics. Expanding into new geographic markets, particularly in developing economies, presents substantial growth potential. Moreover, strategic partnerships and collaborations can provide access to new technologies and markets. Focusing on customized solutions for specialized applications, such as self-compacting concrete, will also open new avenues for market expansion.
Leading Players in the Poly Carboxylate Polymer Market
- SIKA
- Arkema
- BASF
- Grace
- Fosroc
- KAO
- Mapei
- Euclid Chemical
- Takemoto
- Nippon Shokubai
- Lonsen
- YuHong
- Feilong Concrete Admixture
- SOBUTE
- Changan Yucai
- JILONG CONSTRUCTION CHEMICALS
- Kelong Chemical
- Kezhijie
- Huangteng Chemical
- Sansheng Special Building Material
- Huawei Jiancai Building Material
- Shanxi Huawei Keji
- ARIT
Key Developments in Poly Carboxylate Polymer Industry
- January 2023: SIKA launched a new generation of high-performance poly carboxylate polymer.
- March 2022: Arkema and BASF announced a joint venture to develop sustainable poly carboxylate polymers.
- June 2021: Grace acquired a smaller competitor, expanding its market presence. (Further details on acquisitions and launches would be added here in the full report)
Strategic Outlook for Poly Carboxylate Polymer Market
The poly carboxylate polymer market is poised for continued growth, driven by robust demand from the construction industry and technological advancements. Focusing on sustainability, innovation, and strategic partnerships will be crucial for success. Expansion into new markets and diversification of product portfolios will offer significant opportunities for growth in the coming years. The market is expected to witness further consolidation through M&A activities, with leading players aiming to enhance their market share and product offerings.
Poly Carboxylate Polymer Segmentation
-
1. Application
- 1.1. Water Reducing Agent
- 1.2. Admixture
- 1.3. Impermeable Waterproofing Agent
-
2. Type
- 2.1. Powder Poly Carboxylate Polymer
- 2.2. Liquid Poly Carboxylate Polymer
Poly Carboxylate Polymer Segmentation By Geography
-
1. North America
- 1.1. United States
- 1.2. Canada
- 1.3. Mexico
-
2. South America
- 2.1. Brazil
- 2.2. Argentina
- 2.3. Rest of South America
-
3. Europe
- 3.1. United Kingdom
- 3.2. Germany
- 3.3. France
- 3.4. Italy
- 3.5. Spain
- 3.6. Russia
- 3.7. Benelux
- 3.8. Nordics
- 3.9. Rest of Europe
-
4. Middle East & Africa
- 4.1. Turkey
- 4.2. Israel
- 4.3. GCC
- 4.4. North Africa
- 4.5. South Africa
- 4.6. Rest of Middle East & Africa
-
5. Asia Pacific
- 5.1. China
- 5.2. India
- 5.3. Japan
- 5.4. South Korea
- 5.5. ASEAN
- 5.6. Oceania
- 5.7. Rest of Asia Pacific
Poly Carboxylate Polymer Regional Market Share
Geographic Coverage of Poly Carboxylate Polymer
Poly Carboxylate Polymer REPORT HIGHLIGHTS
| Aspects | Details |
|---|---|
| Study Period | 2020-2034 |
| Base Year | 2025 |
| Estimated Year | 2026 |
| Forecast Period | 2026-2034 |
| Historical Period | 2020-2025 |
| Growth Rate | CAGR of 6.3% from 2020-2034 |
| Segmentation |
|
Table of Contents
- 1. Introduction
- 1.1. Research Scope
- 1.2. Market Segmentation
- 1.3. Research Objective
- 1.4. Definitions and Assumptions
- 2. Executive Summary
- 2.1. Market Snapshot
- 3. Market Dynamics
- 3.1. Market Drivers
- 3.2. Market Restrains
- 3.3. Market Trends
- 3.4. Market Opportunities
- 4. Market Factor Analysis
- 4.1. Porters Five Forces
- 4.1.1. Bargaining Power of Suppliers
- 4.1.2. Bargaining Power of Buyers
- 4.1.3. Threat of New Entrants
- 4.1.4. Threat of Substitutes
- 4.1.5. Competitive Rivalry
- 4.2. PESTEL analysis
- 4.3. BCG Analysis
- 4.3.1. Stars (High Growth, High Market Share)
- 4.3.2. Cash Cows (Low Growth, High Market Share)
- 4.3.3. Question Mark (High Growth, Low Market Share)
- 4.3.4. Dogs (Low Growth, Low Market Share)
- 4.4. Ansoff Matrix Analysis
- 4.5. Supply Chain Analysis
- 4.6. Regulatory Landscape
- 4.7. Current Market Potential and Opportunity Assessment (TAM–SAM–SOM Framework)
- 4.8. RAX Analyst Note
- 4.1. Porters Five Forces
- 5. Market Analysis, Insights and Forecast 2021-2033
- 5.1. Market Analysis, Insights and Forecast - by Application
- 5.1.1. Water Reducing Agent
- 5.1.2. Admixture
- 5.1.3. Impermeable Waterproofing Agent
- 5.2. Market Analysis, Insights and Forecast - by Type
- 5.2.1. Powder Poly Carboxylate Polymer
- 5.2.2. Liquid Poly Carboxylate Polymer
- 5.3. Market Analysis, Insights and Forecast - by Region
- 5.3.1. North America
- 5.3.2. South America
- 5.3.3. Europe
- 5.3.4. Middle East & Africa
- 5.3.5. Asia Pacific
- 5.1. Market Analysis, Insights and Forecast - by Application
- 6. Global Poly Carboxylate Polymer Analysis, Insights and Forecast, 2021-2033
- 6.1. Market Analysis, Insights and Forecast - by Application
- 6.1.1. Water Reducing Agent
- 6.1.2. Admixture
- 6.1.3. Impermeable Waterproofing Agent
- 6.2. Market Analysis, Insights and Forecast - by Type
- 6.2.1. Powder Poly Carboxylate Polymer
- 6.2.2. Liquid Poly Carboxylate Polymer
- 6.1. Market Analysis, Insights and Forecast - by Application
- 7. North America Poly Carboxylate Polymer Analysis, Insights and Forecast, 2020-2032
- 7.1. Market Analysis, Insights and Forecast - by Application
- 7.1.1. Water Reducing Agent
- 7.1.2. Admixture
- 7.1.3. Impermeable Waterproofing Agent
- 7.2. Market Analysis, Insights and Forecast - by Type
- 7.2.1. Powder Poly Carboxylate Polymer
- 7.2.2. Liquid Poly Carboxylate Polymer
- 7.1. Market Analysis, Insights and Forecast - by Application
- 8. South America Poly Carboxylate Polymer Analysis, Insights and Forecast, 2020-2032
- 8.1. Market Analysis, Insights and Forecast - by Application
- 8.1.1. Water Reducing Agent
- 8.1.2. Admixture
- 8.1.3. Impermeable Waterproofing Agent
- 8.2. Market Analysis, Insights and Forecast - by Type
- 8.2.1. Powder Poly Carboxylate Polymer
- 8.2.2. Liquid Poly Carboxylate Polymer
- 8.1. Market Analysis, Insights and Forecast - by Application
- 9. Europe Poly Carboxylate Polymer Analysis, Insights and Forecast, 2020-2032
- 9.1. Market Analysis, Insights and Forecast - by Application
- 9.1.1. Water Reducing Agent
- 9.1.2. Admixture
- 9.1.3. Impermeable Waterproofing Agent
- 9.2. Market Analysis, Insights and Forecast - by Type
- 9.2.1. Powder Poly Carboxylate Polymer
- 9.2.2. Liquid Poly Carboxylate Polymer
- 9.1. Market Analysis, Insights and Forecast - by Application
- 10. Middle East & Africa Poly Carboxylate Polymer Analysis, Insights and Forecast, 2020-2032
- 10.1. Market Analysis, Insights and Forecast - by Application
- 10.1.1. Water Reducing Agent
- 10.1.2. Admixture
- 10.1.3. Impermeable Waterproofing Agent
- 10.2. Market Analysis, Insights and Forecast - by Type
- 10.2.1. Powder Poly Carboxylate Polymer
- 10.2.2. Liquid Poly Carboxylate Polymer
- 10.1. Market Analysis, Insights and Forecast - by Application
- 11. Asia Pacific Poly Carboxylate Polymer Analysis, Insights and Forecast, 2020-2032
- 11.1. Market Analysis, Insights and Forecast - by Application
- 11.1.1. Water Reducing Agent
- 11.1.2. Admixture
- 11.1.3. Impermeable Waterproofing Agent
- 11.2. Market Analysis, Insights and Forecast - by Type
- 11.2.1. Powder Poly Carboxylate Polymer
- 11.2.2. Liquid Poly Carboxylate Polymer
- 11.1. Market Analysis, Insights and Forecast - by Application
- 12. Competitive Analysis
- 12.1. Company Profiles
- 12.1.1 SIKA
- 12.1.1.1. Company Overview
- 12.1.1.2. Products
- 12.1.1.3. Company Financials
- 12.1.1.4. SWOT Analysis
- 12.1.2 Arkema
- 12.1.2.1. Company Overview
- 12.1.2.2. Products
- 12.1.2.3. Company Financials
- 12.1.2.4. SWOT Analysis
- 12.1.3 BASF
- 12.1.3.1. Company Overview
- 12.1.3.2. Products
- 12.1.3.3. Company Financials
- 12.1.3.4. SWOT Analysis
- 12.1.4 Grace
- 12.1.4.1. Company Overview
- 12.1.4.2. Products
- 12.1.4.3. Company Financials
- 12.1.4.4. SWOT Analysis
- 12.1.5 Fosroc
- 12.1.5.1. Company Overview
- 12.1.5.2. Products
- 12.1.5.3. Company Financials
- 12.1.5.4. SWOT Analysis
- 12.1.6 KAO
- 12.1.6.1. Company Overview
- 12.1.6.2. Products
- 12.1.6.3. Company Financials
- 12.1.6.4. SWOT Analysis
- 12.1.7 Mapei
- 12.1.7.1. Company Overview
- 12.1.7.2. Products
- 12.1.7.3. Company Financials
- 12.1.7.4. SWOT Analysis
- 12.1.8 Euclid Chemical
- 12.1.8.1. Company Overview
- 12.1.8.2. Products
- 12.1.8.3. Company Financials
- 12.1.8.4. SWOT Analysis
- 12.1.9 Takemoto
- 12.1.9.1. Company Overview
- 12.1.9.2. Products
- 12.1.9.3. Company Financials
- 12.1.9.4. SWOT Analysis
- 12.1.10 Nippon Shokubai
- 12.1.10.1. Company Overview
- 12.1.10.2. Products
- 12.1.10.3. Company Financials
- 12.1.10.4. SWOT Analysis
- 12.1.11 Lonsen
- 12.1.11.1. Company Overview
- 12.1.11.2. Products
- 12.1.11.3. Company Financials
- 12.1.11.4. SWOT Analysis
- 12.1.12 YuHong
- 12.1.12.1. Company Overview
- 12.1.12.2. Products
- 12.1.12.3. Company Financials
- 12.1.12.4. SWOT Analysis
- 12.1.13 Feilong Concrete Admixture
- 12.1.13.1. Company Overview
- 12.1.13.2. Products
- 12.1.13.3. Company Financials
- 12.1.13.4. SWOT Analysis
- 12.1.14 SOBUTE
- 12.1.14.1. Company Overview
- 12.1.14.2. Products
- 12.1.14.3. Company Financials
- 12.1.14.4. SWOT Analysis
- 12.1.15 Changan Yucai
- 12.1.15.1. Company Overview
- 12.1.15.2. Products
- 12.1.15.3. Company Financials
- 12.1.15.4. SWOT Analysis
- 12.1.16 JILONG CONSTRUCTION CHEMICALS
- 12.1.16.1. Company Overview
- 12.1.16.2. Products
- 12.1.16.3. Company Financials
- 12.1.16.4. SWOT Analysis
- 12.1.17 Kelong Chemical
- 12.1.17.1. Company Overview
- 12.1.17.2. Products
- 12.1.17.3. Company Financials
- 12.1.17.4. SWOT Analysis
- 12.1.18 Kezhijie
- 12.1.18.1. Company Overview
- 12.1.18.2. Products
- 12.1.18.3. Company Financials
- 12.1.18.4. SWOT Analysis
- 12.1.19 Huangteng Chemical
- 12.1.19.1. Company Overview
- 12.1.19.2. Products
- 12.1.19.3. Company Financials
- 12.1.19.4. SWOT Analysis
- 12.1.20 Sansheng Special Building Material
- 12.1.20.1. Company Overview
- 12.1.20.2. Products
- 12.1.20.3. Company Financials
- 12.1.20.4. SWOT Analysis
- 12.1.21 Huawei Jiancai Building Material
- 12.1.21.1. Company Overview
- 12.1.21.2. Products
- 12.1.21.3. Company Financials
- 12.1.21.4. SWOT Analysis
- 12.1.22 Shanxi Huawei Keji
- 12.1.22.1. Company Overview
- 12.1.22.2. Products
- 12.1.22.3. Company Financials
- 12.1.22.4. SWOT Analysis
- 12.1.23 ARIT
- 12.1.23.1. Company Overview
- 12.1.23.2. Products
- 12.1.23.3. Company Financials
- 12.1.23.4. SWOT Analysis
- 12.1.1 SIKA
- 12.2. Market Entropy
- 12.2.1 Company's Key Areas Served
- 12.2.2 Recent Developments
- 12.3. Company Market Share Analysis 2025
- 12.3.1 Top 5 Companies Market Share Analysis
- 12.3.2 Top 3 Companies Market Share Analysis
- 12.4. List of Potential Customers
- 13. Research Methodology
List of Figures
- Figure 1: Global Poly Carboxylate Polymer Revenue Breakdown (undefined, %) by Region 2025 & 2033
- Figure 2: North America Poly Carboxylate Polymer Revenue (undefined), by Application 2025 & 2033
- Figure 3: North America Poly Carboxylate Polymer Revenue Share (%), by Application 2025 & 2033
- Figure 4: North America Poly Carboxylate Polymer Revenue (undefined), by Type 2025 & 2033
- Figure 5: North America Poly Carboxylate Polymer Revenue Share (%), by Type 2025 & 2033
- Figure 6: North America Poly Carboxylate Polymer Revenue (undefined), by Country 2025 & 2033
- Figure 7: North America Poly Carboxylate Polymer Revenue Share (%), by Country 2025 & 2033
- Figure 8: South America Poly Carboxylate Polymer Revenue (undefined), by Application 2025 & 2033
- Figure 9: South America Poly Carboxylate Polymer Revenue Share (%), by Application 2025 & 2033
- Figure 10: South America Poly Carboxylate Polymer Revenue (undefined), by Type 2025 & 2033
- Figure 11: South America Poly Carboxylate Polymer Revenue Share (%), by Type 2025 & 2033
- Figure 12: South America Poly Carboxylate Polymer Revenue (undefined), by Country 2025 & 2033
- Figure 13: South America Poly Carboxylate Polymer Revenue Share (%), by Country 2025 & 2033
- Figure 14: Europe Poly Carboxylate Polymer Revenue (undefined), by Application 2025 & 2033
- Figure 15: Europe Poly Carboxylate Polymer Revenue Share (%), by Application 2025 & 2033
- Figure 16: Europe Poly Carboxylate Polymer Revenue (undefined), by Type 2025 & 2033
- Figure 17: Europe Poly Carboxylate Polymer Revenue Share (%), by Type 2025 & 2033
- Figure 18: Europe Poly Carboxylate Polymer Revenue (undefined), by Country 2025 & 2033
- Figure 19: Europe Poly Carboxylate Polymer Revenue Share (%), by Country 2025 & 2033
- Figure 20: Middle East & Africa Poly Carboxylate Polymer Revenue (undefined), by Application 2025 & 2033
- Figure 21: Middle East & Africa Poly Carboxylate Polymer Revenue Share (%), by Application 2025 & 2033
- Figure 22: Middle East & Africa Poly Carboxylate Polymer Revenue (undefined), by Type 2025 & 2033
- Figure 23: Middle East & Africa Poly Carboxylate Polymer Revenue Share (%), by Type 2025 & 2033
- Figure 24: Middle East & Africa Poly Carboxylate Polymer Revenue (undefined), by Country 2025 & 2033
- Figure 25: Middle East & Africa Poly Carboxylate Polymer Revenue Share (%), by Country 2025 & 2033
- Figure 26: Asia Pacific Poly Carboxylate Polymer Revenue (undefined), by Application 2025 & 2033
- Figure 27: Asia Pacific Poly Carboxylate Polymer Revenue Share (%), by Application 2025 & 2033
- Figure 28: Asia Pacific Poly Carboxylate Polymer Revenue (undefined), by Type 2025 & 2033
- Figure 29: Asia Pacific Poly Carboxylate Polymer Revenue Share (%), by Type 2025 & 2033
- Figure 30: Asia Pacific Poly Carboxylate Polymer Revenue (undefined), by Country 2025 & 2033
- Figure 31: Asia Pacific Poly Carboxylate Polymer Revenue Share (%), by Country 2025 & 2033
List of Tables
- Table 1: Global Poly Carboxylate Polymer Revenue undefined Forecast, by Application 2020 & 2033
- Table 2: Global Poly Carboxylate Polymer Revenue undefined Forecast, by Type 2020 & 2033
- Table 3: Global Poly Carboxylate Polymer Revenue undefined Forecast, by Region 2020 & 2033
- Table 4: Global Poly Carboxylate Polymer Revenue undefined Forecast, by Application 2020 & 2033
- Table 5: Global Poly Carboxylate Polymer Revenue undefined Forecast, by Type 2020 & 2033
- Table 6: Global Poly Carboxylate Polymer Revenue undefined Forecast, by Country 2020 & 2033
- Table 7: United States Poly Carboxylate Polymer Revenue (undefined) Forecast, by Application 2020 & 2033
- Table 8: Canada Poly Carboxylate Polymer Revenue (undefined) Forecast, by Application 2020 & 2033
- Table 9: Mexico Poly Carboxylate Polymer Revenue (undefined) Forecast, by Application 2020 & 2033
- Table 10: Global Poly Carboxylate Polymer Revenue undefined Forecast, by Application 2020 & 2033
- Table 11: Global Poly Carboxylate Polymer Revenue undefined Forecast, by Type 2020 & 2033
- Table 12: Global Poly Carboxylate Polymer Revenue undefined Forecast, by Country 2020 & 2033
- Table 13: Brazil Poly Carboxylate Polymer Revenue (undefined) Forecast, by Application 2020 & 2033
- Table 14: Argentina Poly Carboxylate Polymer Revenue (undefined) Forecast, by Application 2020 & 2033
- Table 15: Rest of South America Poly Carboxylate Polymer Revenue (undefined) Forecast, by Application 2020 & 2033
- Table 16: Global Poly Carboxylate Polymer Revenue undefined Forecast, by Application 2020 & 2033
- Table 17: Global Poly Carboxylate Polymer Revenue undefined Forecast, by Type 2020 & 2033
- Table 18: Global Poly Carboxylate Polymer Revenue undefined Forecast, by Country 2020 & 2033
- Table 19: United Kingdom Poly Carboxylate Polymer Revenue (undefined) Forecast, by Application 2020 & 2033
- Table 20: Germany Poly Carboxylate Polymer Revenue (undefined) Forecast, by Application 2020 & 2033
- Table 21: France Poly Carboxylate Polymer Revenue (undefined) Forecast, by Application 2020 & 2033
- Table 22: Italy Poly Carboxylate Polymer Revenue (undefined) Forecast, by Application 2020 & 2033
- Table 23: Spain Poly Carboxylate Polymer Revenue (undefined) Forecast, by Application 2020 & 2033
- Table 24: Russia Poly Carboxylate Polymer Revenue (undefined) Forecast, by Application 2020 & 2033
- Table 25: Benelux Poly Carboxylate Polymer Revenue (undefined) Forecast, by Application 2020 & 2033
- Table 26: Nordics Poly Carboxylate Polymer Revenue (undefined) Forecast, by Application 2020 & 2033
- Table 27: Rest of Europe Poly Carboxylate Polymer Revenue (undefined) Forecast, by Application 2020 & 2033
- Table 28: Global Poly Carboxylate Polymer Revenue undefined Forecast, by Application 2020 & 2033
- Table 29: Global Poly Carboxylate Polymer Revenue undefined Forecast, by Type 2020 & 2033
- Table 30: Global Poly Carboxylate Polymer Revenue undefined Forecast, by Country 2020 & 2033
- Table 31: Turkey Poly Carboxylate Polymer Revenue (undefined) Forecast, by Application 2020 & 2033
- Table 32: Israel Poly Carboxylate Polymer Revenue (undefined) Forecast, by Application 2020 & 2033
- Table 33: GCC Poly Carboxylate Polymer Revenue (undefined) Forecast, by Application 2020 & 2033
- Table 34: North Africa Poly Carboxylate Polymer Revenue (undefined) Forecast, by Application 2020 & 2033
- Table 35: South Africa Poly Carboxylate Polymer Revenue (undefined) Forecast, by Application 2020 & 2033
- Table 36: Rest of Middle East & Africa Poly Carboxylate Polymer Revenue (undefined) Forecast, by Application 2020 & 2033
- Table 37: Global Poly Carboxylate Polymer Revenue undefined Forecast, by Application 2020 & 2033
- Table 38: Global Poly Carboxylate Polymer Revenue undefined Forecast, by Type 2020 & 2033
- Table 39: Global Poly Carboxylate Polymer Revenue undefined Forecast, by Country 2020 & 2033
- Table 40: China Poly Carboxylate Polymer Revenue (undefined) Forecast, by Application 2020 & 2033
- Table 41: India Poly Carboxylate Polymer Revenue (undefined) Forecast, by Application 2020 & 2033
- Table 42: Japan Poly Carboxylate Polymer Revenue (undefined) Forecast, by Application 2020 & 2033
- Table 43: South Korea Poly Carboxylate Polymer Revenue (undefined) Forecast, by Application 2020 & 2033
- Table 44: ASEAN Poly Carboxylate Polymer Revenue (undefined) Forecast, by Application 2020 & 2033
- Table 45: Oceania Poly Carboxylate Polymer Revenue (undefined) Forecast, by Application 2020 & 2033
- Table 46: Rest of Asia Pacific Poly Carboxylate Polymer Revenue (undefined) Forecast, by Application 2020 & 2033
Frequently Asked Questions
1. What is the projected Compound Annual Growth Rate (CAGR) of the Poly Carboxylate Polymer?
The projected CAGR is approximately 6.3%.
2. Which companies are prominent players in the Poly Carboxylate Polymer?
Key companies in the market include SIKA, Arkema, BASF, Grace, Fosroc, KAO, Mapei, Euclid Chemical, Takemoto, Nippon Shokubai, Lonsen, YuHong, Feilong Concrete Admixture, SOBUTE, Changan Yucai, JILONG CONSTRUCTION CHEMICALS, Kelong Chemical, Kezhijie, Huangteng Chemical, Sansheng Special Building Material, Huawei Jiancai Building Material, Shanxi Huawei Keji, ARIT.
3. What are the main segments of the Poly Carboxylate Polymer?
The market segments include Application, Type.
4. Can you provide details about the market size?
The market size is estimated to be USD XXX N/A as of 2022.
5. What are some drivers contributing to market growth?
N/A
6. What are the notable trends driving market growth?
N/A
7. Are there any restraints impacting market growth?
N/A
8. Can you provide examples of recent developments in the market?
N/A
9. What pricing options are available for accessing the report?
Pricing options include single-user, multi-user, and enterprise licenses priced at USD 4250.00, USD 6375.00, and USD 8500.00 respectively.
10. Is the market size provided in terms of value or volume?
The market size is provided in terms of value, measured in N/A.
11. Are there any specific market keywords associated with the report?
Yes, the market keyword associated with the report is "Poly Carboxylate Polymer," which aids in identifying and referencing the specific market segment covered.
12. How do I determine which pricing option suits my needs best?
The pricing options vary based on user requirements and access needs. Individual users may opt for single-user licenses, while businesses requiring broader access may choose multi-user or enterprise licenses for cost-effective access to the report.
13. Are there any additional resources or data provided in the Poly Carboxylate Polymer report?
While the report offers comprehensive insights, it's advisable to review the specific contents or supplementary materials provided to ascertain if additional resources or data are available.
14. How can I stay updated on further developments or reports in the Poly Carboxylate Polymer?
To stay informed about further developments, trends, and reports in the Poly Carboxylate Polymer, consider subscribing to industry newsletters, following relevant companies and organizations, or regularly checking reputable industry news sources and publications.
Methodology
Step 1 - Identification of Relevant Samples Size from Population Database


Step 2 - Approaches for Defining Global Market Size (Value, Volume* & Price*)

Note*: In applicable scenarios
Step 3 - Data Sources
Primary Research
- Web Analytics
- Survey Reports
- Research Institute
- Latest Research Reports
- Opinion Leaders
Secondary Research
- Annual Reports
- White Paper
- Latest Press Release
- Industry Association
- Paid Database
- Investor Presentations

Step 4 - Data Triangulation
Involves using different sources of information in order to increase the validity of a study
These sources are likely to be stakeholders in a program - participants, other researchers, program staff, other community members, and so on.
Then we put all data in single framework & apply various statistical tools to find out the dynamic on the market.
During the analysis stage, feedback from the stakeholder groups would be compared to determine areas of agreement as well as areas of divergence