
Key Insights
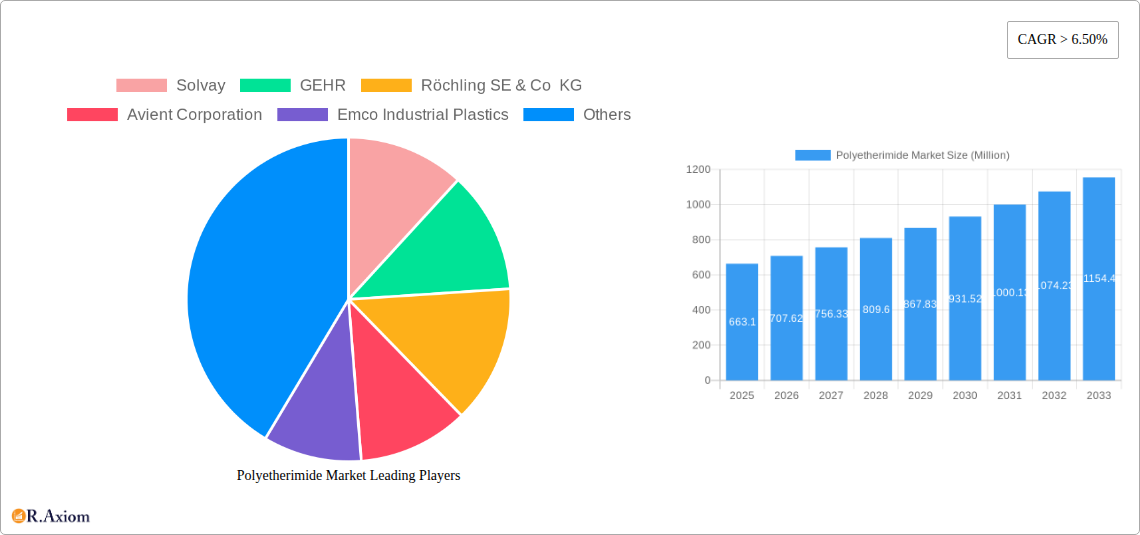
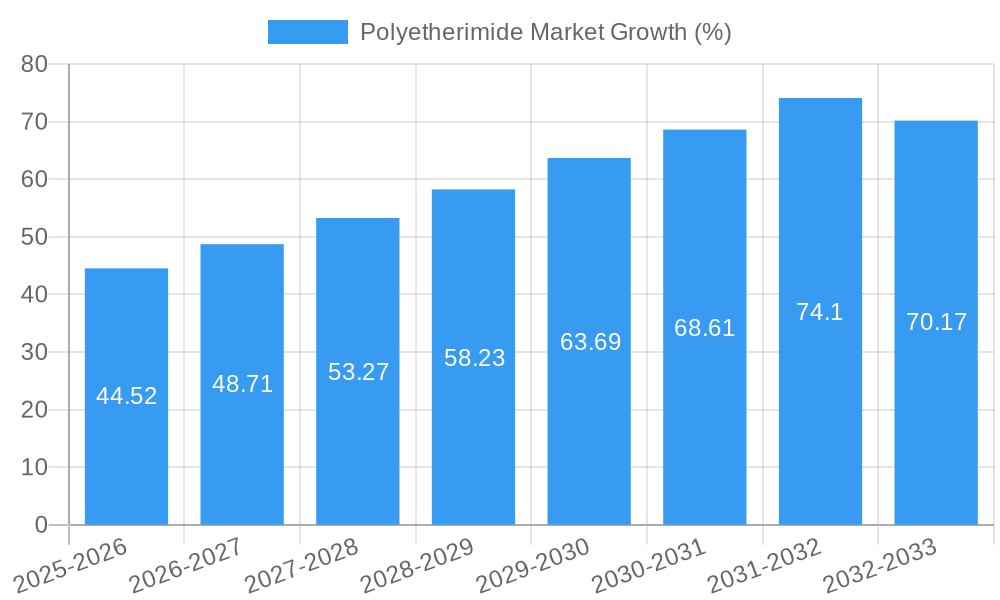
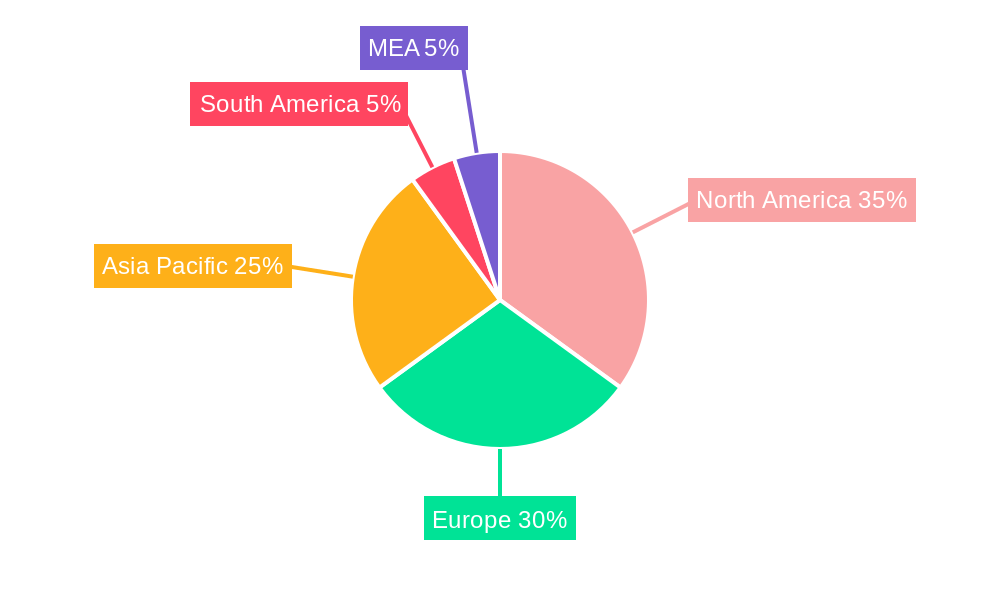
The polyetherimide (PEI) market, valued at $663.10 million in 2025, is projected to experience robust growth, exhibiting a compound annual growth rate (CAGR) exceeding 6.5% from 2025 to 2033. This expansion is driven by several key factors. The increasing demand for high-performance materials in diverse sectors like transportation (lightweighting in automobiles and aerospace), electrical and electronics (high-temperature insulation and connectors), and healthcare (sterilizable medical devices) fuels market growth. Furthermore, the rising adoption of PEI in consumer goods, household appliances, and industrial applications due to its superior properties such as heat resistance, chemical resistance, and excellent mechanical strength contributes significantly to market expansion. Technological advancements leading to improved PEI formulations with enhanced properties are also driving market growth. The market is segmented by grade (reinforced and unreinforced) and end-user industry, with the transportation and electrical & electronics segments currently dominating market share. Geographic growth is expected across regions, with North America, Europe, and Asia Pacific representing significant markets, fueled by established manufacturing bases and strong demand from various industries.
Despite the positive outlook, market growth faces certain constraints. The high cost of PEI compared to other engineering plastics could limit wider adoption, particularly in price-sensitive markets. Fluctuations in raw material prices and supply chain disruptions can also impact market growth. However, the long-term outlook remains optimistic due to the inherent advantages of PEI and its increasing relevance in applications demanding superior performance and durability. The competitive landscape features established players like Solvay, SABIC, and Mitsubishi Chemical Group, alongside several regional and specialty players, fostering innovation and competition within the market. Ongoing research and development efforts focused on enhancing PEI properties and exploring new applications are expected to further propel market growth during the forecast period.
Polyetherimide Market: A Comprehensive Analysis (2019-2033)
This detailed report offers a comprehensive analysis of the Polyetherimide (PEI) market, providing actionable insights for stakeholders across the value chain. The study covers the period from 2019 to 2033, with a base year of 2025 and a forecast period of 2025-2033. The report utilizes a robust methodology, incorporating both primary and secondary research to deliver precise market sizing and growth projections. This report is invaluable for businesses seeking to understand market trends, competitive landscapes, and future opportunities within the dynamic PEI market.
Polyetherimide Market Concentration & Innovation
This section delves into the competitive landscape of the Polyetherimide market, analyzing market concentration, innovation drivers, and regulatory influences. The report examines the market share held by key players like Solvay, GEHR, Röchling SE & Co KG, Avient Corporation, Emco Industrial Plastics, SABIC, Mitsubishi Chemical Group, RTP Company, Kuraray Europe GmbH, Aikolon Oy, Ensinger, and Eagle Performance Plastics Inc. We analyze the impact of mergers and acquisitions (M&A) activities, including deal values and their influence on market consolidation. The report also examines the role of innovation in driving market growth, including the development of new PEI grades with enhanced properties, and the regulatory frameworks impacting the adoption of PEI in various applications. Furthermore, we investigate the presence and impact of substitute materials and their potential to influence market dynamics and assess future trends in end-user demand and preferences. Analysis includes detailed assessments of market share distribution, identifying dominant players and their strategic maneuvers to maintain or increase their market presence. The impact of technological advancements and the introduction of novel PEI formulations will be scrutinized, and the impact of governmental regulations and environmental concerns on product development and market penetration will also be addressed. The section concludes by providing insights into projected M&A activity in the upcoming years, highlighting potential changes to market concentration and competitive dynamics. The xx Million market size (2025 estimated) is projected to reach xx Million by 2033, indicating substantial market growth.
Polyetherimide Market Industry Trends & Insights
This section provides an in-depth analysis of the key trends shaping the Polyetherimide market. The report examines the drivers of market growth, including increasing demand from key end-user industries such as transportation, electronics, and healthcare. We delve into technological advancements such as the development of high-performance PEI grades with improved thermal stability and chemical resistance, as well as the impact of these advancements on market penetration and growth. The analysis incorporates a detailed examination of consumer preferences and evolving needs, driving demand for specific PEI grades. Competitive dynamics are assessed, examining the strategies employed by key players to gain and maintain market share. This involves a thorough evaluation of product differentiation, pricing strategies, and marketing efforts. The report will also provide a detailed analysis of the Compound Annual Growth Rate (CAGR) of the Polyetherimide market during the forecast period and its penetration rate within different end-user segments. Furthermore, the report will quantify and analyze the impact of various market drivers and trends on the overall market growth, including forecasts for future demand based on current economic trends and technological developments. The report will identify regions exhibiting high growth and their underlying reasons, including factors like economic policies and government investments.
Dominant Markets & Segments in Polyetherimide Market
This section identifies the leading regions, countries, and segments within the Polyetherimide market. For Grade, it analyzes the dominance of Reinforced and Unreinforced PEI, detailing the factors driving their respective market shares. For End-User Industry, the analysis covers Transportation, Electrical and Electronics, Consumer Goods, Healthcare, Household and Industrial Appliances, and Others. The section uses a combination of bullet points and detailed paragraphs to highlight key drivers and conduct a dominance analysis.
Leading Regions/Countries: [Insert leading region/country and rationale for dominance. Include economic policies, infrastructure development, and industry-specific factors.]
Grade:
- Reinforced PEI: [Reasons for dominance, market size projection, and competitive landscape]
- Unreinforced PEI: [Reasons for dominance, market size projection, and competitive landscape]
End-User Industry:
- Transportation: [Reasons for dominance, market size projection, and competitive landscape – e.g., growth in automotive and aerospace]
- Electrical and Electronics: [Reasons for dominance, market size projection, and competitive landscape – e.g., demand for high-performance electronics]
- Consumer Goods: [Reasons for dominance, market size projection, and competitive landscape]
- Healthcare: [Reasons for dominance, market size projection, and competitive landscape – e.g., demand for biocompatible materials]
- Household and Industrial Appliances: [Reasons for dominance, market size projection, and competitive landscape]
- Others: [Reasons for dominance, market size projection, and competitive landscape]
Polyetherimide Market Product Developments
This section summarizes recent product innovations, applications, and the competitive advantages they offer. The discussion focuses on technological trends driving innovation and how new product offerings align with market demand and address specific industry needs. This includes advancements in PEI formulations, leading to enhanced properties like improved heat resistance, chemical resistance, and mechanical strength, and their impact on the market.
Report Scope & Segmentation Analysis
This report segments the Polyetherimide market based on Grade (Reinforced, Unreinforced) and End-User Industry (Transportation, Electrical and Electronics, Consumer Goods, Healthcare, Household and Industrial Appliances, Others). Each segment is analyzed individually, with growth projections, market sizes, and competitive dynamics discussed. The report provides a comprehensive overview of each segment, outlining its size, growth rate, key players, and market trends.
Key Drivers of Polyetherimide Market Growth
Key drivers include the growing demand for high-performance materials in various end-user industries, particularly in the automotive and aerospace sectors, driven by stringent regulations and the increasing need for lightweight, durable components. Technological advancements leading to improved PEI properties contribute significantly to market expansion. Furthermore, favorable economic conditions in key regions and supportive government policies further stimulate market growth.
Challenges in the Polyetherimide Market Sector
Challenges include the high cost of PEI compared to alternative materials, potentially limiting its widespread adoption. Supply chain disruptions and fluctuations in raw material prices can significantly impact production costs and profitability. Intense competition among established players also presents a challenge, necessitating continuous innovation and strategic maneuvering to maintain market share.
Emerging Opportunities in Polyetherimide Market
Emerging opportunities lie in the exploration of new applications for PEI in areas such as 3D printing and advanced electronics. The development of sustainable and recyclable PEI formulations also presents significant opportunities, aligning with growing environmental concerns. Expansion into emerging markets with growing industrialization further opens up avenues for market growth.
Leading Players in the Polyetherimide Market Market
- Solvay
- GEHR
- Röchling SE & Co KG
- Avient Corporation
- Emco Industrial Plastics
- SABIC
- The Mitsubishi Chemical Group of companies
- RTP Company
- Kuraray Europe GmbH
- Aikolon Oy
- Ensinger
- Eagle Performance Plastics Inc
Key Developments in Polyetherimide Market Industry
- [Insert key developments with year/month, e.g., "January 2023: Solvay launched a new high-performance PEI grade."]
- [Insert key developments with year/month, e.g., "October 2022: Avient Corporation announced a strategic partnership to expand its PEI production capacity."]
- [Continue adding bullet points as necessary]
Strategic Outlook for Polyetherimide Market Market
The Polyetherimide market is poised for significant growth, driven by continuous innovation, expanding applications, and increasing demand from key industries. The market's future potential is substantial, particularly in emerging economies and sectors with high growth trajectories. The strategic focus will remain on developing sustainable PEI solutions and expanding into new applications and markets to capitalize on the long-term growth opportunities.
Polyetherimide Market Segmentation
-
1. Grade
- 1.1. Reinforced
- 1.2. Unreinforced
-
2. End-User Industry
- 2.1. Transportation
- 2.2. Electrical and Electronics
- 2.3. Consumer Goods
- 2.4. Healthcare
- 2.5. Household and Industrial Appliances
- 2.6. Others
Polyetherimide Market Segmentation By Geography
-
1. Asia Pacific
- 1.1. China
- 1.2. India
- 1.3. Japan
- 1.4. South Korea
- 1.5. Southeast ASia
- 1.6. Australia
- 1.7. Rest of Asia Pacific
-
2. North America
- 2.1. United States
- 2.2. Canada
- 2.3. Mexico
-
3. Europe
- 3.1. Germany
- 3.2. United Kingdom
- 3.3. Italy
- 3.4. France
- 3.5. Spain
- 3.6. Rest of Europe
-
4. South America
- 4.1. Brazil
- 4.2. Argentina
- 4.3. Colombia
- 4.4. Rest of South America
-
5. Middle East and Africa
- 5.1. Saudi Arabia
- 5.2. South Africa
- 5.3. UAE
- 5.4. Rest of Middle East and Africa
Polyetherimide Market REPORT HIGHLIGHTS
| Aspects | Details |
|---|---|
| Study Period | 2019-2033 |
| Base Year | 2024 |
| Estimated Year | 2025 |
| Forecast Period | 2025-2033 |
| Historical Period | 2019-2024 |
| Growth Rate | CAGR of > 6.50% from 2019-2033 |
| Segmentation |
|
Table of Contents
- 1. Introduction
- 1.1. Research Scope
- 1.2. Market Segmentation
- 1.3. Research Methodology
- 1.4. Definitions and Assumptions
- 2. Executive Summary
- 2.1. Introduction
- 3. Market Dynamics
- 3.1. Introduction
- 3.2. Market Drivers
- 3.2.1. Increasing Demand from the Transportation Industry; Rapid Growth in the Automotive Sector; Increasing Usage in Healthcare Sector
- 3.3. Market Restrains
- 3.3.1. High Price When Compared to the Conventional Polymers; Availability of Substitute Materials
- 3.4. Market Trends
- 3.4.1. Increasing demand from Electrical & Electronics Industry
- 4. Market Factor Analysis
- 4.1. Porters Five Forces
- 4.2. Supply/Value Chain
- 4.3. PESTEL analysis
- 4.4. Market Entropy
- 4.5. Patent/Trademark Analysis
- 5. Global Polyetherimide Market Analysis, Insights and Forecast, 2019-2031
- 5.1. Market Analysis, Insights and Forecast - by Grade
- 5.1.1. Reinforced
- 5.1.2. Unreinforced
- 5.2. Market Analysis, Insights and Forecast - by End-User Industry
- 5.2.1. Transportation
- 5.2.2. Electrical and Electronics
- 5.2.3. Consumer Goods
- 5.2.4. Healthcare
- 5.2.5. Household and Industrial Appliances
- 5.2.6. Others
- 5.3. Market Analysis, Insights and Forecast - by Region
- 5.3.1. Asia Pacific
- 5.3.2. North America
- 5.3.3. Europe
- 5.3.4. South America
- 5.3.5. Middle East and Africa
- 5.1. Market Analysis, Insights and Forecast - by Grade
- 6. Asia Pacific Polyetherimide Market Analysis, Insights and Forecast, 2019-2031
- 6.1. Market Analysis, Insights and Forecast - by Grade
- 6.1.1. Reinforced
- 6.1.2. Unreinforced
- 6.2. Market Analysis, Insights and Forecast - by End-User Industry
- 6.2.1. Transportation
- 6.2.2. Electrical and Electronics
- 6.2.3. Consumer Goods
- 6.2.4. Healthcare
- 6.2.5. Household and Industrial Appliances
- 6.2.6. Others
- 6.1. Market Analysis, Insights and Forecast - by Grade
- 7. North America Polyetherimide Market Analysis, Insights and Forecast, 2019-2031
- 7.1. Market Analysis, Insights and Forecast - by Grade
- 7.1.1. Reinforced
- 7.1.2. Unreinforced
- 7.2. Market Analysis, Insights and Forecast - by End-User Industry
- 7.2.1. Transportation
- 7.2.2. Electrical and Electronics
- 7.2.3. Consumer Goods
- 7.2.4. Healthcare
- 7.2.5. Household and Industrial Appliances
- 7.2.6. Others
- 7.1. Market Analysis, Insights and Forecast - by Grade
- 8. Europe Polyetherimide Market Analysis, Insights and Forecast, 2019-2031
- 8.1. Market Analysis, Insights and Forecast - by Grade
- 8.1.1. Reinforced
- 8.1.2. Unreinforced
- 8.2. Market Analysis, Insights and Forecast - by End-User Industry
- 8.2.1. Transportation
- 8.2.2. Electrical and Electronics
- 8.2.3. Consumer Goods
- 8.2.4. Healthcare
- 8.2.5. Household and Industrial Appliances
- 8.2.6. Others
- 8.1. Market Analysis, Insights and Forecast - by Grade
- 9. South America Polyetherimide Market Analysis, Insights and Forecast, 2019-2031
- 9.1. Market Analysis, Insights and Forecast - by Grade
- 9.1.1. Reinforced
- 9.1.2. Unreinforced
- 9.2. Market Analysis, Insights and Forecast - by End-User Industry
- 9.2.1. Transportation
- 9.2.2. Electrical and Electronics
- 9.2.3. Consumer Goods
- 9.2.4. Healthcare
- 9.2.5. Household and Industrial Appliances
- 9.2.6. Others
- 9.1. Market Analysis, Insights and Forecast - by Grade
- 10. Middle East and Africa Polyetherimide Market Analysis, Insights and Forecast, 2019-2031
- 10.1. Market Analysis, Insights and Forecast - by Grade
- 10.1.1. Reinforced
- 10.1.2. Unreinforced
- 10.2. Market Analysis, Insights and Forecast - by End-User Industry
- 10.2.1. Transportation
- 10.2.2. Electrical and Electronics
- 10.2.3. Consumer Goods
- 10.2.4. Healthcare
- 10.2.5. Household and Industrial Appliances
- 10.2.6. Others
- 10.1. Market Analysis, Insights and Forecast - by Grade
- 11. North America Polyetherimide Market Analysis, Insights and Forecast, 2019-2031
- 11.1. Market Analysis, Insights and Forecast - By Country/Sub-region
- 11.1.1 United States
- 11.1.2 Canada
- 11.1.3 Mexico
- 12. Europe Polyetherimide Market Analysis, Insights and Forecast, 2019-2031
- 12.1. Market Analysis, Insights and Forecast - By Country/Sub-region
- 12.1.1 Germany
- 12.1.2 United Kingdom
- 12.1.3 France
- 12.1.4 Spain
- 12.1.5 Italy
- 12.1.6 Spain
- 12.1.7 Belgium
- 12.1.8 Netherland
- 12.1.9 Nordics
- 12.1.10 Rest of Europe
- 13. Asia Pacific Polyetherimide Market Analysis, Insights and Forecast, 2019-2031
- 13.1. Market Analysis, Insights and Forecast - By Country/Sub-region
- 13.1.1 China
- 13.1.2 Japan
- 13.1.3 India
- 13.1.4 South Korea
- 13.1.5 Southeast Asia
- 13.1.6 Australia
- 13.1.7 Indonesia
- 13.1.8 Phillipes
- 13.1.9 Singapore
- 13.1.10 Thailandc
- 13.1.11 Rest of Asia Pacific
- 14. South America Polyetherimide Market Analysis, Insights and Forecast, 2019-2031
- 14.1. Market Analysis, Insights and Forecast - By Country/Sub-region
- 14.1.1 Brazil
- 14.1.2 Argentina
- 14.1.3 Peru
- 14.1.4 Chile
- 14.1.5 Colombia
- 14.1.6 Ecuador
- 14.1.7 Venezuela
- 14.1.8 Rest of South America
- 15. North America Polyetherimide Market Analysis, Insights and Forecast, 2019-2031
- 15.1. Market Analysis, Insights and Forecast - By Country/Sub-region
- 15.1.1 United States
- 15.1.2 Canada
- 15.1.3 Mexico
- 16. MEA Polyetherimide Market Analysis, Insights and Forecast, 2019-2031
- 16.1. Market Analysis, Insights and Forecast - By Country/Sub-region
- 16.1.1 United Arab Emirates
- 16.1.2 Saudi Arabia
- 16.1.3 South Africa
- 16.1.4 Rest of Middle East and Africa
- 17. Competitive Analysis
- 17.1. Global Market Share Analysis 2024
- 17.2. Company Profiles
- 17.2.1 Solvay
- 17.2.1.1. Overview
- 17.2.1.2. Products
- 17.2.1.3. SWOT Analysis
- 17.2.1.4. Recent Developments
- 17.2.1.5. Financials (Based on Availability)
- 17.2.2 GEHR
- 17.2.2.1. Overview
- 17.2.2.2. Products
- 17.2.2.3. SWOT Analysis
- 17.2.2.4. Recent Developments
- 17.2.2.5. Financials (Based on Availability)
- 17.2.3 Röchling SE & Co KG
- 17.2.3.1. Overview
- 17.2.3.2. Products
- 17.2.3.3. SWOT Analysis
- 17.2.3.4. Recent Developments
- 17.2.3.5. Financials (Based on Availability)
- 17.2.4 Avient Corporation
- 17.2.4.1. Overview
- 17.2.4.2. Products
- 17.2.4.3. SWOT Analysis
- 17.2.4.4. Recent Developments
- 17.2.4.5. Financials (Based on Availability)
- 17.2.5 Emco Industrial Plastics
- 17.2.5.1. Overview
- 17.2.5.2. Products
- 17.2.5.3. SWOT Analysis
- 17.2.5.4. Recent Developments
- 17.2.5.5. Financials (Based on Availability)
- 17.2.6 SABIC
- 17.2.6.1. Overview
- 17.2.6.2. Products
- 17.2.6.3. SWOT Analysis
- 17.2.6.4. Recent Developments
- 17.2.6.5. Financials (Based on Availability)
- 17.2.7 the Mitsubishi Chemical Group of companies
- 17.2.7.1. Overview
- 17.2.7.2. Products
- 17.2.7.3. SWOT Analysis
- 17.2.7.4. Recent Developments
- 17.2.7.5. Financials (Based on Availability)
- 17.2.8 RTP Company
- 17.2.8.1. Overview
- 17.2.8.2. Products
- 17.2.8.3. SWOT Analysis
- 17.2.8.4. Recent Developments
- 17.2.8.5. Financials (Based on Availability)
- 17.2.9 Kuraray Europe GmbH
- 17.2.9.1. Overview
- 17.2.9.2. Products
- 17.2.9.3. SWOT Analysis
- 17.2.9.4. Recent Developments
- 17.2.9.5. Financials (Based on Availability)
- 17.2.10 Aikolon Oy
- 17.2.10.1. Overview
- 17.2.10.2. Products
- 17.2.10.3. SWOT Analysis
- 17.2.10.4. Recent Developments
- 17.2.10.5. Financials (Based on Availability)
- 17.2.11 Ensinger
- 17.2.11.1. Overview
- 17.2.11.2. Products
- 17.2.11.3. SWOT Analysis
- 17.2.11.4. Recent Developments
- 17.2.11.5. Financials (Based on Availability)
- 17.2.12 Eagle Performance Plastics Inc
- 17.2.12.1. Overview
- 17.2.12.2. Products
- 17.2.12.3. SWOT Analysis
- 17.2.12.4. Recent Developments
- 17.2.12.5. Financials (Based on Availability)
- 17.2.1 Solvay
List of Figures
- Figure 1: Global Polyetherimide Market Revenue Breakdown (Million, %) by Region 2024 & 2032
- Figure 2: Global Polyetherimide Market Volume Breakdown (K Tons, %) by Region 2024 & 2032
- Figure 3: North America Polyetherimide Market Revenue (Million), by Country 2024 & 2032
- Figure 4: North America Polyetherimide Market Volume (K Tons), by Country 2024 & 2032
- Figure 5: North America Polyetherimide Market Revenue Share (%), by Country 2024 & 2032
- Figure 6: North America Polyetherimide Market Volume Share (%), by Country 2024 & 2032
- Figure 7: Europe Polyetherimide Market Revenue (Million), by Country 2024 & 2032
- Figure 8: Europe Polyetherimide Market Volume (K Tons), by Country 2024 & 2032
- Figure 9: Europe Polyetherimide Market Revenue Share (%), by Country 2024 & 2032
- Figure 10: Europe Polyetherimide Market Volume Share (%), by Country 2024 & 2032
- Figure 11: Asia Pacific Polyetherimide Market Revenue (Million), by Country 2024 & 2032
- Figure 12: Asia Pacific Polyetherimide Market Volume (K Tons), by Country 2024 & 2032
- Figure 13: Asia Pacific Polyetherimide Market Revenue Share (%), by Country 2024 & 2032
- Figure 14: Asia Pacific Polyetherimide Market Volume Share (%), by Country 2024 & 2032
- Figure 15: South America Polyetherimide Market Revenue (Million), by Country 2024 & 2032
- Figure 16: South America Polyetherimide Market Volume (K Tons), by Country 2024 & 2032
- Figure 17: South America Polyetherimide Market Revenue Share (%), by Country 2024 & 2032
- Figure 18: South America Polyetherimide Market Volume Share (%), by Country 2024 & 2032
- Figure 19: North America Polyetherimide Market Revenue (Million), by Country 2024 & 2032
- Figure 20: North America Polyetherimide Market Volume (K Tons), by Country 2024 & 2032
- Figure 21: North America Polyetherimide Market Revenue Share (%), by Country 2024 & 2032
- Figure 22: North America Polyetherimide Market Volume Share (%), by Country 2024 & 2032
- Figure 23: MEA Polyetherimide Market Revenue (Million), by Country 2024 & 2032
- Figure 24: MEA Polyetherimide Market Volume (K Tons), by Country 2024 & 2032
- Figure 25: MEA Polyetherimide Market Revenue Share (%), by Country 2024 & 2032
- Figure 26: MEA Polyetherimide Market Volume Share (%), by Country 2024 & 2032
- Figure 27: Asia Pacific Polyetherimide Market Revenue (Million), by Grade 2024 & 2032
- Figure 28: Asia Pacific Polyetherimide Market Volume (K Tons), by Grade 2024 & 2032
- Figure 29: Asia Pacific Polyetherimide Market Revenue Share (%), by Grade 2024 & 2032
- Figure 30: Asia Pacific Polyetherimide Market Volume Share (%), by Grade 2024 & 2032
- Figure 31: Asia Pacific Polyetherimide Market Revenue (Million), by End-User Industry 2024 & 2032
- Figure 32: Asia Pacific Polyetherimide Market Volume (K Tons), by End-User Industry 2024 & 2032
- Figure 33: Asia Pacific Polyetherimide Market Revenue Share (%), by End-User Industry 2024 & 2032
- Figure 34: Asia Pacific Polyetherimide Market Volume Share (%), by End-User Industry 2024 & 2032
- Figure 35: Asia Pacific Polyetherimide Market Revenue (Million), by Country 2024 & 2032
- Figure 36: Asia Pacific Polyetherimide Market Volume (K Tons), by Country 2024 & 2032
- Figure 37: Asia Pacific Polyetherimide Market Revenue Share (%), by Country 2024 & 2032
- Figure 38: Asia Pacific Polyetherimide Market Volume Share (%), by Country 2024 & 2032
- Figure 39: North America Polyetherimide Market Revenue (Million), by Grade 2024 & 2032
- Figure 40: North America Polyetherimide Market Volume (K Tons), by Grade 2024 & 2032
- Figure 41: North America Polyetherimide Market Revenue Share (%), by Grade 2024 & 2032
- Figure 42: North America Polyetherimide Market Volume Share (%), by Grade 2024 & 2032
- Figure 43: North America Polyetherimide Market Revenue (Million), by End-User Industry 2024 & 2032
- Figure 44: North America Polyetherimide Market Volume (K Tons), by End-User Industry 2024 & 2032
- Figure 45: North America Polyetherimide Market Revenue Share (%), by End-User Industry 2024 & 2032
- Figure 46: North America Polyetherimide Market Volume Share (%), by End-User Industry 2024 & 2032
- Figure 47: North America Polyetherimide Market Revenue (Million), by Country 2024 & 2032
- Figure 48: North America Polyetherimide Market Volume (K Tons), by Country 2024 & 2032
- Figure 49: North America Polyetherimide Market Revenue Share (%), by Country 2024 & 2032
- Figure 50: North America Polyetherimide Market Volume Share (%), by Country 2024 & 2032
- Figure 51: Europe Polyetherimide Market Revenue (Million), by Grade 2024 & 2032
- Figure 52: Europe Polyetherimide Market Volume (K Tons), by Grade 2024 & 2032
- Figure 53: Europe Polyetherimide Market Revenue Share (%), by Grade 2024 & 2032
- Figure 54: Europe Polyetherimide Market Volume Share (%), by Grade 2024 & 2032
- Figure 55: Europe Polyetherimide Market Revenue (Million), by End-User Industry 2024 & 2032
- Figure 56: Europe Polyetherimide Market Volume (K Tons), by End-User Industry 2024 & 2032
- Figure 57: Europe Polyetherimide Market Revenue Share (%), by End-User Industry 2024 & 2032
- Figure 58: Europe Polyetherimide Market Volume Share (%), by End-User Industry 2024 & 2032
- Figure 59: Europe Polyetherimide Market Revenue (Million), by Country 2024 & 2032
- Figure 60: Europe Polyetherimide Market Volume (K Tons), by Country 2024 & 2032
- Figure 61: Europe Polyetherimide Market Revenue Share (%), by Country 2024 & 2032
- Figure 62: Europe Polyetherimide Market Volume Share (%), by Country 2024 & 2032
- Figure 63: South America Polyetherimide Market Revenue (Million), by Grade 2024 & 2032
- Figure 64: South America Polyetherimide Market Volume (K Tons), by Grade 2024 & 2032
- Figure 65: South America Polyetherimide Market Revenue Share (%), by Grade 2024 & 2032
- Figure 66: South America Polyetherimide Market Volume Share (%), by Grade 2024 & 2032
- Figure 67: South America Polyetherimide Market Revenue (Million), by End-User Industry 2024 & 2032
- Figure 68: South America Polyetherimide Market Volume (K Tons), by End-User Industry 2024 & 2032
- Figure 69: South America Polyetherimide Market Revenue Share (%), by End-User Industry 2024 & 2032
- Figure 70: South America Polyetherimide Market Volume Share (%), by End-User Industry 2024 & 2032
- Figure 71: South America Polyetherimide Market Revenue (Million), by Country 2024 & 2032
- Figure 72: South America Polyetherimide Market Volume (K Tons), by Country 2024 & 2032
- Figure 73: South America Polyetherimide Market Revenue Share (%), by Country 2024 & 2032
- Figure 74: South America Polyetherimide Market Volume Share (%), by Country 2024 & 2032
- Figure 75: Middle East and Africa Polyetherimide Market Revenue (Million), by Grade 2024 & 2032
- Figure 76: Middle East and Africa Polyetherimide Market Volume (K Tons), by Grade 2024 & 2032
- Figure 77: Middle East and Africa Polyetherimide Market Revenue Share (%), by Grade 2024 & 2032
- Figure 78: Middle East and Africa Polyetherimide Market Volume Share (%), by Grade 2024 & 2032
- Figure 79: Middle East and Africa Polyetherimide Market Revenue (Million), by End-User Industry 2024 & 2032
- Figure 80: Middle East and Africa Polyetherimide Market Volume (K Tons), by End-User Industry 2024 & 2032
- Figure 81: Middle East and Africa Polyetherimide Market Revenue Share (%), by End-User Industry 2024 & 2032
- Figure 82: Middle East and Africa Polyetherimide Market Volume Share (%), by End-User Industry 2024 & 2032
- Figure 83: Middle East and Africa Polyetherimide Market Revenue (Million), by Country 2024 & 2032
- Figure 84: Middle East and Africa Polyetherimide Market Volume (K Tons), by Country 2024 & 2032
- Figure 85: Middle East and Africa Polyetherimide Market Revenue Share (%), by Country 2024 & 2032
- Figure 86: Middle East and Africa Polyetherimide Market Volume Share (%), by Country 2024 & 2032
List of Tables
- Table 1: Global Polyetherimide Market Revenue Million Forecast, by Region 2019 & 2032
- Table 2: Global Polyetherimide Market Volume K Tons Forecast, by Region 2019 & 2032
- Table 3: Global Polyetherimide Market Revenue Million Forecast, by Grade 2019 & 2032
- Table 4: Global Polyetherimide Market Volume K Tons Forecast, by Grade 2019 & 2032
- Table 5: Global Polyetherimide Market Revenue Million Forecast, by End-User Industry 2019 & 2032
- Table 6: Global Polyetherimide Market Volume K Tons Forecast, by End-User Industry 2019 & 2032
- Table 7: Global Polyetherimide Market Revenue Million Forecast, by Region 2019 & 2032
- Table 8: Global Polyetherimide Market Volume K Tons Forecast, by Region 2019 & 2032
- Table 9: Global Polyetherimide Market Revenue Million Forecast, by Country 2019 & 2032
- Table 10: Global Polyetherimide Market Volume K Tons Forecast, by Country 2019 & 2032
- Table 11: United States Polyetherimide Market Revenue (Million) Forecast, by Application 2019 & 2032
- Table 12: United States Polyetherimide Market Volume (K Tons) Forecast, by Application 2019 & 2032
- Table 13: Canada Polyetherimide Market Revenue (Million) Forecast, by Application 2019 & 2032
- Table 14: Canada Polyetherimide Market Volume (K Tons) Forecast, by Application 2019 & 2032
- Table 15: Mexico Polyetherimide Market Revenue (Million) Forecast, by Application 2019 & 2032
- Table 16: Mexico Polyetherimide Market Volume (K Tons) Forecast, by Application 2019 & 2032
- Table 17: Global Polyetherimide Market Revenue Million Forecast, by Country 2019 & 2032
- Table 18: Global Polyetherimide Market Volume K Tons Forecast, by Country 2019 & 2032
- Table 19: Germany Polyetherimide Market Revenue (Million) Forecast, by Application 2019 & 2032
- Table 20: Germany Polyetherimide Market Volume (K Tons) Forecast, by Application 2019 & 2032
- Table 21: United Kingdom Polyetherimide Market Revenue (Million) Forecast, by Application 2019 & 2032
- Table 22: United Kingdom Polyetherimide Market Volume (K Tons) Forecast, by Application 2019 & 2032
- Table 23: France Polyetherimide Market Revenue (Million) Forecast, by Application 2019 & 2032
- Table 24: France Polyetherimide Market Volume (K Tons) Forecast, by Application 2019 & 2032
- Table 25: Spain Polyetherimide Market Revenue (Million) Forecast, by Application 2019 & 2032
- Table 26: Spain Polyetherimide Market Volume (K Tons) Forecast, by Application 2019 & 2032
- Table 27: Italy Polyetherimide Market Revenue (Million) Forecast, by Application 2019 & 2032
- Table 28: Italy Polyetherimide Market Volume (K Tons) Forecast, by Application 2019 & 2032
- Table 29: Spain Polyetherimide Market Revenue (Million) Forecast, by Application 2019 & 2032
- Table 30: Spain Polyetherimide Market Volume (K Tons) Forecast, by Application 2019 & 2032
- Table 31: Belgium Polyetherimide Market Revenue (Million) Forecast, by Application 2019 & 2032
- Table 32: Belgium Polyetherimide Market Volume (K Tons) Forecast, by Application 2019 & 2032
- Table 33: Netherland Polyetherimide Market Revenue (Million) Forecast, by Application 2019 & 2032
- Table 34: Netherland Polyetherimide Market Volume (K Tons) Forecast, by Application 2019 & 2032
- Table 35: Nordics Polyetherimide Market Revenue (Million) Forecast, by Application 2019 & 2032
- Table 36: Nordics Polyetherimide Market Volume (K Tons) Forecast, by Application 2019 & 2032
- Table 37: Rest of Europe Polyetherimide Market Revenue (Million) Forecast, by Application 2019 & 2032
- Table 38: Rest of Europe Polyetherimide Market Volume (K Tons) Forecast, by Application 2019 & 2032
- Table 39: Global Polyetherimide Market Revenue Million Forecast, by Country 2019 & 2032
- Table 40: Global Polyetherimide Market Volume K Tons Forecast, by Country 2019 & 2032
- Table 41: China Polyetherimide Market Revenue (Million) Forecast, by Application 2019 & 2032
- Table 42: China Polyetherimide Market Volume (K Tons) Forecast, by Application 2019 & 2032
- Table 43: Japan Polyetherimide Market Revenue (Million) Forecast, by Application 2019 & 2032
- Table 44: Japan Polyetherimide Market Volume (K Tons) Forecast, by Application 2019 & 2032
- Table 45: India Polyetherimide Market Revenue (Million) Forecast, by Application 2019 & 2032
- Table 46: India Polyetherimide Market Volume (K Tons) Forecast, by Application 2019 & 2032
- Table 47: South Korea Polyetherimide Market Revenue (Million) Forecast, by Application 2019 & 2032
- Table 48: South Korea Polyetherimide Market Volume (K Tons) Forecast, by Application 2019 & 2032
- Table 49: Southeast Asia Polyetherimide Market Revenue (Million) Forecast, by Application 2019 & 2032
- Table 50: Southeast Asia Polyetherimide Market Volume (K Tons) Forecast, by Application 2019 & 2032
- Table 51: Australia Polyetherimide Market Revenue (Million) Forecast, by Application 2019 & 2032
- Table 52: Australia Polyetherimide Market Volume (K Tons) Forecast, by Application 2019 & 2032
- Table 53: Indonesia Polyetherimide Market Revenue (Million) Forecast, by Application 2019 & 2032
- Table 54: Indonesia Polyetherimide Market Volume (K Tons) Forecast, by Application 2019 & 2032
- Table 55: Phillipes Polyetherimide Market Revenue (Million) Forecast, by Application 2019 & 2032
- Table 56: Phillipes Polyetherimide Market Volume (K Tons) Forecast, by Application 2019 & 2032
- Table 57: Singapore Polyetherimide Market Revenue (Million) Forecast, by Application 2019 & 2032
- Table 58: Singapore Polyetherimide Market Volume (K Tons) Forecast, by Application 2019 & 2032
- Table 59: Thailandc Polyetherimide Market Revenue (Million) Forecast, by Application 2019 & 2032
- Table 60: Thailandc Polyetherimide Market Volume (K Tons) Forecast, by Application 2019 & 2032
- Table 61: Rest of Asia Pacific Polyetherimide Market Revenue (Million) Forecast, by Application 2019 & 2032
- Table 62: Rest of Asia Pacific Polyetherimide Market Volume (K Tons) Forecast, by Application 2019 & 2032
- Table 63: Global Polyetherimide Market Revenue Million Forecast, by Country 2019 & 2032
- Table 64: Global Polyetherimide Market Volume K Tons Forecast, by Country 2019 & 2032
- Table 65: Brazil Polyetherimide Market Revenue (Million) Forecast, by Application 2019 & 2032
- Table 66: Brazil Polyetherimide Market Volume (K Tons) Forecast, by Application 2019 & 2032
- Table 67: Argentina Polyetherimide Market Revenue (Million) Forecast, by Application 2019 & 2032
- Table 68: Argentina Polyetherimide Market Volume (K Tons) Forecast, by Application 2019 & 2032
- Table 69: Peru Polyetherimide Market Revenue (Million) Forecast, by Application 2019 & 2032
- Table 70: Peru Polyetherimide Market Volume (K Tons) Forecast, by Application 2019 & 2032
- Table 71: Chile Polyetherimide Market Revenue (Million) Forecast, by Application 2019 & 2032
- Table 72: Chile Polyetherimide Market Volume (K Tons) Forecast, by Application 2019 & 2032
- Table 73: Colombia Polyetherimide Market Revenue (Million) Forecast, by Application 2019 & 2032
- Table 74: Colombia Polyetherimide Market Volume (K Tons) Forecast, by Application 2019 & 2032
- Table 75: Ecuador Polyetherimide Market Revenue (Million) Forecast, by Application 2019 & 2032
- Table 76: Ecuador Polyetherimide Market Volume (K Tons) Forecast, by Application 2019 & 2032
- Table 77: Venezuela Polyetherimide Market Revenue (Million) Forecast, by Application 2019 & 2032
- Table 78: Venezuela Polyetherimide Market Volume (K Tons) Forecast, by Application 2019 & 2032
- Table 79: Rest of South America Polyetherimide Market Revenue (Million) Forecast, by Application 2019 & 2032
- Table 80: Rest of South America Polyetherimide Market Volume (K Tons) Forecast, by Application 2019 & 2032
- Table 81: Global Polyetherimide Market Revenue Million Forecast, by Country 2019 & 2032
- Table 82: Global Polyetherimide Market Volume K Tons Forecast, by Country 2019 & 2032
- Table 83: United States Polyetherimide Market Revenue (Million) Forecast, by Application 2019 & 2032
- Table 84: United States Polyetherimide Market Volume (K Tons) Forecast, by Application 2019 & 2032
- Table 85: Canada Polyetherimide Market Revenue (Million) Forecast, by Application 2019 & 2032
- Table 86: Canada Polyetherimide Market Volume (K Tons) Forecast, by Application 2019 & 2032
- Table 87: Mexico Polyetherimide Market Revenue (Million) Forecast, by Application 2019 & 2032
- Table 88: Mexico Polyetherimide Market Volume (K Tons) Forecast, by Application 2019 & 2032
- Table 89: Global Polyetherimide Market Revenue Million Forecast, by Country 2019 & 2032
- Table 90: Global Polyetherimide Market Volume K Tons Forecast, by Country 2019 & 2032
- Table 91: United Arab Emirates Polyetherimide Market Revenue (Million) Forecast, by Application 2019 & 2032
- Table 92: United Arab Emirates Polyetherimide Market Volume (K Tons) Forecast, by Application 2019 & 2032
- Table 93: Saudi Arabia Polyetherimide Market Revenue (Million) Forecast, by Application 2019 & 2032
- Table 94: Saudi Arabia Polyetherimide Market Volume (K Tons) Forecast, by Application 2019 & 2032
- Table 95: South Africa Polyetherimide Market Revenue (Million) Forecast, by Application 2019 & 2032
- Table 96: South Africa Polyetherimide Market Volume (K Tons) Forecast, by Application 2019 & 2032
- Table 97: Rest of Middle East and Africa Polyetherimide Market Revenue (Million) Forecast, by Application 2019 & 2032
- Table 98: Rest of Middle East and Africa Polyetherimide Market Volume (K Tons) Forecast, by Application 2019 & 2032
- Table 99: Global Polyetherimide Market Revenue Million Forecast, by Grade 2019 & 2032
- Table 100: Global Polyetherimide Market Volume K Tons Forecast, by Grade 2019 & 2032
- Table 101: Global Polyetherimide Market Revenue Million Forecast, by End-User Industry 2019 & 2032
- Table 102: Global Polyetherimide Market Volume K Tons Forecast, by End-User Industry 2019 & 2032
- Table 103: Global Polyetherimide Market Revenue Million Forecast, by Country 2019 & 2032
- Table 104: Global Polyetherimide Market Volume K Tons Forecast, by Country 2019 & 2032
- Table 105: China Polyetherimide Market Revenue (Million) Forecast, by Application 2019 & 2032
- Table 106: China Polyetherimide Market Volume (K Tons) Forecast, by Application 2019 & 2032
- Table 107: India Polyetherimide Market Revenue (Million) Forecast, by Application 2019 & 2032
- Table 108: India Polyetherimide Market Volume (K Tons) Forecast, by Application 2019 & 2032
- Table 109: Japan Polyetherimide Market Revenue (Million) Forecast, by Application 2019 & 2032
- Table 110: Japan Polyetherimide Market Volume (K Tons) Forecast, by Application 2019 & 2032
- Table 111: South Korea Polyetherimide Market Revenue (Million) Forecast, by Application 2019 & 2032
- Table 112: South Korea Polyetherimide Market Volume (K Tons) Forecast, by Application 2019 & 2032
- Table 113: Southeast ASia Polyetherimide Market Revenue (Million) Forecast, by Application 2019 & 2032
- Table 114: Southeast ASia Polyetherimide Market Volume (K Tons) Forecast, by Application 2019 & 2032
- Table 115: Australia Polyetherimide Market Revenue (Million) Forecast, by Application 2019 & 2032
- Table 116: Australia Polyetherimide Market Volume (K Tons) Forecast, by Application 2019 & 2032
- Table 117: Rest of Asia Pacific Polyetherimide Market Revenue (Million) Forecast, by Application 2019 & 2032
- Table 118: Rest of Asia Pacific Polyetherimide Market Volume (K Tons) Forecast, by Application 2019 & 2032
- Table 119: Global Polyetherimide Market Revenue Million Forecast, by Grade 2019 & 2032
- Table 120: Global Polyetherimide Market Volume K Tons Forecast, by Grade 2019 & 2032
- Table 121: Global Polyetherimide Market Revenue Million Forecast, by End-User Industry 2019 & 2032
- Table 122: Global Polyetherimide Market Volume K Tons Forecast, by End-User Industry 2019 & 2032
- Table 123: Global Polyetherimide Market Revenue Million Forecast, by Country 2019 & 2032
- Table 124: Global Polyetherimide Market Volume K Tons Forecast, by Country 2019 & 2032
- Table 125: United States Polyetherimide Market Revenue (Million) Forecast, by Application 2019 & 2032
- Table 126: United States Polyetherimide Market Volume (K Tons) Forecast, by Application 2019 & 2032
- Table 127: Canada Polyetherimide Market Revenue (Million) Forecast, by Application 2019 & 2032
- Table 128: Canada Polyetherimide Market Volume (K Tons) Forecast, by Application 2019 & 2032
- Table 129: Mexico Polyetherimide Market Revenue (Million) Forecast, by Application 2019 & 2032
- Table 130: Mexico Polyetherimide Market Volume (K Tons) Forecast, by Application 2019 & 2032
- Table 131: Global Polyetherimide Market Revenue Million Forecast, by Grade 2019 & 2032
- Table 132: Global Polyetherimide Market Volume K Tons Forecast, by Grade 2019 & 2032
- Table 133: Global Polyetherimide Market Revenue Million Forecast, by End-User Industry 2019 & 2032
- Table 134: Global Polyetherimide Market Volume K Tons Forecast, by End-User Industry 2019 & 2032
- Table 135: Global Polyetherimide Market Revenue Million Forecast, by Country 2019 & 2032
- Table 136: Global Polyetherimide Market Volume K Tons Forecast, by Country 2019 & 2032
- Table 137: Germany Polyetherimide Market Revenue (Million) Forecast, by Application 2019 & 2032
- Table 138: Germany Polyetherimide Market Volume (K Tons) Forecast, by Application 2019 & 2032
- Table 139: United Kingdom Polyetherimide Market Revenue (Million) Forecast, by Application 2019 & 2032
- Table 140: United Kingdom Polyetherimide Market Volume (K Tons) Forecast, by Application 2019 & 2032
- Table 141: Italy Polyetherimide Market Revenue (Million) Forecast, by Application 2019 & 2032
- Table 142: Italy Polyetherimide Market Volume (K Tons) Forecast, by Application 2019 & 2032
- Table 143: France Polyetherimide Market Revenue (Million) Forecast, by Application 2019 & 2032
- Table 144: France Polyetherimide Market Volume (K Tons) Forecast, by Application 2019 & 2032
- Table 145: Spain Polyetherimide Market Revenue (Million) Forecast, by Application 2019 & 2032
- Table 146: Spain Polyetherimide Market Volume (K Tons) Forecast, by Application 2019 & 2032
- Table 147: Rest of Europe Polyetherimide Market Revenue (Million) Forecast, by Application 2019 & 2032
- Table 148: Rest of Europe Polyetherimide Market Volume (K Tons) Forecast, by Application 2019 & 2032
- Table 149: Global Polyetherimide Market Revenue Million Forecast, by Grade 2019 & 2032
- Table 150: Global Polyetherimide Market Volume K Tons Forecast, by Grade 2019 & 2032
- Table 151: Global Polyetherimide Market Revenue Million Forecast, by End-User Industry 2019 & 2032
- Table 152: Global Polyetherimide Market Volume K Tons Forecast, by End-User Industry 2019 & 2032
- Table 153: Global Polyetherimide Market Revenue Million Forecast, by Country 2019 & 2032
- Table 154: Global Polyetherimide Market Volume K Tons Forecast, by Country 2019 & 2032
- Table 155: Brazil Polyetherimide Market Revenue (Million) Forecast, by Application 2019 & 2032
- Table 156: Brazil Polyetherimide Market Volume (K Tons) Forecast, by Application 2019 & 2032
- Table 157: Argentina Polyetherimide Market Revenue (Million) Forecast, by Application 2019 & 2032
- Table 158: Argentina Polyetherimide Market Volume (K Tons) Forecast, by Application 2019 & 2032
- Table 159: Colombia Polyetherimide Market Revenue (Million) Forecast, by Application 2019 & 2032
- Table 160: Colombia Polyetherimide Market Volume (K Tons) Forecast, by Application 2019 & 2032
- Table 161: Rest of South America Polyetherimide Market Revenue (Million) Forecast, by Application 2019 & 2032
- Table 162: Rest of South America Polyetherimide Market Volume (K Tons) Forecast, by Application 2019 & 2032
- Table 163: Global Polyetherimide Market Revenue Million Forecast, by Grade 2019 & 2032
- Table 164: Global Polyetherimide Market Volume K Tons Forecast, by Grade 2019 & 2032
- Table 165: Global Polyetherimide Market Revenue Million Forecast, by End-User Industry 2019 & 2032
- Table 166: Global Polyetherimide Market Volume K Tons Forecast, by End-User Industry 2019 & 2032
- Table 167: Global Polyetherimide Market Revenue Million Forecast, by Country 2019 & 2032
- Table 168: Global Polyetherimide Market Volume K Tons Forecast, by Country 2019 & 2032
- Table 169: Saudi Arabia Polyetherimide Market Revenue (Million) Forecast, by Application 2019 & 2032
- Table 170: Saudi Arabia Polyetherimide Market Volume (K Tons) Forecast, by Application 2019 & 2032
- Table 171: South Africa Polyetherimide Market Revenue (Million) Forecast, by Application 2019 & 2032
- Table 172: South Africa Polyetherimide Market Volume (K Tons) Forecast, by Application 2019 & 2032
- Table 173: UAE Polyetherimide Market Revenue (Million) Forecast, by Application 2019 & 2032
- Table 174: UAE Polyetherimide Market Volume (K Tons) Forecast, by Application 2019 & 2032
- Table 175: Rest of Middle East and Africa Polyetherimide Market Revenue (Million) Forecast, by Application 2019 & 2032
- Table 176: Rest of Middle East and Africa Polyetherimide Market Volume (K Tons) Forecast, by Application 2019 & 2032
Frequently Asked Questions
1. What is the projected Compound Annual Growth Rate (CAGR) of the Polyetherimide Market?
The projected CAGR is approximately > 6.50%.
2. Which companies are prominent players in the Polyetherimide Market?
Key companies in the market include Solvay, GEHR, Röchling SE & Co KG, Avient Corporation, Emco Industrial Plastics, SABIC, the Mitsubishi Chemical Group of companies, RTP Company, Kuraray Europe GmbH, Aikolon Oy, Ensinger, Eagle Performance Plastics Inc.
3. What are the main segments of the Polyetherimide Market?
The market segments include Grade, End-User Industry.
4. Can you provide details about the market size?
The market size is estimated to be USD 663.10 Million as of 2022.
5. What are some drivers contributing to market growth?
Increasing Demand from the Transportation Industry; Rapid Growth in the Automotive Sector; Increasing Usage in Healthcare Sector.
6. What are the notable trends driving market growth?
Increasing demand from Electrical & Electronics Industry.
7. Are there any restraints impacting market growth?
High Price When Compared to the Conventional Polymers; Availability of Substitute Materials.
8. Can you provide examples of recent developments in the market?
N/A
9. What pricing options are available for accessing the report?
Pricing options include single-user, multi-user, and enterprise licenses priced at USD 4750, USD 5250, and USD 8750 respectively.
10. Is the market size provided in terms of value or volume?
The market size is provided in terms of value, measured in Million and volume, measured in K Tons.
11. Are there any specific market keywords associated with the report?
Yes, the market keyword associated with the report is "Polyetherimide Market," which aids in identifying and referencing the specific market segment covered.
12. How do I determine which pricing option suits my needs best?
The pricing options vary based on user requirements and access needs. Individual users may opt for single-user licenses, while businesses requiring broader access may choose multi-user or enterprise licenses for cost-effective access to the report.
13. Are there any additional resources or data provided in the Polyetherimide Market report?
While the report offers comprehensive insights, it's advisable to review the specific contents or supplementary materials provided to ascertain if additional resources or data are available.
14. How can I stay updated on further developments or reports in the Polyetherimide Market?
To stay informed about further developments, trends, and reports in the Polyetherimide Market, consider subscribing to industry newsletters, following relevant companies and organizations, or regularly checking reputable industry news sources and publications.
Methodology
Step 1 - Identification of Relevant Samples Size from Population Database


Step 2 - Approaches for Defining Global Market Size (Value, Volume* & Price*)

Note*: In applicable scenarios
Step 3 - Data Sources
Primary Research
- Web Analytics
- Survey Reports
- Research Institute
- Latest Research Reports
- Opinion Leaders
Secondary Research
- Annual Reports
- White Paper
- Latest Press Release
- Industry Association
- Paid Database
- Investor Presentations

Step 4 - Data Triangulation
Involves using different sources of information in order to increase the validity of a study
These sources are likely to be stakeholders in a program - participants, other researchers, program staff, other community members, and so on.
Then we put all data in single framework & apply various statistical tools to find out the dynamic on the market.
During the analysis stage, feedback from the stakeholder groups would be compared to determine areas of agreement as well as areas of divergence


