

Key Insights
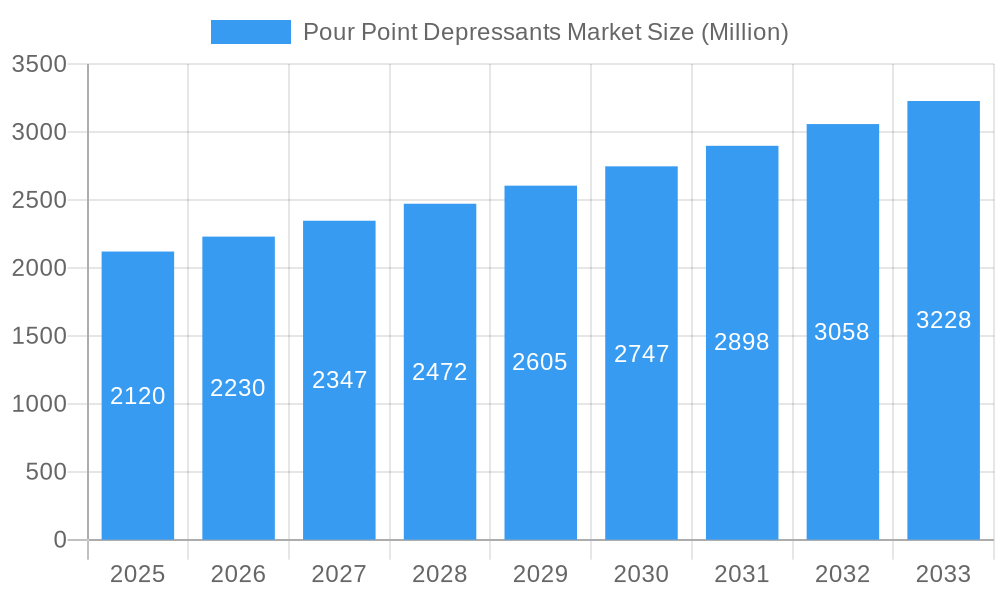
The Pour Point Depressants market, valued at $2.12 billion in 2025, is poised for significant growth between 2025 and 2033. This expansion is driven by several key factors, including the increasing demand for efficient fuel transportation and storage in colder climates, stringent environmental regulations promoting the use of additives that minimize environmental impact, and the growing exploration and production of unconventional oil and gas resources, which often require pour point depressants to maintain fluidity. The historical period (2019-2024) likely witnessed moderate growth, considering the cyclical nature of the energy industry and global economic fluctuations during that time. However, the forecast period (2025-2033) anticipates a stronger CAGR, fueled by technological advancements leading to the development of more effective and environmentally friendly pour point depressants, as well as increasing investments in pipeline infrastructure and Arctic exploration. Competition among existing players and the entry of new market participants are expected to shape the market dynamics over the forecast period, driving innovation and potentially leading to price adjustments. Different geographic regions will experience varied growth rates, with regions heavily reliant on oil and gas production and experiencing harsh winters expected to see higher demand.
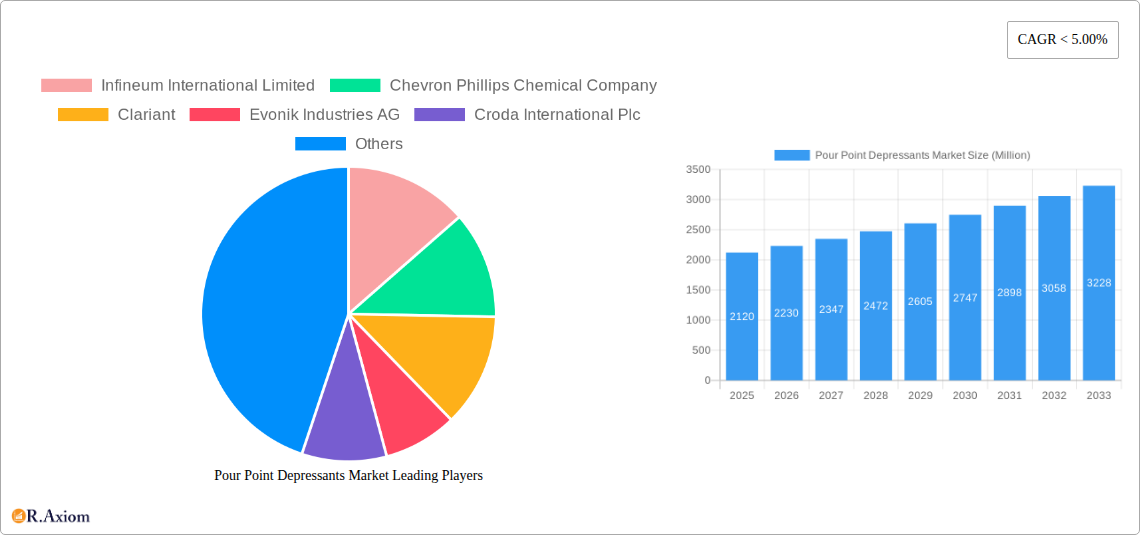
Pour Point Depressants Market Market Size (In Billion)
The market is segmented based on several factors, including the type of pour point depressant (e.g., polymeric, alkylated naphthalene), application (e.g., crude oil, diesel fuel), and geographical distribution. Growth within each segment will vary based on specific market drivers and regional characteristics. For instance, the demand for polymeric pour point depressants, owing to their superior performance and environmental friendliness, is projected to outpace other types. Similarly, regions with substantial crude oil production and extensive pipeline networks will likely experience greater demand than those with limited oil and gas activity. Continuous research and development efforts are focused on improving the effectiveness, cost-efficiency, and environmental profile of pour point depressants, ensuring the market's continued growth and adaptation to evolving industry needs.
Pour Point Depressants Market Company Market Share
This in-depth report provides a comprehensive analysis of the global Pour Point Depressants market, offering valuable insights for industry stakeholders, investors, and strategic decision-makers. The study period covers 2019-2033, with a base year of 2025 and a forecast period of 2025-2033. The report meticulously examines market dynamics, growth drivers, challenges, opportunities, and competitive landscapes, providing actionable intelligence for informed business strategies. The market is segmented by Chemistry Type (Ethylene Co-Vinyl-Acetate, Poly Alpha Olefin, Poly Alkyl Methacrylates (PAMA), Styrene Esters, Others) and End-user Industry (Oil and Gas, Automotive, Industrial, Marine, Aviation). Key players analyzed include Infineum International Limited, Chevron Phillips Chemical Company, Clariant, Evonik Industries AG, Croda International Plc, SANAM Corporation, The Lubrizol Corporation, Thermax-USA, Innospec, and Afton Chemical. The total market size is estimated at xx Million in 2025 and is projected to reach xx Million by 2033.
Pour Point Depressants Market Concentration & Innovation
This section analyzes the market's competitive landscape, including market concentration, innovation drivers, regulatory influences, substitute products, end-user trends, and mergers & acquisitions (M&A) activities. The market is moderately concentrated, with the top five players holding approximately xx% of the market share in 2025. Innovation is driven by the need for improved performance, cost-effectiveness, and environmentally friendly solutions. Stringent environmental regulations are pushing the development of biodegradable and less-toxic pour point depressants. Key M&A activities have focused on expanding product portfolios and geographical reach, with deal values exceeding xx Million in the last five years.
- Market Concentration: Moderately concentrated, with top 5 players holding xx% market share in 2025.
- Innovation Drivers: Demand for enhanced performance, cost reduction, and eco-friendly products.
- Regulatory Frameworks: Stringent environmental regulations driving the development of sustainable pour point depressants.
- Product Substitutes: Limited direct substitutes, but alternative technologies are being explored for specific applications.
- End-User Trends: Increasing demand from the oil and gas, automotive, and industrial sectors.
- M&A Activities: Significant M&A activity observed in recent years, with deal values exceeding xx Million.
Pour Point Depressants Market Industry Trends & Insights
This section delves into the key trends shaping the pour point depressants market. The market is witnessing robust growth, driven by rising demand from various end-use sectors, particularly in emerging economies. Technological advancements, such as the development of novel polymer chemistries and improved additive formulations, are enhancing the performance and efficiency of pour point depressants. Consumer preference for environmentally friendly products is leading to increased adoption of biodegradable and less-toxic alternatives. Competitive dynamics are characterized by intense rivalry among established players and the emergence of new entrants, necessitating continuous innovation and strategic partnerships. The market is expected to exhibit a CAGR of xx% during the forecast period (2025-2033). Market penetration is expected to reach xx% by 2033 in key regions.
Dominant Markets & Segments in Pour Point Depressants Market
This section identifies the leading regions, countries, and market segments. The Oil and Gas sector is the dominant end-user industry, accounting for xx% of the market share in 2025. Among chemistry types, Poly Alpha Olefin (PAO) holds the largest share due to its superior performance characteristics. North America and Europe are currently leading regions, but the Asia-Pacific region is projected to experience significant growth fueled by rapid industrialization and increasing energy demand.
- Key Drivers in Dominant Regions:
- North America: Strong automotive and industrial sectors, robust R&D activities.
- Europe: Stringent environmental regulations driving the adoption of eco-friendly pour point depressants.
- Asia-Pacific: Rapid industrialization and expanding energy sector driving market growth.
- Dominant Segments:
- End-user Industry: Oil & Gas (xx% market share in 2025)
- Chemistry Type: Poly Alpha Olefin (PAO)
Pour Point Depressants Market Product Developments
Recent product innovations focus on enhancing performance attributes, such as improved low-temperature fluidity and extended service life. The emphasis is on developing eco-friendly formulations with reduced environmental impact, including biodegradable and less-toxic options. These advancements provide competitive advantages by improving efficiency, reducing operational costs, and meeting stringent environmental regulations. Technological trends include the use of nanotechnology and advanced polymer chemistry to create highly effective and environmentally sustainable pour point depressants.
Report Scope & Segmentation Analysis
This report segments the Pour Point Depressants market based on Chemistry Type and End-user Industry.
Chemistry Type: Ethylene Co-Vinyl-Acetate, Poly Alpha Olefin, Poly Alkyl Methacrylates (PAMA), Styrene Esters, Others. Each segment's growth projection, market size, and competitive dynamics are analyzed in detail.
End-user Industry: Oil and Gas, Automotive, Industrial, Marine, Aviation. The report provides a detailed analysis of each segment's market size, growth potential, and competitive landscape.
Key Drivers of Pour Point Depressants Market Growth
Growth is primarily driven by the increasing demand from the oil and gas, automotive, and industrial sectors. Stringent environmental regulations are pushing the adoption of eco-friendly alternatives, while technological advancements are improving the efficiency and performance of pour point depressants. The expanding global energy consumption and increasing industrial activity in developing countries are further bolstering market growth.
Challenges in the Pour Point Depressants Market Sector
Challenges include fluctuating crude oil prices, stringent environmental regulations, and intense competition from established and emerging players. Supply chain disruptions and the volatility of raw material prices also pose significant threats to market growth. Meeting stringent regulatory compliance can be costly and complex, impacting profitability.
Emerging Opportunities in Pour Point Depressants Market
Emerging opportunities include the growing demand for sustainable and biodegradable pour point depressants. Technological advancements, such as nanotechnology and advanced polymer chemistries, are opening up new avenues for innovation. The increasing focus on energy efficiency and reduced operational costs is driving the adoption of high-performance pour point depressants. Expansion into emerging markets in Asia-Pacific and Latin America presents significant growth potential.
Leading Players in the Pour Point Depressants Market Market
- Infineum International Limited
- Chevron Phillips Chemical Company
- Clariant
- Evonik Industries AG
- Croda International Plc
- SANAM Corporation
- The Lubrizol Corporation
- Thermax-USA
- Innospec
- Afton Chemical
Key Developments in Pour Point Depressants Market Industry
- 2022: Infineum International Limited launched a new eco-friendly pour point depressant.
- 2023: Chevron Phillips Chemical Company and Clariant announced a collaboration to enhance R&D capabilities in pour point depressant technology.
- 2024: Evonik Industries AG acquired a smaller pour point depressant producer, expanding its market presence. (Further specific examples will be detailed in the full report)
Strategic Outlook for Pour Point Depressants Market Market
The Pour Point Depressants market is poised for continued growth, driven by increasing demand from various end-use sectors and technological innovations. The focus on sustainable and high-performance products, coupled with expansion into new markets, will shape future market dynamics. Companies that effectively leverage technological advancements and adapt to changing regulatory landscapes are expected to gain a competitive edge. The market presents significant opportunities for growth and innovation in the coming years.
Pour Point Depressants Market Segmentation
-
1. Chemistry Type
- 1.1. Ethylene Co-Vinyl-Acetate
- 1.2. Poly Alpha Olefin
- 1.3. Poly Alkyl Methacrylates (PAMA)
- 1.4. Styrene Esters
- 1.5. Others
-
2. End-user Industry
- 2.1. Oil and Gas
- 2.2. Automotive
- 2.3. Industrial
- 2.4. Marine
- 2.5. Aviation
Pour Point Depressants Market Segmentation By Geography
-
1. Asia Pacific
- 1.1. China
- 1.2. India
- 1.3. Japan
- 1.4. South Korea
- 1.5. Rest of Asia Pacific
-
2. North America
- 2.1. United States
- 2.2. Canada
- 2.3. Mexico
-
3. Europe
- 3.1. Germany
- 3.2. United Kingdom
- 3.3. France
- 3.4. Italy
- 3.5. Rest of Europe
-
4. South America
- 4.1. Brazil
- 4.2. Argentina
- 4.3. Rest of South America
-
5. Middle East and Africa
- 5.1. Saudi Arabia
- 5.2. South Africa
- 5.3. Rest of Middle East and Africa
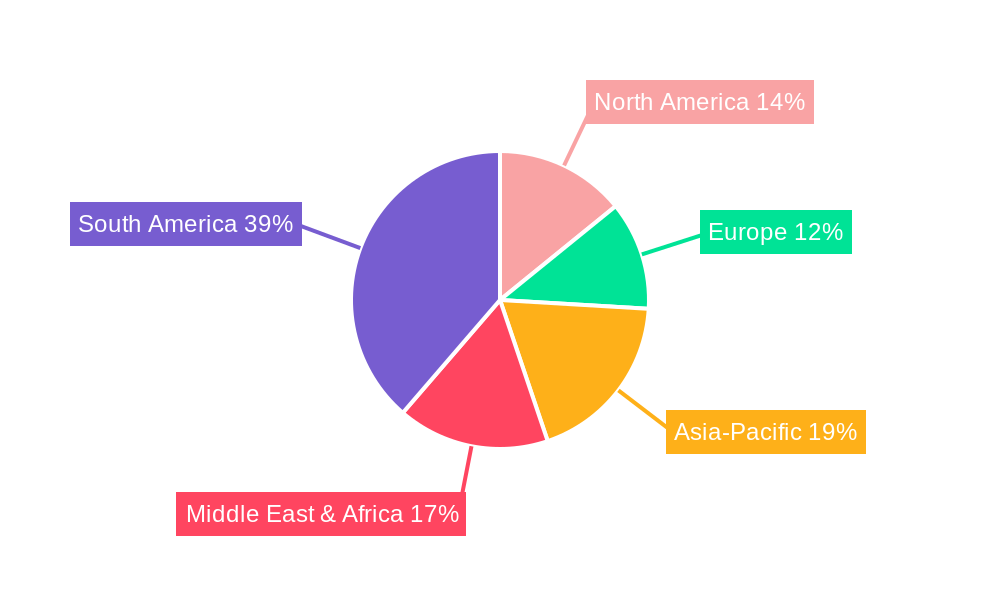
Pour Point Depressants Market Regional Market Share
Geographic Coverage of Pour Point Depressants Market
Pour Point Depressants Market REPORT HIGHLIGHTS
| Aspects | Details |
|---|---|
| Study Period | 2020-2034 |
| Base Year | 2025 |
| Estimated Year | 2026 |
| Forecast Period | 2026-2034 |
| Historical Period | 2020-2025 |
| Growth Rate | CAGR of < 5.00% from 2020-2034 |
| Segmentation |
|
Table of Contents
- 1. Introduction
- 1.1. Research Scope
- 1.2. Market Segmentation
- 1.3. Research Objective
- 1.4. Definitions and Assumptions
- 2. Executive Summary
- 2.1. Market Snapshot
- 3. Market Dynamics
- 3.1. Market Drivers
- 3.2. Market Restrains
- 3.3. Market Trends
- 3.4. Market Opportunities
- 4. Market Factor Analysis
- 4.1. Porters Five Forces
- 4.1.1. Bargaining Power of Suppliers
- 4.1.2. Bargaining Power of Buyers
- 4.1.3. Threat of New Entrants
- 4.1.4. Threat of Substitutes
- 4.1.5. Competitive Rivalry
- 4.2. PESTEL analysis
- 4.3. BCG Analysis
- 4.3.1. Stars (High Growth, High Market Share)
- 4.3.2. Cash Cows (Low Growth, High Market Share)
- 4.3.3. Question Mark (High Growth, Low Market Share)
- 4.3.4. Dogs (Low Growth, Low Market Share)
- 4.4. Ansoff Matrix Analysis
- 4.5. Supply Chain Analysis
- 4.6. Regulatory Landscape
- 4.7. Current Market Potential and Opportunity Assessment (TAM–SAM–SOM Framework)
- 4.8. RAX Analyst Note
- 4.1. Porters Five Forces
- 5. Market Analysis, Insights and Forecast 2021-2033
- 5.1. Market Analysis, Insights and Forecast - by Chemistry Type
- 5.1.1. Ethylene Co-Vinyl-Acetate
- 5.1.2. Poly Alpha Olefin
- 5.1.3. Poly Alkyl Methacrylates (PAMA)
- 5.1.4. Styrene Esters
- 5.1.5. Others
- 5.2. Market Analysis, Insights and Forecast - by End-user Industry
- 5.2.1. Oil and Gas
- 5.2.2. Automotive
- 5.2.3. Industrial
- 5.2.4. Marine
- 5.2.5. Aviation
- 5.3. Market Analysis, Insights and Forecast - by Region
- 5.3.1. Asia Pacific
- 5.3.2. North America
- 5.3.3. Europe
- 5.3.4. South America
- 5.3.5. Middle East and Africa
- 5.1. Market Analysis, Insights and Forecast - by Chemistry Type
- 6. Global Pour Point Depressants Market Analysis, Insights and Forecast, 2021-2033
- 6.1. Market Analysis, Insights and Forecast - by Chemistry Type
- 6.1.1. Ethylene Co-Vinyl-Acetate
- 6.1.2. Poly Alpha Olefin
- 6.1.3. Poly Alkyl Methacrylates (PAMA)
- 6.1.4. Styrene Esters
- 6.1.5. Others
- 6.2. Market Analysis, Insights and Forecast - by End-user Industry
- 6.2.1. Oil and Gas
- 6.2.2. Automotive
- 6.2.3. Industrial
- 6.2.4. Marine
- 6.2.5. Aviation
- 6.1. Market Analysis, Insights and Forecast - by Chemistry Type
- 7. Asia Pacific Pour Point Depressants Market Analysis, Insights and Forecast, 2020-2032
- 7.1. Market Analysis, Insights and Forecast - by Chemistry Type
- 7.1.1. Ethylene Co-Vinyl-Acetate
- 7.1.2. Poly Alpha Olefin
- 7.1.3. Poly Alkyl Methacrylates (PAMA)
- 7.1.4. Styrene Esters
- 7.1.5. Others
- 7.2. Market Analysis, Insights and Forecast - by End-user Industry
- 7.2.1. Oil and Gas
- 7.2.2. Automotive
- 7.2.3. Industrial
- 7.2.4. Marine
- 7.2.5. Aviation
- 7.1. Market Analysis, Insights and Forecast - by Chemistry Type
- 8. North America Pour Point Depressants Market Analysis, Insights and Forecast, 2020-2032
- 8.1. Market Analysis, Insights and Forecast - by Chemistry Type
- 8.1.1. Ethylene Co-Vinyl-Acetate
- 8.1.2. Poly Alpha Olefin
- 8.1.3. Poly Alkyl Methacrylates (PAMA)
- 8.1.4. Styrene Esters
- 8.1.5. Others
- 8.2. Market Analysis, Insights and Forecast - by End-user Industry
- 8.2.1. Oil and Gas
- 8.2.2. Automotive
- 8.2.3. Industrial
- 8.2.4. Marine
- 8.2.5. Aviation
- 8.1. Market Analysis, Insights and Forecast - by Chemistry Type
- 9. Europe Pour Point Depressants Market Analysis, Insights and Forecast, 2020-2032
- 9.1. Market Analysis, Insights and Forecast - by Chemistry Type
- 9.1.1. Ethylene Co-Vinyl-Acetate
- 9.1.2. Poly Alpha Olefin
- 9.1.3. Poly Alkyl Methacrylates (PAMA)
- 9.1.4. Styrene Esters
- 9.1.5. Others
- 9.2. Market Analysis, Insights and Forecast - by End-user Industry
- 9.2.1. Oil and Gas
- 9.2.2. Automotive
- 9.2.3. Industrial
- 9.2.4. Marine
- 9.2.5. Aviation
- 9.1. Market Analysis, Insights and Forecast - by Chemistry Type
- 10. South America Pour Point Depressants Market Analysis, Insights and Forecast, 2020-2032
- 10.1. Market Analysis, Insights and Forecast - by Chemistry Type
- 10.1.1. Ethylene Co-Vinyl-Acetate
- 10.1.2. Poly Alpha Olefin
- 10.1.3. Poly Alkyl Methacrylates (PAMA)
- 10.1.4. Styrene Esters
- 10.1.5. Others
- 10.2. Market Analysis, Insights and Forecast - by End-user Industry
- 10.2.1. Oil and Gas
- 10.2.2. Automotive
- 10.2.3. Industrial
- 10.2.4. Marine
- 10.2.5. Aviation
- 10.1. Market Analysis, Insights and Forecast - by Chemistry Type
- 11. Middle East and Africa Pour Point Depressants Market Analysis, Insights and Forecast, 2020-2032
- 11.1. Market Analysis, Insights and Forecast - by Chemistry Type
- 11.1.1. Ethylene Co-Vinyl-Acetate
- 11.1.2. Poly Alpha Olefin
- 11.1.3. Poly Alkyl Methacrylates (PAMA)
- 11.1.4. Styrene Esters
- 11.1.5. Others
- 11.2. Market Analysis, Insights and Forecast - by End-user Industry
- 11.2.1. Oil and Gas
- 11.2.2. Automotive
- 11.2.3. Industrial
- 11.2.4. Marine
- 11.2.5. Aviation
- 11.1. Market Analysis, Insights and Forecast - by Chemistry Type
- 12. Competitive Analysis
- 12.1. Company Profiles
- 12.1.1 Infineum International Limited
- 12.1.1.1. Company Overview
- 12.1.1.2. Products
- 12.1.1.3. Company Financials
- 12.1.1.4. SWOT Analysis
- 12.1.2 Chevron Phillips Chemical Company
- 12.1.2.1. Company Overview
- 12.1.2.2. Products
- 12.1.2.3. Company Financials
- 12.1.2.4. SWOT Analysis
- 12.1.3 Clariant
- 12.1.3.1. Company Overview
- 12.1.3.2. Products
- 12.1.3.3. Company Financials
- 12.1.3.4. SWOT Analysis
- 12.1.4 Evonik Industries AG
- 12.1.4.1. Company Overview
- 12.1.4.2. Products
- 12.1.4.3. Company Financials
- 12.1.4.4. SWOT Analysis
- 12.1.5 Croda International Plc
- 12.1.5.1. Company Overview
- 12.1.5.2. Products
- 12.1.5.3. Company Financials
- 12.1.5.4. SWOT Analysis
- 12.1.6 SANAM Corporation
- 12.1.6.1. Company Overview
- 12.1.6.2. Products
- 12.1.6.3. Company Financials
- 12.1.6.4. SWOT Analysis
- 12.1.7 The Lubrizol Corporation
- 12.1.7.1. Company Overview
- 12.1.7.2. Products
- 12.1.7.3. Company Financials
- 12.1.7.4. SWOT Analysis
- 12.1.8 Thermax-USA*List Not Exhaustive
- 12.1.8.1. Company Overview
- 12.1.8.2. Products
- 12.1.8.3. Company Financials
- 12.1.8.4. SWOT Analysis
- 12.1.9 Innospec
- 12.1.9.1. Company Overview
- 12.1.9.2. Products
- 12.1.9.3. Company Financials
- 12.1.9.4. SWOT Analysis
- 12.1.10 Afton Chemical
- 12.1.10.1. Company Overview
- 12.1.10.2. Products
- 12.1.10.3. Company Financials
- 12.1.10.4. SWOT Analysis
- 12.1.1 Infineum International Limited
- 12.2. Market Entropy
- 12.2.1 Company's Key Areas Served
- 12.2.2 Recent Developments
- 12.3. Company Market Share Analysis 2025
- 12.3.1 Top 5 Companies Market Share Analysis
- 12.3.2 Top 3 Companies Market Share Analysis
- 12.4. List of Potential Customers
- 13. Research Methodology
List of Figures
- Figure 1: Global Pour Point Depressants Market Revenue Breakdown (Million, %) by Region 2025 & 2033
- Figure 2: Asia Pacific Pour Point Depressants Market Revenue (Million), by Chemistry Type 2025 & 2033
- Figure 3: Asia Pacific Pour Point Depressants Market Revenue Share (%), by Chemistry Type 2025 & 2033
- Figure 4: Asia Pacific Pour Point Depressants Market Revenue (Million), by End-user Industry 2025 & 2033
- Figure 5: Asia Pacific Pour Point Depressants Market Revenue Share (%), by End-user Industry 2025 & 2033
- Figure 6: Asia Pacific Pour Point Depressants Market Revenue (Million), by Country 2025 & 2033
- Figure 7: Asia Pacific Pour Point Depressants Market Revenue Share (%), by Country 2025 & 2033
- Figure 8: North America Pour Point Depressants Market Revenue (Million), by Chemistry Type 2025 & 2033
- Figure 9: North America Pour Point Depressants Market Revenue Share (%), by Chemistry Type 2025 & 2033
- Figure 10: North America Pour Point Depressants Market Revenue (Million), by End-user Industry 2025 & 2033
- Figure 11: North America Pour Point Depressants Market Revenue Share (%), by End-user Industry 2025 & 2033
- Figure 12: North America Pour Point Depressants Market Revenue (Million), by Country 2025 & 2033
- Figure 13: North America Pour Point Depressants Market Revenue Share (%), by Country 2025 & 2033
- Figure 14: Europe Pour Point Depressants Market Revenue (Million), by Chemistry Type 2025 & 2033
- Figure 15: Europe Pour Point Depressants Market Revenue Share (%), by Chemistry Type 2025 & 2033
- Figure 16: Europe Pour Point Depressants Market Revenue (Million), by End-user Industry 2025 & 2033
- Figure 17: Europe Pour Point Depressants Market Revenue Share (%), by End-user Industry 2025 & 2033
- Figure 18: Europe Pour Point Depressants Market Revenue (Million), by Country 2025 & 2033
- Figure 19: Europe Pour Point Depressants Market Revenue Share (%), by Country 2025 & 2033
- Figure 20: South America Pour Point Depressants Market Revenue (Million), by Chemistry Type 2025 & 2033
- Figure 21: South America Pour Point Depressants Market Revenue Share (%), by Chemistry Type 2025 & 2033
- Figure 22: South America Pour Point Depressants Market Revenue (Million), by End-user Industry 2025 & 2033
- Figure 23: South America Pour Point Depressants Market Revenue Share (%), by End-user Industry 2025 & 2033
- Figure 24: South America Pour Point Depressants Market Revenue (Million), by Country 2025 & 2033
- Figure 25: South America Pour Point Depressants Market Revenue Share (%), by Country 2025 & 2033
- Figure 26: Middle East and Africa Pour Point Depressants Market Revenue (Million), by Chemistry Type 2025 & 2033
- Figure 27: Middle East and Africa Pour Point Depressants Market Revenue Share (%), by Chemistry Type 2025 & 2033
- Figure 28: Middle East and Africa Pour Point Depressants Market Revenue (Million), by End-user Industry 2025 & 2033
- Figure 29: Middle East and Africa Pour Point Depressants Market Revenue Share (%), by End-user Industry 2025 & 2033
- Figure 30: Middle East and Africa Pour Point Depressants Market Revenue (Million), by Country 2025 & 2033
- Figure 31: Middle East and Africa Pour Point Depressants Market Revenue Share (%), by Country 2025 & 2033
List of Tables
- Table 1: Global Pour Point Depressants Market Revenue Million Forecast, by Chemistry Type 2020 & 2033
- Table 2: Global Pour Point Depressants Market Revenue Million Forecast, by End-user Industry 2020 & 2033
- Table 3: Global Pour Point Depressants Market Revenue Million Forecast, by Region 2020 & 2033
- Table 4: Global Pour Point Depressants Market Revenue Million Forecast, by Chemistry Type 2020 & 2033
- Table 5: Global Pour Point Depressants Market Revenue Million Forecast, by End-user Industry 2020 & 2033
- Table 6: Global Pour Point Depressants Market Revenue Million Forecast, by Country 2020 & 2033
- Table 7: China Pour Point Depressants Market Revenue (Million) Forecast, by Application 2020 & 2033
- Table 8: India Pour Point Depressants Market Revenue (Million) Forecast, by Application 2020 & 2033
- Table 9: Japan Pour Point Depressants Market Revenue (Million) Forecast, by Application 2020 & 2033
- Table 10: South Korea Pour Point Depressants Market Revenue (Million) Forecast, by Application 2020 & 2033
- Table 11: Rest of Asia Pacific Pour Point Depressants Market Revenue (Million) Forecast, by Application 2020 & 2033
- Table 12: Global Pour Point Depressants Market Revenue Million Forecast, by Chemistry Type 2020 & 2033
- Table 13: Global Pour Point Depressants Market Revenue Million Forecast, by End-user Industry 2020 & 2033
- Table 14: Global Pour Point Depressants Market Revenue Million Forecast, by Country 2020 & 2033
- Table 15: United States Pour Point Depressants Market Revenue (Million) Forecast, by Application 2020 & 2033
- Table 16: Canada Pour Point Depressants Market Revenue (Million) Forecast, by Application 2020 & 2033
- Table 17: Mexico Pour Point Depressants Market Revenue (Million) Forecast, by Application 2020 & 2033
- Table 18: Global Pour Point Depressants Market Revenue Million Forecast, by Chemistry Type 2020 & 2033
- Table 19: Global Pour Point Depressants Market Revenue Million Forecast, by End-user Industry 2020 & 2033
- Table 20: Global Pour Point Depressants Market Revenue Million Forecast, by Country 2020 & 2033
- Table 21: Germany Pour Point Depressants Market Revenue (Million) Forecast, by Application 2020 & 2033
- Table 22: United Kingdom Pour Point Depressants Market Revenue (Million) Forecast, by Application 2020 & 2033
- Table 23: France Pour Point Depressants Market Revenue (Million) Forecast, by Application 2020 & 2033
- Table 24: Italy Pour Point Depressants Market Revenue (Million) Forecast, by Application 2020 & 2033
- Table 25: Rest of Europe Pour Point Depressants Market Revenue (Million) Forecast, by Application 2020 & 2033
- Table 26: Global Pour Point Depressants Market Revenue Million Forecast, by Chemistry Type 2020 & 2033
- Table 27: Global Pour Point Depressants Market Revenue Million Forecast, by End-user Industry 2020 & 2033
- Table 28: Global Pour Point Depressants Market Revenue Million Forecast, by Country 2020 & 2033
- Table 29: Brazil Pour Point Depressants Market Revenue (Million) Forecast, by Application 2020 & 2033
- Table 30: Argentina Pour Point Depressants Market Revenue (Million) Forecast, by Application 2020 & 2033
- Table 31: Rest of South America Pour Point Depressants Market Revenue (Million) Forecast, by Application 2020 & 2033
- Table 32: Global Pour Point Depressants Market Revenue Million Forecast, by Chemistry Type 2020 & 2033
- Table 33: Global Pour Point Depressants Market Revenue Million Forecast, by End-user Industry 2020 & 2033
- Table 34: Global Pour Point Depressants Market Revenue Million Forecast, by Country 2020 & 2033
- Table 35: Saudi Arabia Pour Point Depressants Market Revenue (Million) Forecast, by Application 2020 & 2033
- Table 36: South Africa Pour Point Depressants Market Revenue (Million) Forecast, by Application 2020 & 2033
- Table 37: Rest of Middle East and Africa Pour Point Depressants Market Revenue (Million) Forecast, by Application 2020 & 2033
Frequently Asked Questions
1. What is the projected Compound Annual Growth Rate (CAGR) of the Pour Point Depressants Market?
The projected CAGR is approximately < 5.00%.
2. Which companies are prominent players in the Pour Point Depressants Market?
Key companies in the market include Infineum International Limited, Chevron Phillips Chemical Company, Clariant, Evonik Industries AG, Croda International Plc, SANAM Corporation, The Lubrizol Corporation, Thermax-USA*List Not Exhaustive, Innospec, Afton Chemical.
3. What are the main segments of the Pour Point Depressants Market?
The market segments include Chemistry Type, End-user Industry.
4. Can you provide details about the market size?
The market size is estimated to be USD 2120 Million as of 2022.
5. What are some drivers contributing to market growth?
; Growing Demand for High Quality Fuels and Lubricants; Increasing Industrialization.
6. What are the notable trends driving market growth?
Growing Demand for High Quality Fuels and Lubricants.
7. Are there any restraints impacting market growth?
; Unfavorable Conditions Arising Due to COVID-19 Outbreak.
8. Can you provide examples of recent developments in the market?
Recent developments in the sector include the launch of new, eco-friendly pour point depressants by key players, collaborations to enhance research and development capabilities, and strategic acquisitions to expand market presence.
9. What pricing options are available for accessing the report?
Pricing options include single-user, multi-user, and enterprise licenses priced at USD 4750, USD 5250, and USD 8750 respectively.
10. Is the market size provided in terms of value or volume?
The market size is provided in terms of value, measured in Million.
11. Are there any specific market keywords associated with the report?
Yes, the market keyword associated with the report is "Pour Point Depressants Market," which aids in identifying and referencing the specific market segment covered.
12. How do I determine which pricing option suits my needs best?
The pricing options vary based on user requirements and access needs. Individual users may opt for single-user licenses, while businesses requiring broader access may choose multi-user or enterprise licenses for cost-effective access to the report.
13. Are there any additional resources or data provided in the Pour Point Depressants Market report?
While the report offers comprehensive insights, it's advisable to review the specific contents or supplementary materials provided to ascertain if additional resources or data are available.
14. How can I stay updated on further developments or reports in the Pour Point Depressants Market?
To stay informed about further developments, trends, and reports in the Pour Point Depressants Market, consider subscribing to industry newsletters, following relevant companies and organizations, or regularly checking reputable industry news sources and publications.
Methodology
Step 1 - Identification of Relevant Samples Size from Population Database


Step 2 - Approaches for Defining Global Market Size (Value, Volume* & Price*)

Note*: In applicable scenarios
Step 3 - Data Sources
Primary Research
- Web Analytics
- Survey Reports
- Research Institute
- Latest Research Reports
- Opinion Leaders
Secondary Research
- Annual Reports
- White Paper
- Latest Press Release
- Industry Association
- Paid Database
- Investor Presentations

Step 4 - Data Triangulation
Involves using different sources of information in order to increase the validity of a study
These sources are likely to be stakeholders in a program - participants, other researchers, program staff, other community members, and so on.
Then we put all data in single framework & apply various statistical tools to find out the dynamic on the market.
During the analysis stage, feedback from the stakeholder groups would be compared to determine areas of agreement as well as areas of divergence