

Key Insights
The global power tools market, leveraging powder metallurgy (PM) components, is experiencing significant expansion. This growth is propelled by the escalating demand for lightweight, high-strength, and cost-effective tools across construction, automotive, and manufacturing sectors. Advancements in PM technology facilitate the production of complex geometries and intricate designs, yielding superior performance compared to conventional methods, thus enhancing tool durability, efficiency, and reducing energy consumption. Key trends include the adoption of advanced PM materials like metal matrix composites and the integration of smart technologies for enhanced precision and automation. While raw material price volatility and specialized manufacturing expertise present potential challenges, the market outlook remains highly positive, projecting substantial value growth over the next decade. Leading companies are committed to R&D to refine their PM part offerings and meet evolving industry needs, further fueling market expansion driven by consumer preference for high-performance tools.
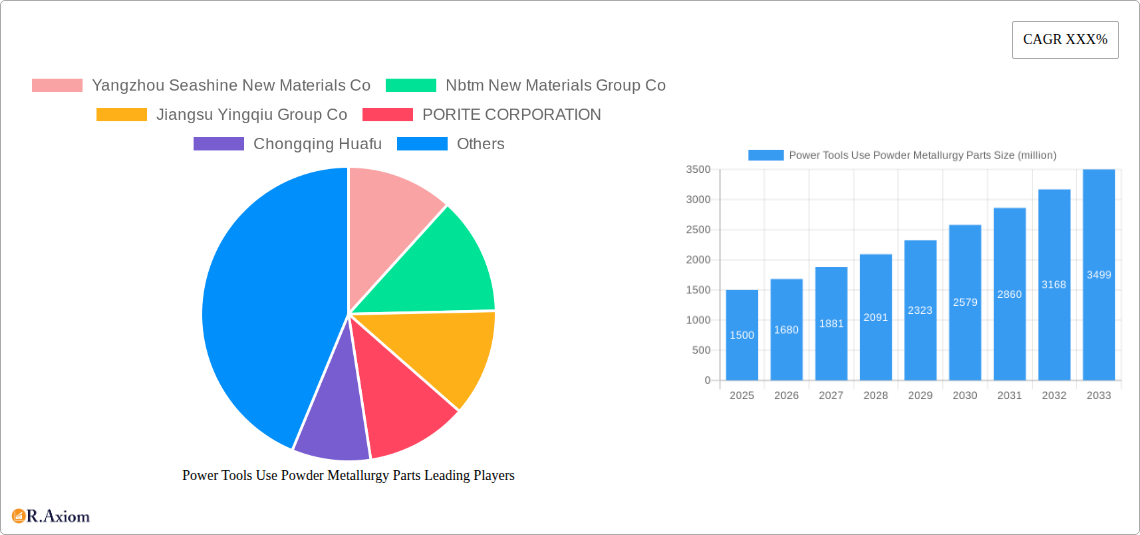
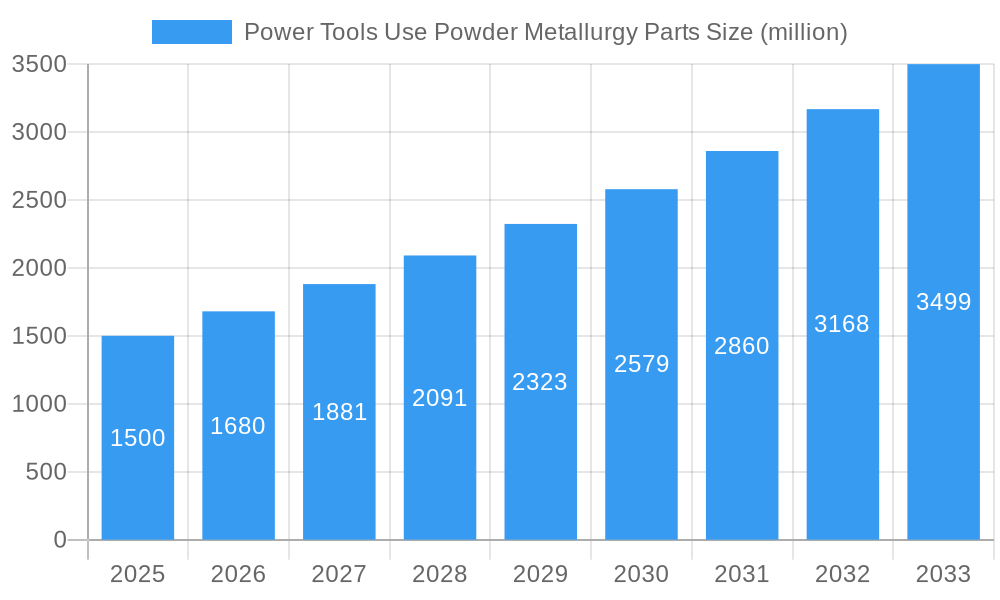
Power Tools Use Powder Metallurgy Parts Market Size (In Billion)
Market segmentation highlights robust growth in cordless and electric power tools, where PM parts offer substantial advantages in weight reduction and battery life. Developing economies are demonstrating strong growth due to expanding infrastructure and increasing industrial activity, while North America and Europe remain pivotal markets due to established industry players and technological leadership. The forecast period (2025-2033) anticipates considerable market expansion driven by sustained innovation and widespread adoption. The market is projected to reach a size of $2.84 billion by 2025, with a projected Compound Annual Growth Rate (CAGR) of 8.62%. Continued development in PM materials and manufacturing processes will be critical in shaping the future market landscape.
Power Tools Use Powder Metallurgy Parts Company Market Share
This report offers a comprehensive analysis of the global Power Tools Use Powder Metallurgy Parts market, providing critical insights into its dynamics and future trajectory. It covers the period from 2019 to 2033, with a specific focus on the forecast period of 2025-2033, using 2025 as the base year. The market size is estimated in billions across all segments and regions.
Power Tools Use Powder Metallurgy Parts Market Concentration & Innovation
This section analyzes the competitive landscape, focusing on market concentration, innovation drivers, regulatory changes, product substitution, end-user trends, and mergers and acquisitions (M&A) activities. The market is moderately concentrated, with the top 5 players holding approximately xx% of the market share in 2025. Innovation is driven by the need for lighter, stronger, and more cost-effective parts in power tools. Stringent safety regulations are shaping product design and manufacturing processes. The increasing adoption of electric power tools is driving demand for specialized powder metallurgy parts. M&A activity has been relatively low in recent years, with a total deal value of approximately $xx million recorded during the historical period (2019-2024).
- Market Share Concentration: Top 5 players hold approximately xx% of market share (2025).
- M&A Deal Value (2019-2024): Approximately $xx million.
- Key Innovation Drivers: Lightweighting, strength enhancement, cost reduction, electric power tool adoption.
- Regulatory Influences: Safety standards, material compliance.
Power Tools Use Powder Metallurgy Parts Industry Trends & Insights
This section delves into market growth drivers, technological disruptions, consumer preferences, and competitive dynamics. The global power tools use powder metallurgy parts market is projected to experience a Compound Annual Growth Rate (CAGR) of xx% during the forecast period (2025-2033). This growth is primarily fueled by increasing demand for portable and cordless power tools, advancements in powder metallurgy technologies enabling the production of high-performance parts, and the rising adoption of electric vehicles. Market penetration in emerging economies is expected to increase significantly, driven by rising disposable incomes and infrastructural development. Competitive dynamics are characterized by intense rivalry among established players and the emergence of new entrants offering innovative products and services.
Dominant Markets & Segments in Power Tools Use Powder Metallurgy Parts
This section identifies leading regions, countries, and segments. The xx region is currently the dominant market, accounting for approximately xx% of the global market in 2025. This dominance is attributed to factors such as:
- Strong Industrial Base: A well-established manufacturing sector drives high demand for power tools and their components.
- Favorable Government Policies: Supportive economic policies and infrastructure investments promote growth.
- High Consumer Spending: A large consumer base with high disposable income fuels demand for power tools.
The market is further segmented by material type (e.g., steel, iron, copper), tool type (e.g., drills, saws, grinders), and end-use industry (e.g., construction, automotive). Each segment presents unique growth opportunities and competitive dynamics. Further granular detail is provided within the full report.
Power Tools Use Powder Metallurgy Parts Product Developments
Recent product innovations focus on enhancing part performance, durability, and cost-effectiveness. Advances in material science and manufacturing processes are enabling the production of parts with improved strength-to-weight ratios, higher precision, and superior wear resistance. These developments are expanding the applications of powder metallurgy parts in power tools, leading to a wider range of products and greater market penetration.
Report Scope & Segmentation Analysis
The report provides a comprehensive analysis of various segments within the power tools use powder metallurgy parts market. These include segmentations by material type, tool type, and geographic region. Each segment is analyzed based on market size, growth projections, and competitive dynamics. Detailed growth projections for each segment are available within the complete report.
Key Drivers of Power Tools Use Powder Metallurgy Parts Growth
The growth of the power tools use powder metallurgy parts market is driven by several factors, including:
- Technological Advancements: Innovations in powder metallurgy technologies allow for the creation of more complex, high-performance parts.
- Increased Demand for Electric Power Tools: The growing preference for cordless and electric power tools is boosting market growth.
- Rising Disposable Incomes: Increased purchasing power in developing economies is driving demand.
Challenges in the Power Tools Use Powder Metallurgy Parts Sector
Challenges faced by the industry include:
- Fluctuating Raw Material Prices: Volatility in the prices of key raw materials can impact profitability.
- Supply Chain Disruptions: Global supply chain issues can impact the availability of components.
- Intense Competition: The market is highly competitive, with numerous players vying for market share.
Emerging Opportunities in Power Tools Use Powder Metallurgy Parts
Emerging opportunities lie in:
- Development of New Materials: Exploring advanced materials with enhanced properties.
- Expansion into New Markets: Targeting untapped markets in developing economies.
- Additive Manufacturing: Integration of 3D printing technologies.
Leading Players in the Power Tools Use Powder Metallurgy Parts Market
- Yangzhou Seashine New Materials Co
- Nbtm New Materials Group Co
- Jiangsu Yingqiu Group Co
- PORITE CORPORATION
- Chongqing Huafu
- Yangzhou LEADER Powder Metallurgy Co
- Chongqing Juneng Powder Metallurgy Co
- Hengteli Metal Products Co
- Zhejiang Xinhe Powder Metallurgy Products Co
- MXIN
- Hualian Powder Metallurgy
- Shanghai Jiasheng Powder
- Anhui Hengjun Powder Metallurgy Technology Co
Key Developments in Power Tools Use Powder Metallurgy Parts Industry
- 2022 Q4: Yangzhou Seashine New Materials Co announced a major investment in its powder metallurgy production facility.
- 2023 Q1: A significant merger between two key players resulted in a more concentrated market. (Further details within the full report).
Strategic Outlook for Power Tools Use Powder Metallurgy Parts Market
The future of the power tools use powder metallurgy parts market is promising. Continued technological advancements, expanding applications, and increased demand from various end-use industries are poised to drive substantial growth. Strategic partnerships and investments in R&D are crucial for companies to maintain their competitiveness and capitalize on emerging opportunities. The market is expected to reach $xx million by 2033.
Power Tools Use Powder Metallurgy Parts Segmentation
-
1. Application
- 1.1. Electric Drill
- 1.2. Electric Hammer
- 1.3. Electric Saw
- 1.4. Electric Planer
- 1.5. Angle Grinder
- 1.6. Cutter
- 1.7. Other
-
2. Type
- 2.1. PM
- 2.2. MIM
Power Tools Use Powder Metallurgy Parts Segmentation By Geography
-
1. North America
- 1.1. United States
- 1.2. Canada
- 1.3. Mexico
-
2. South America
- 2.1. Brazil
- 2.2. Argentina
- 2.3. Rest of South America
-
3. Europe
- 3.1. United Kingdom
- 3.2. Germany
- 3.3. France
- 3.4. Italy
- 3.5. Spain
- 3.6. Russia
- 3.7. Benelux
- 3.8. Nordics
- 3.9. Rest of Europe
-
4. Middle East & Africa
- 4.1. Turkey
- 4.2. Israel
- 4.3. GCC
- 4.4. North Africa
- 4.5. South Africa
- 4.6. Rest of Middle East & Africa
-
5. Asia Pacific
- 5.1. China
- 5.2. India
- 5.3. Japan
- 5.4. South Korea
- 5.5. ASEAN
- 5.6. Oceania
- 5.7. Rest of Asia Pacific

Power Tools Use Powder Metallurgy Parts Regional Market Share
Geographic Coverage of Power Tools Use Powder Metallurgy Parts
Power Tools Use Powder Metallurgy Parts REPORT HIGHLIGHTS
| Aspects | Details |
|---|---|
| Study Period | 2020-2034 |
| Base Year | 2025 |
| Estimated Year | 2026 |
| Forecast Period | 2026-2034 |
| Historical Period | 2020-2025 |
| Growth Rate | CAGR of 8.62% from 2020-2034 |
| Segmentation |
|
Table of Contents
- 1. Introduction
- 1.1. Research Scope
- 1.2. Market Segmentation
- 1.3. Research Objective
- 1.4. Definitions and Assumptions
- 2. Executive Summary
- 2.1. Market Snapshot
- 3. Market Dynamics
- 3.1. Market Drivers
- 3.2. Market Restrains
- 3.3. Market Trends
- 3.4. Market Opportunities
- 4. Market Factor Analysis
- 4.1. Porters Five Forces
- 4.1.1. Bargaining Power of Suppliers
- 4.1.2. Bargaining Power of Buyers
- 4.1.3. Threat of New Entrants
- 4.1.4. Threat of Substitutes
- 4.1.5. Competitive Rivalry
- 4.2. PESTEL analysis
- 4.3. BCG Analysis
- 4.3.1. Stars (High Growth, High Market Share)
- 4.3.2. Cash Cows (Low Growth, High Market Share)
- 4.3.3. Question Mark (High Growth, Low Market Share)
- 4.3.4. Dogs (Low Growth, Low Market Share)
- 4.4. Ansoff Matrix Analysis
- 4.5. Supply Chain Analysis
- 4.6. Regulatory Landscape
- 4.7. Current Market Potential and Opportunity Assessment (TAM–SAM–SOM Framework)
- 4.8. RAX Analyst Note
- 4.1. Porters Five Forces
- 5. Market Analysis, Insights and Forecast 2021-2033
- 5.1. Market Analysis, Insights and Forecast - by Application
- 5.1.1. Electric Drill
- 5.1.2. Electric Hammer
- 5.1.3. Electric Saw
- 5.1.4. Electric Planer
- 5.1.5. Angle Grinder
- 5.1.6. Cutter
- 5.1.7. Other
- 5.2. Market Analysis, Insights and Forecast - by Type
- 5.2.1. PM
- 5.2.2. MIM
- 5.3. Market Analysis, Insights and Forecast - by Region
- 5.3.1. North America
- 5.3.2. South America
- 5.3.3. Europe
- 5.3.4. Middle East & Africa
- 5.3.5. Asia Pacific
- 5.1. Market Analysis, Insights and Forecast - by Application
- 6. Global Power Tools Use Powder Metallurgy Parts Analysis, Insights and Forecast, 2021-2033
- 6.1. Market Analysis, Insights and Forecast - by Application
- 6.1.1. Electric Drill
- 6.1.2. Electric Hammer
- 6.1.3. Electric Saw
- 6.1.4. Electric Planer
- 6.1.5. Angle Grinder
- 6.1.6. Cutter
- 6.1.7. Other
- 6.2. Market Analysis, Insights and Forecast - by Type
- 6.2.1. PM
- 6.2.2. MIM
- 6.1. Market Analysis, Insights and Forecast - by Application
- 7. North America Power Tools Use Powder Metallurgy Parts Analysis, Insights and Forecast, 2020-2032
- 7.1. Market Analysis, Insights and Forecast - by Application
- 7.1.1. Electric Drill
- 7.1.2. Electric Hammer
- 7.1.3. Electric Saw
- 7.1.4. Electric Planer
- 7.1.5. Angle Grinder
- 7.1.6. Cutter
- 7.1.7. Other
- 7.2. Market Analysis, Insights and Forecast - by Type
- 7.2.1. PM
- 7.2.2. MIM
- 7.1. Market Analysis, Insights and Forecast - by Application
- 8. South America Power Tools Use Powder Metallurgy Parts Analysis, Insights and Forecast, 2020-2032
- 8.1. Market Analysis, Insights and Forecast - by Application
- 8.1.1. Electric Drill
- 8.1.2. Electric Hammer
- 8.1.3. Electric Saw
- 8.1.4. Electric Planer
- 8.1.5. Angle Grinder
- 8.1.6. Cutter
- 8.1.7. Other
- 8.2. Market Analysis, Insights and Forecast - by Type
- 8.2.1. PM
- 8.2.2. MIM
- 8.1. Market Analysis, Insights and Forecast - by Application
- 9. Europe Power Tools Use Powder Metallurgy Parts Analysis, Insights and Forecast, 2020-2032
- 9.1. Market Analysis, Insights and Forecast - by Application
- 9.1.1. Electric Drill
- 9.1.2. Electric Hammer
- 9.1.3. Electric Saw
- 9.1.4. Electric Planer
- 9.1.5. Angle Grinder
- 9.1.6. Cutter
- 9.1.7. Other
- 9.2. Market Analysis, Insights and Forecast - by Type
- 9.2.1. PM
- 9.2.2. MIM
- 9.1. Market Analysis, Insights and Forecast - by Application
- 10. Middle East & Africa Power Tools Use Powder Metallurgy Parts Analysis, Insights and Forecast, 2020-2032
- 10.1. Market Analysis, Insights and Forecast - by Application
- 10.1.1. Electric Drill
- 10.1.2. Electric Hammer
- 10.1.3. Electric Saw
- 10.1.4. Electric Planer
- 10.1.5. Angle Grinder
- 10.1.6. Cutter
- 10.1.7. Other
- 10.2. Market Analysis, Insights and Forecast - by Type
- 10.2.1. PM
- 10.2.2. MIM
- 10.1. Market Analysis, Insights and Forecast - by Application
- 11. Asia Pacific Power Tools Use Powder Metallurgy Parts Analysis, Insights and Forecast, 2020-2032
- 11.1. Market Analysis, Insights and Forecast - by Application
- 11.1.1. Electric Drill
- 11.1.2. Electric Hammer
- 11.1.3. Electric Saw
- 11.1.4. Electric Planer
- 11.1.5. Angle Grinder
- 11.1.6. Cutter
- 11.1.7. Other
- 11.2. Market Analysis, Insights and Forecast - by Type
- 11.2.1. PM
- 11.2.2. MIM
- 11.1. Market Analysis, Insights and Forecast - by Application
- 12. Competitive Analysis
- 12.1. Company Profiles
- 12.1.1 Yangzhou Seashine New Materials Co
- 12.1.1.1. Company Overview
- 12.1.1.2. Products
- 12.1.1.3. Company Financials
- 12.1.1.4. SWOT Analysis
- 12.1.2 Nbtm New Materials Group Co
- 12.1.2.1. Company Overview
- 12.1.2.2. Products
- 12.1.2.3. Company Financials
- 12.1.2.4. SWOT Analysis
- 12.1.3 Jiangsu Yingqiu Group Co
- 12.1.3.1. Company Overview
- 12.1.3.2. Products
- 12.1.3.3. Company Financials
- 12.1.3.4. SWOT Analysis
- 12.1.4 PORITE CORPORATION
- 12.1.4.1. Company Overview
- 12.1.4.2. Products
- 12.1.4.3. Company Financials
- 12.1.4.4. SWOT Analysis
- 12.1.5 Chongqing Huafu
- 12.1.5.1. Company Overview
- 12.1.5.2. Products
- 12.1.5.3. Company Financials
- 12.1.5.4. SWOT Analysis
- 12.1.6 Yangzhou LEADER Powder Metallurgy Co
- 12.1.6.1. Company Overview
- 12.1.6.2. Products
- 12.1.6.3. Company Financials
- 12.1.6.4. SWOT Analysis
- 12.1.7 Chongqing Juneng Powder Metallurgy Co
- 12.1.7.1. Company Overview
- 12.1.7.2. Products
- 12.1.7.3. Company Financials
- 12.1.7.4. SWOT Analysis
- 12.1.8 Hengteli Metal Products Co
- 12.1.8.1. Company Overview
- 12.1.8.2. Products
- 12.1.8.3. Company Financials
- 12.1.8.4. SWOT Analysis
- 12.1.9 Zhejiang Xinhe Powder Metallurgy Products Co
- 12.1.9.1. Company Overview
- 12.1.9.2. Products
- 12.1.9.3. Company Financials
- 12.1.9.4. SWOT Analysis
- 12.1.10 MXIN
- 12.1.10.1. Company Overview
- 12.1.10.2. Products
- 12.1.10.3. Company Financials
- 12.1.10.4. SWOT Analysis
- 12.1.11 Hualian Powder Metallurgy
- 12.1.11.1. Company Overview
- 12.1.11.2. Products
- 12.1.11.3. Company Financials
- 12.1.11.4. SWOT Analysis
- 12.1.12 Shanghai Jiasheng Powder
- 12.1.12.1. Company Overview
- 12.1.12.2. Products
- 12.1.12.3. Company Financials
- 12.1.12.4. SWOT Analysis
- 12.1.13 Anhui Hengjun Powder Metallurgy Technology Co
- 12.1.13.1. Company Overview
- 12.1.13.2. Products
- 12.1.13.3. Company Financials
- 12.1.13.4. SWOT Analysis
- 12.1.1 Yangzhou Seashine New Materials Co
- 12.2. Market Entropy
- 12.2.1 Company's Key Areas Served
- 12.2.2 Recent Developments
- 12.3. Company Market Share Analysis 2025
- 12.3.1 Top 5 Companies Market Share Analysis
- 12.3.2 Top 3 Companies Market Share Analysis
- 12.4. List of Potential Customers
- 13. Research Methodology
List of Figures
- Figure 1: Global Power Tools Use Powder Metallurgy Parts Revenue Breakdown (billion, %) by Region 2025 & 2033
- Figure 2: North America Power Tools Use Powder Metallurgy Parts Revenue (billion), by Application 2025 & 2033
- Figure 3: North America Power Tools Use Powder Metallurgy Parts Revenue Share (%), by Application 2025 & 2033
- Figure 4: North America Power Tools Use Powder Metallurgy Parts Revenue (billion), by Type 2025 & 2033
- Figure 5: North America Power Tools Use Powder Metallurgy Parts Revenue Share (%), by Type 2025 & 2033
- Figure 6: North America Power Tools Use Powder Metallurgy Parts Revenue (billion), by Country 2025 & 2033
- Figure 7: North America Power Tools Use Powder Metallurgy Parts Revenue Share (%), by Country 2025 & 2033
- Figure 8: South America Power Tools Use Powder Metallurgy Parts Revenue (billion), by Application 2025 & 2033
- Figure 9: South America Power Tools Use Powder Metallurgy Parts Revenue Share (%), by Application 2025 & 2033
- Figure 10: South America Power Tools Use Powder Metallurgy Parts Revenue (billion), by Type 2025 & 2033
- Figure 11: South America Power Tools Use Powder Metallurgy Parts Revenue Share (%), by Type 2025 & 2033
- Figure 12: South America Power Tools Use Powder Metallurgy Parts Revenue (billion), by Country 2025 & 2033
- Figure 13: South America Power Tools Use Powder Metallurgy Parts Revenue Share (%), by Country 2025 & 2033
- Figure 14: Europe Power Tools Use Powder Metallurgy Parts Revenue (billion), by Application 2025 & 2033
- Figure 15: Europe Power Tools Use Powder Metallurgy Parts Revenue Share (%), by Application 2025 & 2033
- Figure 16: Europe Power Tools Use Powder Metallurgy Parts Revenue (billion), by Type 2025 & 2033
- Figure 17: Europe Power Tools Use Powder Metallurgy Parts Revenue Share (%), by Type 2025 & 2033
- Figure 18: Europe Power Tools Use Powder Metallurgy Parts Revenue (billion), by Country 2025 & 2033
- Figure 19: Europe Power Tools Use Powder Metallurgy Parts Revenue Share (%), by Country 2025 & 2033
- Figure 20: Middle East & Africa Power Tools Use Powder Metallurgy Parts Revenue (billion), by Application 2025 & 2033
- Figure 21: Middle East & Africa Power Tools Use Powder Metallurgy Parts Revenue Share (%), by Application 2025 & 2033
- Figure 22: Middle East & Africa Power Tools Use Powder Metallurgy Parts Revenue (billion), by Type 2025 & 2033
- Figure 23: Middle East & Africa Power Tools Use Powder Metallurgy Parts Revenue Share (%), by Type 2025 & 2033
- Figure 24: Middle East & Africa Power Tools Use Powder Metallurgy Parts Revenue (billion), by Country 2025 & 2033
- Figure 25: Middle East & Africa Power Tools Use Powder Metallurgy Parts Revenue Share (%), by Country 2025 & 2033
- Figure 26: Asia Pacific Power Tools Use Powder Metallurgy Parts Revenue (billion), by Application 2025 & 2033
- Figure 27: Asia Pacific Power Tools Use Powder Metallurgy Parts Revenue Share (%), by Application 2025 & 2033
- Figure 28: Asia Pacific Power Tools Use Powder Metallurgy Parts Revenue (billion), by Type 2025 & 2033
- Figure 29: Asia Pacific Power Tools Use Powder Metallurgy Parts Revenue Share (%), by Type 2025 & 2033
- Figure 30: Asia Pacific Power Tools Use Powder Metallurgy Parts Revenue (billion), by Country 2025 & 2033
- Figure 31: Asia Pacific Power Tools Use Powder Metallurgy Parts Revenue Share (%), by Country 2025 & 2033
List of Tables
- Table 1: Global Power Tools Use Powder Metallurgy Parts Revenue billion Forecast, by Application 2020 & 2033
- Table 2: Global Power Tools Use Powder Metallurgy Parts Revenue billion Forecast, by Type 2020 & 2033
- Table 3: Global Power Tools Use Powder Metallurgy Parts Revenue billion Forecast, by Region 2020 & 2033
- Table 4: Global Power Tools Use Powder Metallurgy Parts Revenue billion Forecast, by Application 2020 & 2033
- Table 5: Global Power Tools Use Powder Metallurgy Parts Revenue billion Forecast, by Type 2020 & 2033
- Table 6: Global Power Tools Use Powder Metallurgy Parts Revenue billion Forecast, by Country 2020 & 2033
- Table 7: United States Power Tools Use Powder Metallurgy Parts Revenue (billion) Forecast, by Application 2020 & 2033
- Table 8: Canada Power Tools Use Powder Metallurgy Parts Revenue (billion) Forecast, by Application 2020 & 2033
- Table 9: Mexico Power Tools Use Powder Metallurgy Parts Revenue (billion) Forecast, by Application 2020 & 2033
- Table 10: Global Power Tools Use Powder Metallurgy Parts Revenue billion Forecast, by Application 2020 & 2033
- Table 11: Global Power Tools Use Powder Metallurgy Parts Revenue billion Forecast, by Type 2020 & 2033
- Table 12: Global Power Tools Use Powder Metallurgy Parts Revenue billion Forecast, by Country 2020 & 2033
- Table 13: Brazil Power Tools Use Powder Metallurgy Parts Revenue (billion) Forecast, by Application 2020 & 2033
- Table 14: Argentina Power Tools Use Powder Metallurgy Parts Revenue (billion) Forecast, by Application 2020 & 2033
- Table 15: Rest of South America Power Tools Use Powder Metallurgy Parts Revenue (billion) Forecast, by Application 2020 & 2033
- Table 16: Global Power Tools Use Powder Metallurgy Parts Revenue billion Forecast, by Application 2020 & 2033
- Table 17: Global Power Tools Use Powder Metallurgy Parts Revenue billion Forecast, by Type 2020 & 2033
- Table 18: Global Power Tools Use Powder Metallurgy Parts Revenue billion Forecast, by Country 2020 & 2033
- Table 19: United Kingdom Power Tools Use Powder Metallurgy Parts Revenue (billion) Forecast, by Application 2020 & 2033
- Table 20: Germany Power Tools Use Powder Metallurgy Parts Revenue (billion) Forecast, by Application 2020 & 2033
- Table 21: France Power Tools Use Powder Metallurgy Parts Revenue (billion) Forecast, by Application 2020 & 2033
- Table 22: Italy Power Tools Use Powder Metallurgy Parts Revenue (billion) Forecast, by Application 2020 & 2033
- Table 23: Spain Power Tools Use Powder Metallurgy Parts Revenue (billion) Forecast, by Application 2020 & 2033
- Table 24: Russia Power Tools Use Powder Metallurgy Parts Revenue (billion) Forecast, by Application 2020 & 2033
- Table 25: Benelux Power Tools Use Powder Metallurgy Parts Revenue (billion) Forecast, by Application 2020 & 2033
- Table 26: Nordics Power Tools Use Powder Metallurgy Parts Revenue (billion) Forecast, by Application 2020 & 2033
- Table 27: Rest of Europe Power Tools Use Powder Metallurgy Parts Revenue (billion) Forecast, by Application 2020 & 2033
- Table 28: Global Power Tools Use Powder Metallurgy Parts Revenue billion Forecast, by Application 2020 & 2033
- Table 29: Global Power Tools Use Powder Metallurgy Parts Revenue billion Forecast, by Type 2020 & 2033
- Table 30: Global Power Tools Use Powder Metallurgy Parts Revenue billion Forecast, by Country 2020 & 2033
- Table 31: Turkey Power Tools Use Powder Metallurgy Parts Revenue (billion) Forecast, by Application 2020 & 2033
- Table 32: Israel Power Tools Use Powder Metallurgy Parts Revenue (billion) Forecast, by Application 2020 & 2033
- Table 33: GCC Power Tools Use Powder Metallurgy Parts Revenue (billion) Forecast, by Application 2020 & 2033
- Table 34: North Africa Power Tools Use Powder Metallurgy Parts Revenue (billion) Forecast, by Application 2020 & 2033
- Table 35: South Africa Power Tools Use Powder Metallurgy Parts Revenue (billion) Forecast, by Application 2020 & 2033
- Table 36: Rest of Middle East & Africa Power Tools Use Powder Metallurgy Parts Revenue (billion) Forecast, by Application 2020 & 2033
- Table 37: Global Power Tools Use Powder Metallurgy Parts Revenue billion Forecast, by Application 2020 & 2033
- Table 38: Global Power Tools Use Powder Metallurgy Parts Revenue billion Forecast, by Type 2020 & 2033
- Table 39: Global Power Tools Use Powder Metallurgy Parts Revenue billion Forecast, by Country 2020 & 2033
- Table 40: China Power Tools Use Powder Metallurgy Parts Revenue (billion) Forecast, by Application 2020 & 2033
- Table 41: India Power Tools Use Powder Metallurgy Parts Revenue (billion) Forecast, by Application 2020 & 2033
- Table 42: Japan Power Tools Use Powder Metallurgy Parts Revenue (billion) Forecast, by Application 2020 & 2033
- Table 43: South Korea Power Tools Use Powder Metallurgy Parts Revenue (billion) Forecast, by Application 2020 & 2033
- Table 44: ASEAN Power Tools Use Powder Metallurgy Parts Revenue (billion) Forecast, by Application 2020 & 2033
- Table 45: Oceania Power Tools Use Powder Metallurgy Parts Revenue (billion) Forecast, by Application 2020 & 2033
- Table 46: Rest of Asia Pacific Power Tools Use Powder Metallurgy Parts Revenue (billion) Forecast, by Application 2020 & 2033
Frequently Asked Questions
1. What is the projected Compound Annual Growth Rate (CAGR) of the Power Tools Use Powder Metallurgy Parts?
The projected CAGR is approximately 8.62%.
2. Which companies are prominent players in the Power Tools Use Powder Metallurgy Parts?
Key companies in the market include Yangzhou Seashine New Materials Co, Nbtm New Materials Group Co, Jiangsu Yingqiu Group Co, PORITE CORPORATION, Chongqing Huafu, Yangzhou LEADER Powder Metallurgy Co, Chongqing Juneng Powder Metallurgy Co, Hengteli Metal Products Co, Zhejiang Xinhe Powder Metallurgy Products Co, MXIN, Hualian Powder Metallurgy, Shanghai Jiasheng Powder, Anhui Hengjun Powder Metallurgy Technology Co.
3. What are the main segments of the Power Tools Use Powder Metallurgy Parts?
The market segments include Application, Type.
4. Can you provide details about the market size?
The market size is estimated to be USD 2.84 billion as of 2022.
5. What are some drivers contributing to market growth?
N/A
6. What are the notable trends driving market growth?
N/A
7. Are there any restraints impacting market growth?
N/A
8. Can you provide examples of recent developments in the market?
N/A
9. What pricing options are available for accessing the report?
Pricing options include single-user, multi-user, and enterprise licenses priced at USD 4250.00, USD 6375.00, and USD 8500.00 respectively.
10. Is the market size provided in terms of value or volume?
The market size is provided in terms of value, measured in billion.
11. Are there any specific market keywords associated with the report?
Yes, the market keyword associated with the report is "Power Tools Use Powder Metallurgy Parts," which aids in identifying and referencing the specific market segment covered.
12. How do I determine which pricing option suits my needs best?
The pricing options vary based on user requirements and access needs. Individual users may opt for single-user licenses, while businesses requiring broader access may choose multi-user or enterprise licenses for cost-effective access to the report.
13. Are there any additional resources or data provided in the Power Tools Use Powder Metallurgy Parts report?
While the report offers comprehensive insights, it's advisable to review the specific contents or supplementary materials provided to ascertain if additional resources or data are available.
14. How can I stay updated on further developments or reports in the Power Tools Use Powder Metallurgy Parts?
To stay informed about further developments, trends, and reports in the Power Tools Use Powder Metallurgy Parts, consider subscribing to industry newsletters, following relevant companies and organizations, or regularly checking reputable industry news sources and publications.
Methodology
Step 1 - Identification of Relevant Samples Size from Population Database


Step 2 - Approaches for Defining Global Market Size (Value, Volume* & Price*)

Note*: In applicable scenarios
Step 3 - Data Sources
Primary Research
- Web Analytics
- Survey Reports
- Research Institute
- Latest Research Reports
- Opinion Leaders
Secondary Research
- Annual Reports
- White Paper
- Latest Press Release
- Industry Association
- Paid Database
- Investor Presentations

Step 4 - Data Triangulation
Involves using different sources of information in order to increase the validity of a study
These sources are likely to be stakeholders in a program - participants, other researchers, program staff, other community members, and so on.
Then we put all data in single framework & apply various statistical tools to find out the dynamic on the market.
During the analysis stage, feedback from the stakeholder groups would be compared to determine areas of agreement as well as areas of divergence