Key Insights
The global prefabricated rubber track market is poised for significant expansion, with an estimated market size of $1.04 billion in 2025. This growth is fueled by a robust compound annual growth rate (CAGR) of 4.6%, indicating sustained demand and development over the forecast period of 2025-2033. The increasing emphasis on sports infrastructure development, coupled with the rising participation in athletic activities globally, serves as a primary driver. Educational institutions are increasingly investing in durable and safe running surfaces for their students, while municipalities are upgrading public parks and recreational areas to promote healthier lifestyles. The superior performance characteristics of prefabricated rubber tracks, such as their shock absorption, weather resistance, and longevity, further bolster their adoption across various applications, including schools, stadiums, and parks. Emerging economies, particularly in the Asia Pacific region, are expected to witness substantial growth due to rapid urbanization and increased government spending on sports facilities.
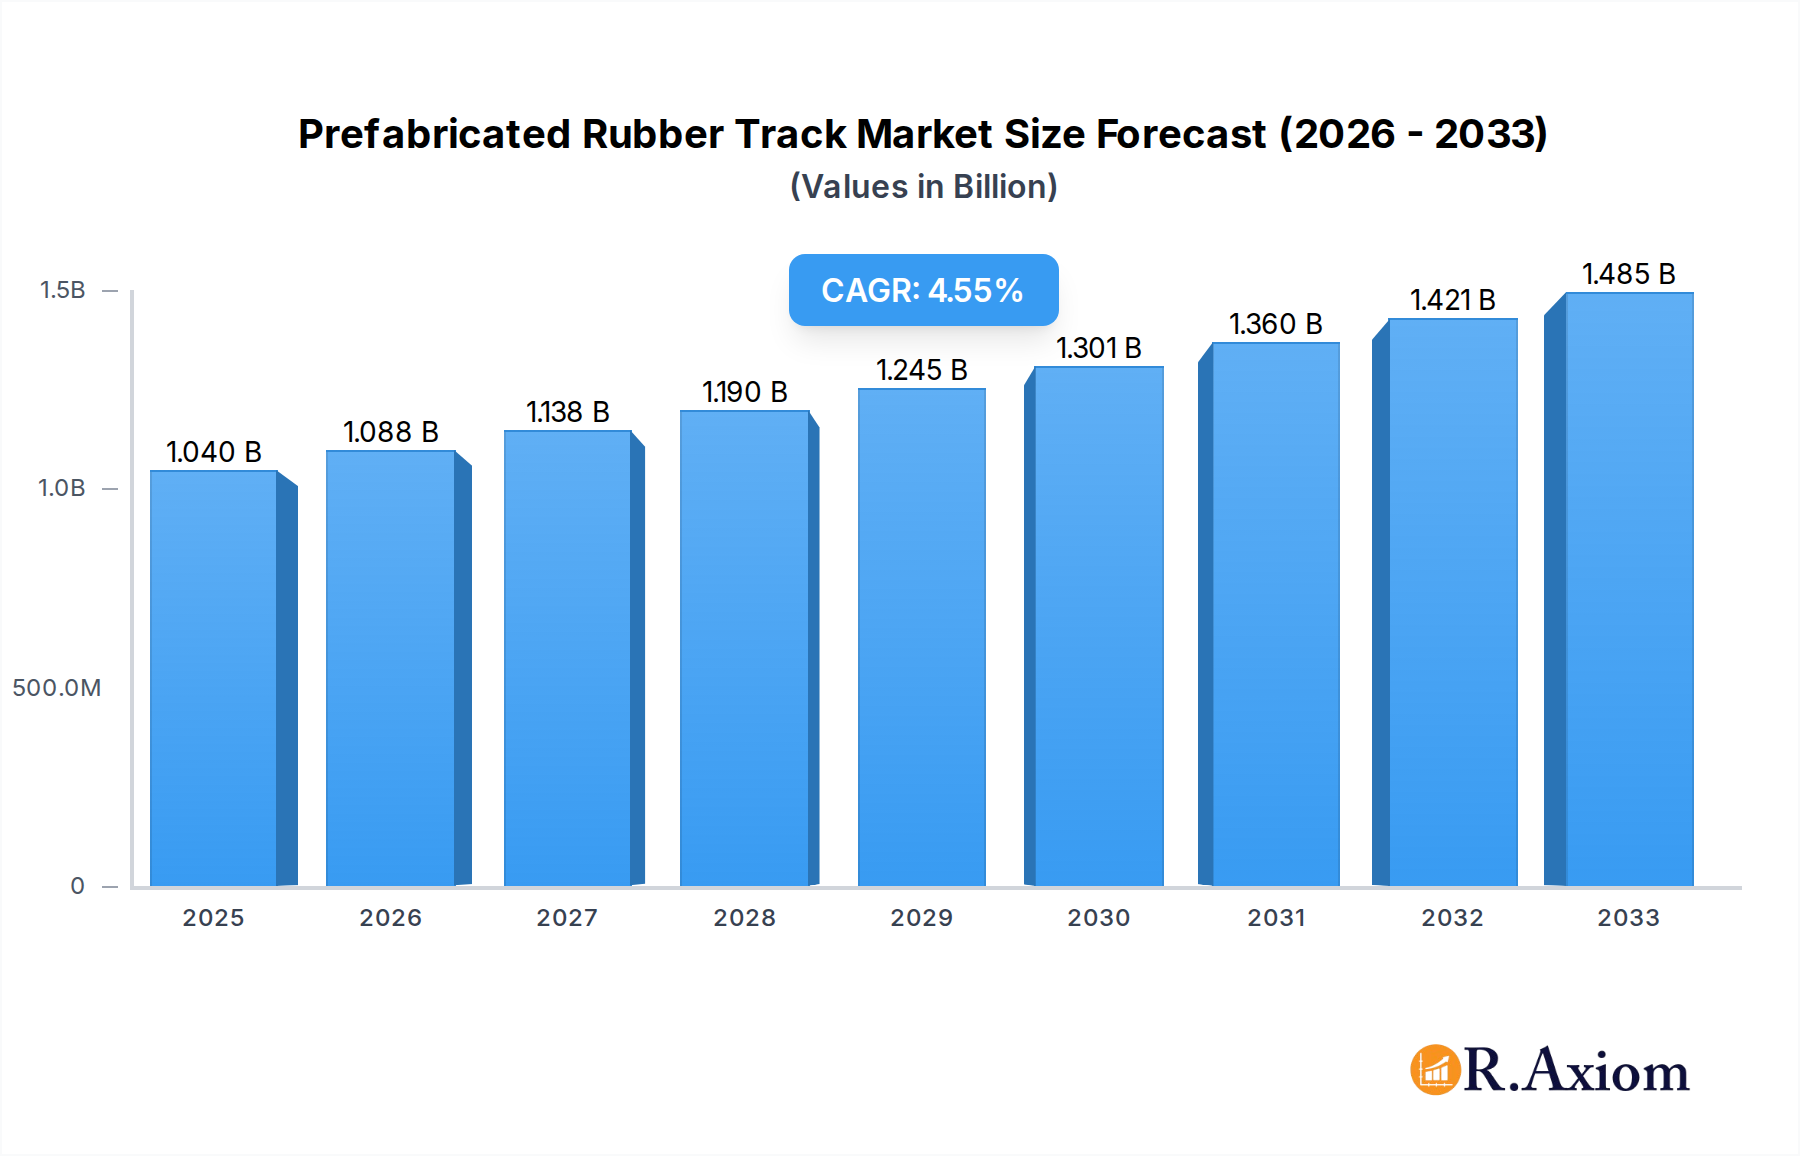
Prefabricated Rubber Track Market Size (In Billion)
The market is characterized by a competitive landscape with key players like MONDO, Flystep, and REGUPOL leading the innovation and supply chain. The demand is segmented by application, with schools and stadiums representing the largest segments due to their continuous need for high-quality athletic surfaces. In terms of type, single-layer and double-layer structures cater to different performance and budget requirements. While the market demonstrates strong growth potential, certain restraints, such as the initial high installation cost and the availability of alternative materials, need to be strategically addressed by manufacturers. However, the long-term benefits of reduced maintenance, enhanced athlete safety, and environmental sustainability inherent in prefabricated rubber tracks are expected to outweigh these challenges, ensuring continued market penetration and value appreciation in the coming years.

Prefabricated Rubber Track Company Market Share
Prefabricated Rubber Track Market Concentration & Innovation
The prefabricated rubber track market exhibits a moderate level of concentration, with key players like MONDO, Flystep, ZSFloor Tech, REGUPOL, BRISPAN, ENLIO, Huadong Track, Nanjing Feeling, Sansu Sport, Asher Sports, Topthink, Fastto Sport, Tianjin NWT Sports, Huanteng Rubber And Plastic Products, Shengli Sports, and Tianjin Dingxing Rubber & Plastic investing heavily in research and development. Innovation is primarily driven by the demand for enhanced athletic performance, improved durability, and eco-friendly materials. Regulatory frameworks, particularly those focused on environmental standards and safety in sports facilities, play a crucial role in shaping product development and market access. While direct product substitutes are limited in high-performance athletic applications, conventional track surfaces like asphalt and synthetic turf present indirect competition in less demanding segments. End-user trends indicate a growing preference for sustainable and high-rebound track solutions in schools and parks, alongside a continuous demand for specialized, high-performance tracks in stadiums. Mergers and acquisitions (M&A) activity, with estimated deal values in the hundreds of billions, are observed as companies seek to consolidate market share, acquire new technologies, and expand their geographical reach. For instance, a significant M&A event in 2023 involved a market leader acquiring a smaller competitor specializing in recycled rubber compounding, demonstrating a strategic push towards vertical integration and sustainability. Market share distribution shows the top five companies holding approximately 60% of the global market, with ongoing efforts to challenge this dominance through product differentiation and strategic partnerships.
Prefabricated Rubber Track Industry Trends & Insights
The prefabricated rubber track industry is poised for significant growth, driven by a confluence of factors that underscore its expanding market penetration. The projected Compound Annual Growth Rate (CAGR) for the forecast period of 2025–2033 is estimated to be robust, reflecting increasing investments in sports infrastructure globally. A primary growth driver is the escalating global emphasis on physical fitness and recreational activities, leading to a surge in demand for safe, durable, and high-performance athletic surfaces in schools, stadiums, and public parks. Technological advancements are continuously pushing the boundaries of material science, leading to the development of innovative track solutions that offer superior shock absorption, energy return, and weather resistance. These innovations are crucial in meeting the evolving demands of athletes and sports organizations seeking to optimize performance and minimize injury risks. Consumer preferences are shifting towards environmentally sustainable materials and manufacturing processes. This trend is encouraging manufacturers to incorporate recycled rubber and explore bio-based components, aligning with global sustainability initiatives and appealing to eco-conscious consumers and governing bodies. Competitive dynamics within the market are intensifying, with established players and emerging manufacturers vying for market share through product differentiation, strategic alliances, and aggressive marketing strategies. The introduction of modular and customizable track systems is also gaining traction, offering greater flexibility and faster installation times, which are particularly attractive for large-scale projects and rapid upgrades. Furthermore, the increasing digitalization of sports analytics is creating a demand for track surfaces that can integrate with performance-monitoring technologies, adding another layer of innovation and market differentiation. The global market penetration of prefabricated rubber tracks is steadily increasing as the cost-effectiveness and long-term benefits of these surfaces become more widely recognized compared to traditional alternatives. The market is also influenced by government initiatives promoting sports participation and healthy lifestyles, which often translate into increased funding for sports infrastructure development. The historical period from 2019–2024 witnessed a steady upward trajectory, laying the groundwork for accelerated growth in the upcoming years. The base year of 2025 is expected to see a market value in the billions, with significant contributions from major regions investing in sports facilities.
Dominant Markets & Segments in Prefabricated Rubber Track
The prefabricated rubber track market is characterized by distinct regional dominance and segment preferences. Asia-Pacific stands out as a leading region, driven by substantial government investments in sports infrastructure, a large and growing youth population engaged in athletic activities, and increasing urbanization leading to the development of more public parks and recreational spaces. Within Asia-Pacific, China is a pivotal country, accounting for a significant portion of the global demand due to its massive scale of construction projects, including numerous schools and stadiums being upgraded or built annually. Economic policies in countries like China, focused on promoting sports development and public health, are key drivers fueling this regional dominance.
Application: School
- Key Drivers: Growing emphasis on physical education curriculum, demand for safe and durable surfaces for inter-school competitions, and increasing budgets allocated for school facility upgrades. Government mandates for safe play areas also contribute significantly.
- Dominance Analysis: Schools represent a substantial segment due to the sheer volume of educational institutions requiring track and field facilities. The demand here is driven by consistent needs for maintenance and new installations.
Application: Stadium
- Key Drivers: Hosting international sporting events, professional athletic training facilities, and the need for high-performance surfaces that meet international athletic federation standards. Investments in legacy infrastructure after major sporting events also play a role.
- Dominance Analysis: While the number of stadiums is smaller than schools, they represent high-value projects with stringent performance requirements, often demanding premium, specialized prefabricated rubber track systems.
Application: Parks
- Key Drivers: Urban development and the creation of green spaces, demand for accessible and safe recreational areas for the general public, and government initiatives promoting community health and outdoor activities.
- Dominance Analysis: The growth of urban populations and a focus on improving quality of life are driving the installation of prefabricated rubber tracks in parks for jogging, walking, and amateur sports.
Application: Others
- Key Drivers: Military training facilities, specialized sports training centers, and indoor athletic complexes.
- Dominance Analysis: This segment, while niche, can be significant for customized solutions and high-performance applications not covered by the primary categories.
Type: Single-layer Structure
- Key Drivers: Cost-effectiveness, simpler installation, and suitability for less demanding athletic applications or multi-purpose recreational areas.
- Dominance Analysis: Single-layer structures are often preferred for their balance of performance and affordability, making them popular for a wide range of applications, especially in schools and parks where budget considerations are paramount.
Type: Double-layer Structure
- Key Drivers: Enhanced shock absorption, superior energy return, and higher durability, making them ideal for professional athletic training and competitive sports where peak performance is critical.
- Dominance Analysis: Double-layer structures are the choice for high-level athletic venues and stadiums, catering to the demands of professional athletes and ensuring compliance with advanced performance standards.
Type: Others
- Key Drivers: Specialized hybrid structures designed for specific performance characteristics or unique installation requirements.
- Dominance Analysis: This category covers innovative designs that cater to niche market demands, offering tailored solutions for specific athletic or recreational needs.
Prefabricated Rubber Track Product Developments
Product developments in the prefabricated rubber track market are characterized by a focus on enhanced performance and sustainability. Innovations include the integration of advanced cushioning systems for superior shock absorption and reduced athlete fatigue, as well as the development of highly elastic materials that provide exceptional energy return for improved athletic performance. Furthermore, there's a significant push towards utilizing recycled rubber content, reducing the environmental footprint of these tracks and aligning with global sustainability initiatives. Companies are also developing track systems with improved UV resistance and weatherproofing, ensuring longevity and consistent performance across diverse climatic conditions. These developments offer a competitive advantage by meeting the evolving demands of sports federations, educational institutions, and recreational facility managers seeking durable, high-performance, and eco-friendly solutions.
Report Scope & Segmentation Analysis
This report offers a comprehensive analysis of the global prefabricated rubber track market, segmented by Application and Type. The Application segments include School, Stadium, Parks, and Others, each representing distinct demand drivers and market dynamics. The School segment is expected to witness steady growth due to the perpetual need for safe and durable athletic surfaces in educational institutions. Stadium applications, while smaller in volume, command higher value due to stringent performance requirements for professional sports. The Parks segment is expanding with increased urbanization and the focus on public recreational spaces. The 'Others' category encompasses specialized applications like military facilities and indoor arenas. Segmentation by Type includes Single-layer Structure, Double-layer Structure, and Others. Single-layer structures offer cost-effectiveness, while double-layer structures provide superior performance and durability, catering to different market needs. The 'Others' category highlights innovative and specialized track designs. Market size projections and competitive landscapes are analyzed for each segment, providing detailed insights into their growth trajectories and strategic importance within the overall market.
Key Drivers of Prefabricated Rubber Track Growth
The growth of the prefabricated rubber track market is propelled by several interconnected factors. Firstly, the escalating global emphasis on promoting sports participation and healthy lifestyles among all age groups is a primary economic driver, leading to increased investment in sports infrastructure worldwide. Secondly, technological advancements in polymer science and material engineering are enabling the development of more durable, safer, and higher-performing track surfaces, such as those offering enhanced shock absorption and energy return. Regulatory frameworks, particularly those promoting environmental sustainability through the use of recycled materials and mandating safety standards for athletic facilities, are also significant catalysts. For example, governmental initiatives promoting green building and infrastructure development directly support the adoption of eco-friendly prefabricated rubber tracks. The consistent need for renovation and upgrade of existing sports facilities, coupled with the construction of new ones, further fuels demand.
Challenges in the Prefabricated Rubber Track Sector
Despite its growth, the prefabricated rubber track sector faces several challenges. High initial installation costs compared to some traditional surfaces can be a barrier for budget-constrained organizations, particularly in developing regions. Fluctuations in raw material prices, such as synthetic rubber and binding agents, can impact profit margins and pricing stability. Stringent regulatory requirements for environmental compliance and product safety, while beneficial in the long run, can increase product development costs and time-to-market for new innovations. Intense competition among numerous global and regional manufacturers can lead to price wars and pressure on profitability. Furthermore, supply chain disruptions, particularly those affecting the availability of specialized raw materials or manufacturing equipment, can impede production and timely delivery, impacting customer satisfaction and project timelines. The degradation of rubber over extended periods due to environmental exposure, requiring periodic maintenance or replacement, also presents a long-term cost consideration for end-users.
Emerging Opportunities in Prefabricated Rubber Track
Emerging opportunities in the prefabricated rubber track market are significant and multifaceted. There is a growing demand for smart track technologies that can integrate with sensors for performance analytics, offering athletes and coaches valuable data. The increasing global focus on sustainability presents a substantial opportunity for manufacturers to develop and market tracks made from a higher percentage of recycled materials, including used tires and other rubber waste. Expansion into emerging economies with rapidly developing sports infrastructure is another key avenue for growth. Furthermore, the development of specialized track surfaces tailored for specific niche sports beyond traditional athletics, such as specialized agility or cross-training areas, opens new market segments. The trend towards multi-functional sports complexes also creates opportunities for customizable and adaptable prefabricated rubber track solutions.
Leading Players in the Prefabricated Rubber Track Market
- MONDO
- Flystep
- ZSFloor Tech
- REGUPOL
- BRISPAN
- ENLIO
- Huadong Track
- Nanjing Feeling
- Sansu Sport
- Asher Sports
- Topthink
- Fastto Sport
- Tianjin NWT Sports
- Huanteng Rubber And Plastic Products
- Shengli Sports
- Tianjin Dingxing Rubber & Plastic
Key Developments in Prefabricated Rubber Track Industry
- 2023: Launch of a new generation of high-performance, recycled-content rubber tracks by MONDO, significantly improving athletic performance metrics and environmental sustainability.
- 2023: Flystep announces expansion into the North American market with a focus on eco-friendly athletic surfacing solutions, targeting school and park projects.
- 2023: ZSFloor Tech introduces a modular, interlocking prefabricated rubber tile system designed for rapid installation and versatility in various recreational settings.
- 2022: REGUPOL invests in advanced R&D for bio-based binders, aiming to further reduce the reliance on petrochemicals in their track manufacturing.
- 2022: BRISPAN partners with a leading sports federation to develop and certify a new track design optimized for elite track and field events.
- 2021: ENLIO expands its production capacity to meet the surging demand for prefabricated rubber tracks in the rapidly growing Asian sports infrastructure market.
- 2021: Huadong Track introduces innovative surface treatments for enhanced UV resistance and color retention in their outdoor track offerings.
- 2020: Nanjing Feeling launches a range of vibrant, customizable color options for their prefabricated rubber tracks, catering to aesthetic preferences in park and school designs.
- 2020: Sansu Sport focuses on developing resilient and impact-absorbing track systems for amateur sports and fitness facilities.
- 2019: Asher Sports acquires a competitor to consolidate its market position and expand its product portfolio in athletic surfacing.
- 2019: Topthink develops a proprietary manufacturing process that reduces energy consumption by an estimated 15% in their production of prefabricated rubber tracks.
Strategic Outlook for Prefabricated Rubber Track Market
The strategic outlook for the prefabricated rubber track market is exceptionally positive, driven by sustained global investment in sports and recreational infrastructure, coupled with an increasing emphasis on health and wellness. Key growth catalysts include continued technological innovation leading to higher-performing and more sustainable materials, such as advanced recycled rubber composites and bio-based binders. The rising demand for eco-friendly solutions aligns perfectly with the market’s capacity to integrate recycled content. Furthermore, emerging economies present significant untapped potential for market expansion. Companies that focus on product differentiation, particularly in areas of performance optimization, durability, environmental impact, and the integration of smart technologies, are well-positioned to capture market share. Strategic partnerships, acquisitions, and a strong commitment to research and development will be crucial for maintaining a competitive edge in this dynamic and evolving industry.
Prefabricated Rubber Track Segmentation
-
1. Application
- 1.1. School
- 1.2. Stadium
- 1.3. Parks
- 1.4. Others
-
2. Type
- 2.1. Single-layer Structure
- 2.2. Double-layer Structure
- 2.3. Others
Prefabricated Rubber Track Segmentation By Geography
-
1. North America
- 1.1. United States
- 1.2. Canada
- 1.3. Mexico
-
2. South America
- 2.1. Brazil
- 2.2. Argentina
- 2.3. Rest of South America
-
3. Europe
- 3.1. United Kingdom
- 3.2. Germany
- 3.3. France
- 3.4. Italy
- 3.5. Spain
- 3.6. Russia
- 3.7. Benelux
- 3.8. Nordics
- 3.9. Rest of Europe
-
4. Middle East & Africa
- 4.1. Turkey
- 4.2. Israel
- 4.3. GCC
- 4.4. North Africa
- 4.5. South Africa
- 4.6. Rest of Middle East & Africa
-
5. Asia Pacific
- 5.1. China
- 5.2. India
- 5.3. Japan
- 5.4. South Korea
- 5.5. ASEAN
- 5.6. Oceania
- 5.7. Rest of Asia Pacific
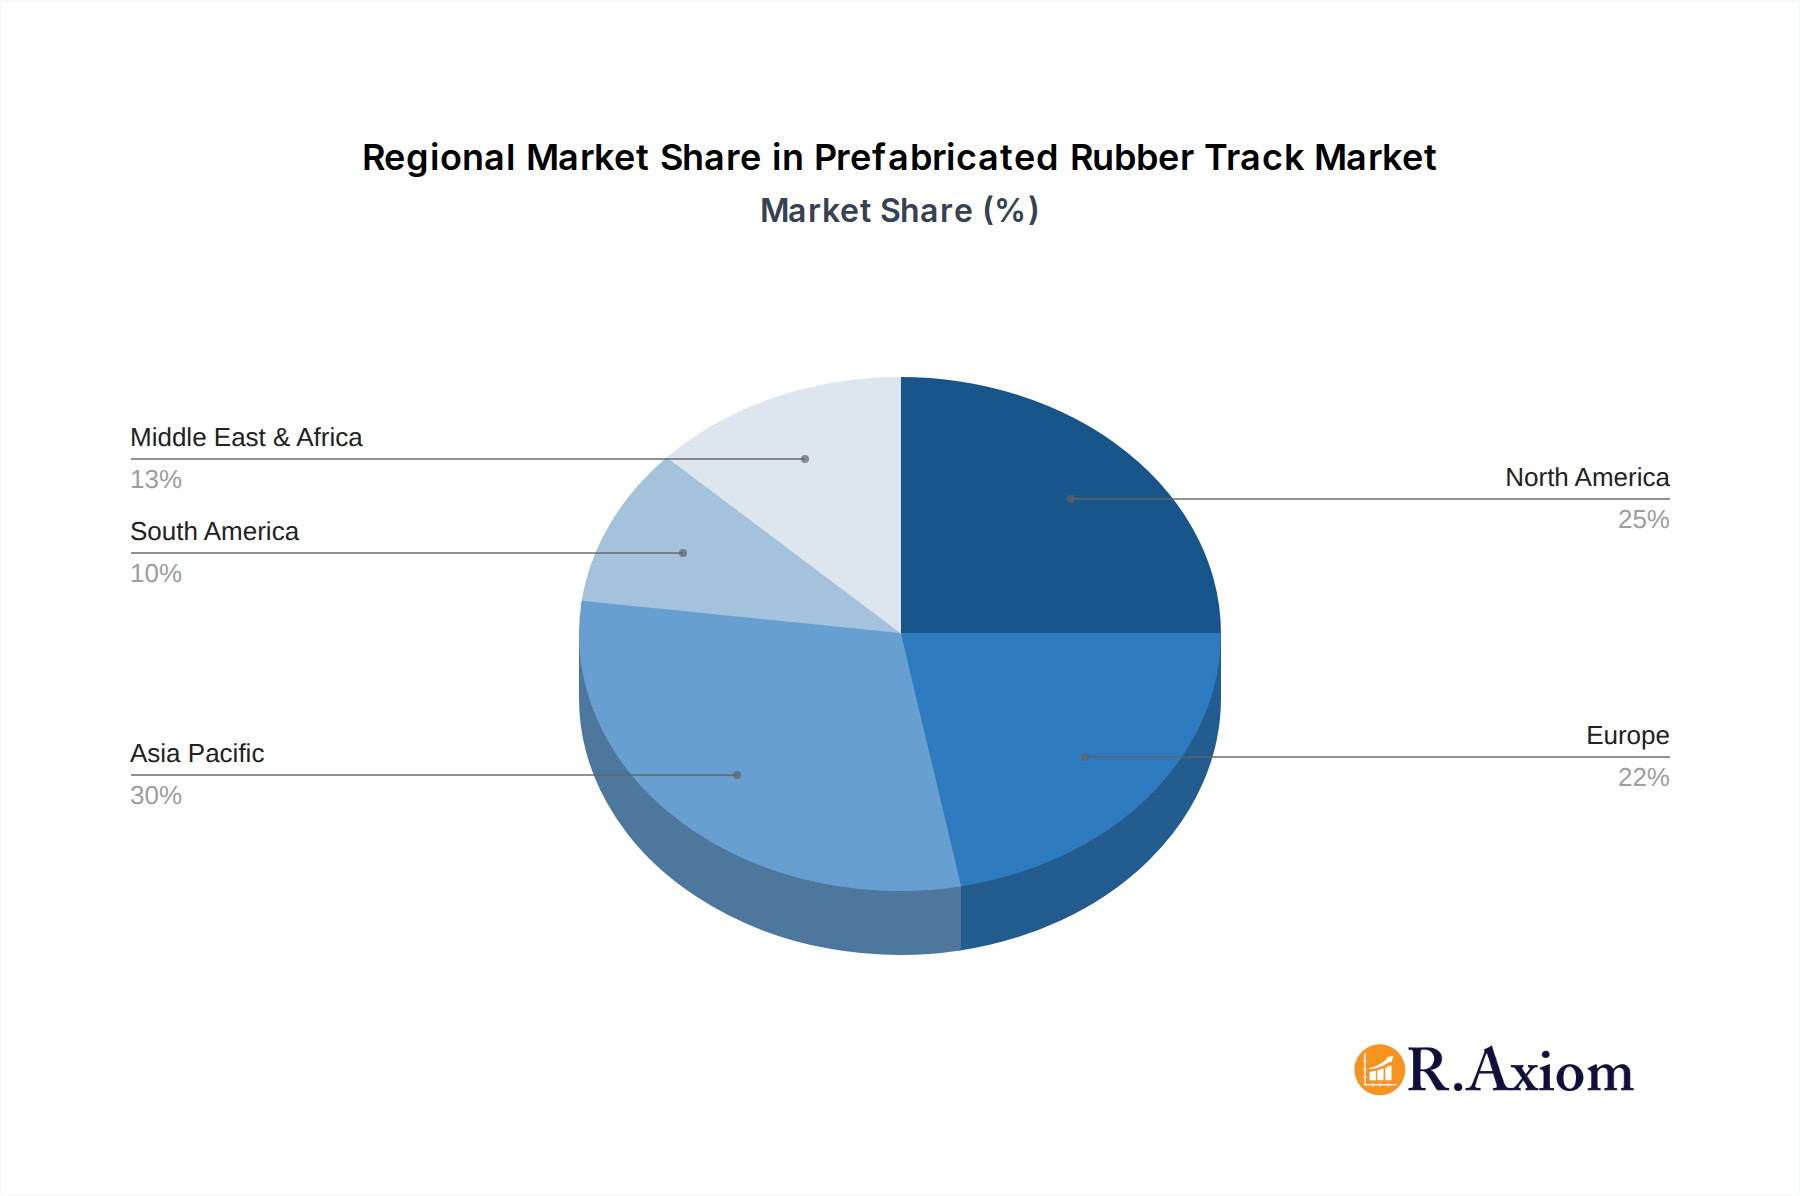
Prefabricated Rubber Track Regional Market Share
Geographic Coverage of Prefabricated Rubber Track
Prefabricated Rubber Track REPORT HIGHLIGHTS
| Aspects | Details |
|---|---|
| Study Period | 2020-2034 |
| Base Year | 2025 |
| Estimated Year | 2026 |
| Forecast Period | 2026-2034 |
| Historical Period | 2020-2025 |
| Growth Rate | CAGR of 4.6% from 2020-2034 |
| Segmentation |
|
Table of Contents
- 1. Introduction
- 1.1. Research Scope
- 1.2. Market Segmentation
- 1.3. Research Objective
- 1.4. Definitions and Assumptions
- 2. Executive Summary
- 2.1. Market Snapshot
- 3. Market Dynamics
- 3.1. Market Drivers
- 3.2. Market Restrains
- 3.3. Market Trends
- 3.4. Market Opportunities
- 4. Market Factor Analysis
- 4.1. Porters Five Forces
- 4.1.1. Bargaining Power of Suppliers
- 4.1.2. Bargaining Power of Buyers
- 4.1.3. Threat of New Entrants
- 4.1.4. Threat of Substitutes
- 4.1.5. Competitive Rivalry
- 4.2. PESTEL analysis
- 4.3. BCG Analysis
- 4.3.1. Stars (High Growth, High Market Share)
- 4.3.2. Cash Cows (Low Growth, High Market Share)
- 4.3.3. Question Mark (High Growth, Low Market Share)
- 4.3.4. Dogs (Low Growth, Low Market Share)
- 4.4. Ansoff Matrix Analysis
- 4.5. Supply Chain Analysis
- 4.6. Regulatory Landscape
- 4.7. Current Market Potential and Opportunity Assessment (TAM–SAM–SOM Framework)
- 4.8. RAX Analyst Note
- 4.1. Porters Five Forces
- 5. Market Analysis, Insights and Forecast 2021-2033
- 5.1. Market Analysis, Insights and Forecast - by Application
- 5.1.1. School
- 5.1.2. Stadium
- 5.1.3. Parks
- 5.1.4. Others
- 5.2. Market Analysis, Insights and Forecast - by Type
- 5.2.1. Single-layer Structure
- 5.2.2. Double-layer Structure
- 5.2.3. Others
- 5.3. Market Analysis, Insights and Forecast - by Region
- 5.3.1. North America
- 5.3.2. South America
- 5.3.3. Europe
- 5.3.4. Middle East & Africa
- 5.3.5. Asia Pacific
- 5.1. Market Analysis, Insights and Forecast - by Application
- 6. Global Prefabricated Rubber Track Analysis, Insights and Forecast, 2021-2033
- 6.1. Market Analysis, Insights and Forecast - by Application
- 6.1.1. School
- 6.1.2. Stadium
- 6.1.3. Parks
- 6.1.4. Others
- 6.2. Market Analysis, Insights and Forecast - by Type
- 6.2.1. Single-layer Structure
- 6.2.2. Double-layer Structure
- 6.2.3. Others
- 6.1. Market Analysis, Insights and Forecast - by Application
- 7. North America Prefabricated Rubber Track Analysis, Insights and Forecast, 2020-2032
- 7.1. Market Analysis, Insights and Forecast - by Application
- 7.1.1. School
- 7.1.2. Stadium
- 7.1.3. Parks
- 7.1.4. Others
- 7.2. Market Analysis, Insights and Forecast - by Type
- 7.2.1. Single-layer Structure
- 7.2.2. Double-layer Structure
- 7.2.3. Others
- 7.1. Market Analysis, Insights and Forecast - by Application
- 8. South America Prefabricated Rubber Track Analysis, Insights and Forecast, 2020-2032
- 8.1. Market Analysis, Insights and Forecast - by Application
- 8.1.1. School
- 8.1.2. Stadium
- 8.1.3. Parks
- 8.1.4. Others
- 8.2. Market Analysis, Insights and Forecast - by Type
- 8.2.1. Single-layer Structure
- 8.2.2. Double-layer Structure
- 8.2.3. Others
- 8.1. Market Analysis, Insights and Forecast - by Application
- 9. Europe Prefabricated Rubber Track Analysis, Insights and Forecast, 2020-2032
- 9.1. Market Analysis, Insights and Forecast - by Application
- 9.1.1. School
- 9.1.2. Stadium
- 9.1.3. Parks
- 9.1.4. Others
- 9.2. Market Analysis, Insights and Forecast - by Type
- 9.2.1. Single-layer Structure
- 9.2.2. Double-layer Structure
- 9.2.3. Others
- 9.1. Market Analysis, Insights and Forecast - by Application
- 10. Middle East & Africa Prefabricated Rubber Track Analysis, Insights and Forecast, 2020-2032
- 10.1. Market Analysis, Insights and Forecast - by Application
- 10.1.1. School
- 10.1.2. Stadium
- 10.1.3. Parks
- 10.1.4. Others
- 10.2. Market Analysis, Insights and Forecast - by Type
- 10.2.1. Single-layer Structure
- 10.2.2. Double-layer Structure
- 10.2.3. Others
- 10.1. Market Analysis, Insights and Forecast - by Application
- 11. Asia Pacific Prefabricated Rubber Track Analysis, Insights and Forecast, 2020-2032
- 11.1. Market Analysis, Insights and Forecast - by Application
- 11.1.1. School
- 11.1.2. Stadium
- 11.1.3. Parks
- 11.1.4. Others
- 11.2. Market Analysis, Insights and Forecast - by Type
- 11.2.1. Single-layer Structure
- 11.2.2. Double-layer Structure
- 11.2.3. Others
- 11.1. Market Analysis, Insights and Forecast - by Application
- 12. Competitive Analysis
- 12.1. Company Profiles
- 12.1.1 MONDO
- 12.1.1.1. Company Overview
- 12.1.1.2. Products
- 12.1.1.3. Company Financials
- 12.1.1.4. SWOT Analysis
- 12.1.2 Flystep
- 12.1.2.1. Company Overview
- 12.1.2.2. Products
- 12.1.2.3. Company Financials
- 12.1.2.4. SWOT Analysis
- 12.1.3 ZSFloor Tech
- 12.1.3.1. Company Overview
- 12.1.3.2. Products
- 12.1.3.3. Company Financials
- 12.1.3.4. SWOT Analysis
- 12.1.4 REGUPOL
- 12.1.4.1. Company Overview
- 12.1.4.2. Products
- 12.1.4.3. Company Financials
- 12.1.4.4. SWOT Analysis
- 12.1.5 BRISPAN
- 12.1.5.1. Company Overview
- 12.1.5.2. Products
- 12.1.5.3. Company Financials
- 12.1.5.4. SWOT Analysis
- 12.1.6 ENLIO
- 12.1.6.1. Company Overview
- 12.1.6.2. Products
- 12.1.6.3. Company Financials
- 12.1.6.4. SWOT Analysis
- 12.1.7 Huadong Track
- 12.1.7.1. Company Overview
- 12.1.7.2. Products
- 12.1.7.3. Company Financials
- 12.1.7.4. SWOT Analysis
- 12.1.8 Nanjing Feeling
- 12.1.8.1. Company Overview
- 12.1.8.2. Products
- 12.1.8.3. Company Financials
- 12.1.8.4. SWOT Analysis
- 12.1.9 Sansu Sport
- 12.1.9.1. Company Overview
- 12.1.9.2. Products
- 12.1.9.3. Company Financials
- 12.1.9.4. SWOT Analysis
- 12.1.10 Asher Sports
- 12.1.10.1. Company Overview
- 12.1.10.2. Products
- 12.1.10.3. Company Financials
- 12.1.10.4. SWOT Analysis
- 12.1.11 Topthink
- 12.1.11.1. Company Overview
- 12.1.11.2. Products
- 12.1.11.3. Company Financials
- 12.1.11.4. SWOT Analysis
- 12.1.12 Fastto Sport
- 12.1.12.1. Company Overview
- 12.1.12.2. Products
- 12.1.12.3. Company Financials
- 12.1.12.4. SWOT Analysis
- 12.1.13 Tianjin NWT Sports
- 12.1.13.1. Company Overview
- 12.1.13.2. Products
- 12.1.13.3. Company Financials
- 12.1.13.4. SWOT Analysis
- 12.1.14 Huanteng Rubber And Plastic Products
- 12.1.14.1. Company Overview
- 12.1.14.2. Products
- 12.1.14.3. Company Financials
- 12.1.14.4. SWOT Analysis
- 12.1.15 Shengli Sports
- 12.1.15.1. Company Overview
- 12.1.15.2. Products
- 12.1.15.3. Company Financials
- 12.1.15.4. SWOT Analysis
- 12.1.16 Tianjin Dingxing Rubber & Plastic
- 12.1.16.1. Company Overview
- 12.1.16.2. Products
- 12.1.16.3. Company Financials
- 12.1.16.4. SWOT Analysis
- 12.1.1 MONDO
- 12.2. Market Entropy
- 12.2.1 Company's Key Areas Served
- 12.2.2 Recent Developments
- 12.3. Company Market Share Analysis 2025
- 12.3.1 Top 5 Companies Market Share Analysis
- 12.3.2 Top 3 Companies Market Share Analysis
- 12.4. List of Potential Customers
- 13. Research Methodology
List of Figures
- Figure 1: Global Prefabricated Rubber Track Revenue Breakdown (billion, %) by Region 2025 & 2033
- Figure 2: Global Prefabricated Rubber Track Volume Breakdown (K, %) by Region 2025 & 2033
- Figure 3: North America Prefabricated Rubber Track Revenue (billion), by Application 2025 & 2033
- Figure 4: North America Prefabricated Rubber Track Volume (K), by Application 2025 & 2033
- Figure 5: North America Prefabricated Rubber Track Revenue Share (%), by Application 2025 & 2033
- Figure 6: North America Prefabricated Rubber Track Volume Share (%), by Application 2025 & 2033
- Figure 7: North America Prefabricated Rubber Track Revenue (billion), by Type 2025 & 2033
- Figure 8: North America Prefabricated Rubber Track Volume (K), by Type 2025 & 2033
- Figure 9: North America Prefabricated Rubber Track Revenue Share (%), by Type 2025 & 2033
- Figure 10: North America Prefabricated Rubber Track Volume Share (%), by Type 2025 & 2033
- Figure 11: North America Prefabricated Rubber Track Revenue (billion), by Country 2025 & 2033
- Figure 12: North America Prefabricated Rubber Track Volume (K), by Country 2025 & 2033
- Figure 13: North America Prefabricated Rubber Track Revenue Share (%), by Country 2025 & 2033
- Figure 14: North America Prefabricated Rubber Track Volume Share (%), by Country 2025 & 2033
- Figure 15: South America Prefabricated Rubber Track Revenue (billion), by Application 2025 & 2033
- Figure 16: South America Prefabricated Rubber Track Volume (K), by Application 2025 & 2033
- Figure 17: South America Prefabricated Rubber Track Revenue Share (%), by Application 2025 & 2033
- Figure 18: South America Prefabricated Rubber Track Volume Share (%), by Application 2025 & 2033
- Figure 19: South America Prefabricated Rubber Track Revenue (billion), by Type 2025 & 2033
- Figure 20: South America Prefabricated Rubber Track Volume (K), by Type 2025 & 2033
- Figure 21: South America Prefabricated Rubber Track Revenue Share (%), by Type 2025 & 2033
- Figure 22: South America Prefabricated Rubber Track Volume Share (%), by Type 2025 & 2033
- Figure 23: South America Prefabricated Rubber Track Revenue (billion), by Country 2025 & 2033
- Figure 24: South America Prefabricated Rubber Track Volume (K), by Country 2025 & 2033
- Figure 25: South America Prefabricated Rubber Track Revenue Share (%), by Country 2025 & 2033
- Figure 26: South America Prefabricated Rubber Track Volume Share (%), by Country 2025 & 2033
- Figure 27: Europe Prefabricated Rubber Track Revenue (billion), by Application 2025 & 2033
- Figure 28: Europe Prefabricated Rubber Track Volume (K), by Application 2025 & 2033
- Figure 29: Europe Prefabricated Rubber Track Revenue Share (%), by Application 2025 & 2033
- Figure 30: Europe Prefabricated Rubber Track Volume Share (%), by Application 2025 & 2033
- Figure 31: Europe Prefabricated Rubber Track Revenue (billion), by Type 2025 & 2033
- Figure 32: Europe Prefabricated Rubber Track Volume (K), by Type 2025 & 2033
- Figure 33: Europe Prefabricated Rubber Track Revenue Share (%), by Type 2025 & 2033
- Figure 34: Europe Prefabricated Rubber Track Volume Share (%), by Type 2025 & 2033
- Figure 35: Europe Prefabricated Rubber Track Revenue (billion), by Country 2025 & 2033
- Figure 36: Europe Prefabricated Rubber Track Volume (K), by Country 2025 & 2033
- Figure 37: Europe Prefabricated Rubber Track Revenue Share (%), by Country 2025 & 2033
- Figure 38: Europe Prefabricated Rubber Track Volume Share (%), by Country 2025 & 2033
- Figure 39: Middle East & Africa Prefabricated Rubber Track Revenue (billion), by Application 2025 & 2033
- Figure 40: Middle East & Africa Prefabricated Rubber Track Volume (K), by Application 2025 & 2033
- Figure 41: Middle East & Africa Prefabricated Rubber Track Revenue Share (%), by Application 2025 & 2033
- Figure 42: Middle East & Africa Prefabricated Rubber Track Volume Share (%), by Application 2025 & 2033
- Figure 43: Middle East & Africa Prefabricated Rubber Track Revenue (billion), by Type 2025 & 2033
- Figure 44: Middle East & Africa Prefabricated Rubber Track Volume (K), by Type 2025 & 2033
- Figure 45: Middle East & Africa Prefabricated Rubber Track Revenue Share (%), by Type 2025 & 2033
- Figure 46: Middle East & Africa Prefabricated Rubber Track Volume Share (%), by Type 2025 & 2033
- Figure 47: Middle East & Africa Prefabricated Rubber Track Revenue (billion), by Country 2025 & 2033
- Figure 48: Middle East & Africa Prefabricated Rubber Track Volume (K), by Country 2025 & 2033
- Figure 49: Middle East & Africa Prefabricated Rubber Track Revenue Share (%), by Country 2025 & 2033
- Figure 50: Middle East & Africa Prefabricated Rubber Track Volume Share (%), by Country 2025 & 2033
- Figure 51: Asia Pacific Prefabricated Rubber Track Revenue (billion), by Application 2025 & 2033
- Figure 52: Asia Pacific Prefabricated Rubber Track Volume (K), by Application 2025 & 2033
- Figure 53: Asia Pacific Prefabricated Rubber Track Revenue Share (%), by Application 2025 & 2033
- Figure 54: Asia Pacific Prefabricated Rubber Track Volume Share (%), by Application 2025 & 2033
- Figure 55: Asia Pacific Prefabricated Rubber Track Revenue (billion), by Type 2025 & 2033
- Figure 56: Asia Pacific Prefabricated Rubber Track Volume (K), by Type 2025 & 2033
- Figure 57: Asia Pacific Prefabricated Rubber Track Revenue Share (%), by Type 2025 & 2033
- Figure 58: Asia Pacific Prefabricated Rubber Track Volume Share (%), by Type 2025 & 2033
- Figure 59: Asia Pacific Prefabricated Rubber Track Revenue (billion), by Country 2025 & 2033
- Figure 60: Asia Pacific Prefabricated Rubber Track Volume (K), by Country 2025 & 2033
- Figure 61: Asia Pacific Prefabricated Rubber Track Revenue Share (%), by Country 2025 & 2033
- Figure 62: Asia Pacific Prefabricated Rubber Track Volume Share (%), by Country 2025 & 2033
List of Tables
- Table 1: Global Prefabricated Rubber Track Revenue billion Forecast, by Application 2020 & 2033
- Table 2: Global Prefabricated Rubber Track Volume K Forecast, by Application 2020 & 2033
- Table 3: Global Prefabricated Rubber Track Revenue billion Forecast, by Type 2020 & 2033
- Table 4: Global Prefabricated Rubber Track Volume K Forecast, by Type 2020 & 2033
- Table 5: Global Prefabricated Rubber Track Revenue billion Forecast, by Region 2020 & 2033
- Table 6: Global Prefabricated Rubber Track Volume K Forecast, by Region 2020 & 2033
- Table 7: Global Prefabricated Rubber Track Revenue billion Forecast, by Application 2020 & 2033
- Table 8: Global Prefabricated Rubber Track Volume K Forecast, by Application 2020 & 2033
- Table 9: Global Prefabricated Rubber Track Revenue billion Forecast, by Type 2020 & 2033
- Table 10: Global Prefabricated Rubber Track Volume K Forecast, by Type 2020 & 2033
- Table 11: Global Prefabricated Rubber Track Revenue billion Forecast, by Country 2020 & 2033
- Table 12: Global Prefabricated Rubber Track Volume K Forecast, by Country 2020 & 2033
- Table 13: United States Prefabricated Rubber Track Revenue (billion) Forecast, by Application 2020 & 2033
- Table 14: United States Prefabricated Rubber Track Volume (K) Forecast, by Application 2020 & 2033
- Table 15: Canada Prefabricated Rubber Track Revenue (billion) Forecast, by Application 2020 & 2033
- Table 16: Canada Prefabricated Rubber Track Volume (K) Forecast, by Application 2020 & 2033
- Table 17: Mexico Prefabricated Rubber Track Revenue (billion) Forecast, by Application 2020 & 2033
- Table 18: Mexico Prefabricated Rubber Track Volume (K) Forecast, by Application 2020 & 2033
- Table 19: Global Prefabricated Rubber Track Revenue billion Forecast, by Application 2020 & 2033
- Table 20: Global Prefabricated Rubber Track Volume K Forecast, by Application 2020 & 2033
- Table 21: Global Prefabricated Rubber Track Revenue billion Forecast, by Type 2020 & 2033
- Table 22: Global Prefabricated Rubber Track Volume K Forecast, by Type 2020 & 2033
- Table 23: Global Prefabricated Rubber Track Revenue billion Forecast, by Country 2020 & 2033
- Table 24: Global Prefabricated Rubber Track Volume K Forecast, by Country 2020 & 2033
- Table 25: Brazil Prefabricated Rubber Track Revenue (billion) Forecast, by Application 2020 & 2033
- Table 26: Brazil Prefabricated Rubber Track Volume (K) Forecast, by Application 2020 & 2033
- Table 27: Argentina Prefabricated Rubber Track Revenue (billion) Forecast, by Application 2020 & 2033
- Table 28: Argentina Prefabricated Rubber Track Volume (K) Forecast, by Application 2020 & 2033
- Table 29: Rest of South America Prefabricated Rubber Track Revenue (billion) Forecast, by Application 2020 & 2033
- Table 30: Rest of South America Prefabricated Rubber Track Volume (K) Forecast, by Application 2020 & 2033
- Table 31: Global Prefabricated Rubber Track Revenue billion Forecast, by Application 2020 & 2033
- Table 32: Global Prefabricated Rubber Track Volume K Forecast, by Application 2020 & 2033
- Table 33: Global Prefabricated Rubber Track Revenue billion Forecast, by Type 2020 & 2033
- Table 34: Global Prefabricated Rubber Track Volume K Forecast, by Type 2020 & 2033
- Table 35: Global Prefabricated Rubber Track Revenue billion Forecast, by Country 2020 & 2033
- Table 36: Global Prefabricated Rubber Track Volume K Forecast, by Country 2020 & 2033
- Table 37: United Kingdom Prefabricated Rubber Track Revenue (billion) Forecast, by Application 2020 & 2033
- Table 38: United Kingdom Prefabricated Rubber Track Volume (K) Forecast, by Application 2020 & 2033
- Table 39: Germany Prefabricated Rubber Track Revenue (billion) Forecast, by Application 2020 & 2033
- Table 40: Germany Prefabricated Rubber Track Volume (K) Forecast, by Application 2020 & 2033
- Table 41: France Prefabricated Rubber Track Revenue (billion) Forecast, by Application 2020 & 2033
- Table 42: France Prefabricated Rubber Track Volume (K) Forecast, by Application 2020 & 2033
- Table 43: Italy Prefabricated Rubber Track Revenue (billion) Forecast, by Application 2020 & 2033
- Table 44: Italy Prefabricated Rubber Track Volume (K) Forecast, by Application 2020 & 2033
- Table 45: Spain Prefabricated Rubber Track Revenue (billion) Forecast, by Application 2020 & 2033
- Table 46: Spain Prefabricated Rubber Track Volume (K) Forecast, by Application 2020 & 2033
- Table 47: Russia Prefabricated Rubber Track Revenue (billion) Forecast, by Application 2020 & 2033
- Table 48: Russia Prefabricated Rubber Track Volume (K) Forecast, by Application 2020 & 2033
- Table 49: Benelux Prefabricated Rubber Track Revenue (billion) Forecast, by Application 2020 & 2033
- Table 50: Benelux Prefabricated Rubber Track Volume (K) Forecast, by Application 2020 & 2033
- Table 51: Nordics Prefabricated Rubber Track Revenue (billion) Forecast, by Application 2020 & 2033
- Table 52: Nordics Prefabricated Rubber Track Volume (K) Forecast, by Application 2020 & 2033
- Table 53: Rest of Europe Prefabricated Rubber Track Revenue (billion) Forecast, by Application 2020 & 2033
- Table 54: Rest of Europe Prefabricated Rubber Track Volume (K) Forecast, by Application 2020 & 2033
- Table 55: Global Prefabricated Rubber Track Revenue billion Forecast, by Application 2020 & 2033
- Table 56: Global Prefabricated Rubber Track Volume K Forecast, by Application 2020 & 2033
- Table 57: Global Prefabricated Rubber Track Revenue billion Forecast, by Type 2020 & 2033
- Table 58: Global Prefabricated Rubber Track Volume K Forecast, by Type 2020 & 2033
- Table 59: Global Prefabricated Rubber Track Revenue billion Forecast, by Country 2020 & 2033
- Table 60: Global Prefabricated Rubber Track Volume K Forecast, by Country 2020 & 2033
- Table 61: Turkey Prefabricated Rubber Track Revenue (billion) Forecast, by Application 2020 & 2033
- Table 62: Turkey Prefabricated Rubber Track Volume (K) Forecast, by Application 2020 & 2033
- Table 63: Israel Prefabricated Rubber Track Revenue (billion) Forecast, by Application 2020 & 2033
- Table 64: Israel Prefabricated Rubber Track Volume (K) Forecast, by Application 2020 & 2033
- Table 65: GCC Prefabricated Rubber Track Revenue (billion) Forecast, by Application 2020 & 2033
- Table 66: GCC Prefabricated Rubber Track Volume (K) Forecast, by Application 2020 & 2033
- Table 67: North Africa Prefabricated Rubber Track Revenue (billion) Forecast, by Application 2020 & 2033
- Table 68: North Africa Prefabricated Rubber Track Volume (K) Forecast, by Application 2020 & 2033
- Table 69: South Africa Prefabricated Rubber Track Revenue (billion) Forecast, by Application 2020 & 2033
- Table 70: South Africa Prefabricated Rubber Track Volume (K) Forecast, by Application 2020 & 2033
- Table 71: Rest of Middle East & Africa Prefabricated Rubber Track Revenue (billion) Forecast, by Application 2020 & 2033
- Table 72: Rest of Middle East & Africa Prefabricated Rubber Track Volume (K) Forecast, by Application 2020 & 2033
- Table 73: Global Prefabricated Rubber Track Revenue billion Forecast, by Application 2020 & 2033
- Table 74: Global Prefabricated Rubber Track Volume K Forecast, by Application 2020 & 2033
- Table 75: Global Prefabricated Rubber Track Revenue billion Forecast, by Type 2020 & 2033
- Table 76: Global Prefabricated Rubber Track Volume K Forecast, by Type 2020 & 2033
- Table 77: Global Prefabricated Rubber Track Revenue billion Forecast, by Country 2020 & 2033
- Table 78: Global Prefabricated Rubber Track Volume K Forecast, by Country 2020 & 2033
- Table 79: China Prefabricated Rubber Track Revenue (billion) Forecast, by Application 2020 & 2033
- Table 80: China Prefabricated Rubber Track Volume (K) Forecast, by Application 2020 & 2033
- Table 81: India Prefabricated Rubber Track Revenue (billion) Forecast, by Application 2020 & 2033
- Table 82: India Prefabricated Rubber Track Volume (K) Forecast, by Application 2020 & 2033
- Table 83: Japan Prefabricated Rubber Track Revenue (billion) Forecast, by Application 2020 & 2033
- Table 84: Japan Prefabricated Rubber Track Volume (K) Forecast, by Application 2020 & 2033
- Table 85: South Korea Prefabricated Rubber Track Revenue (billion) Forecast, by Application 2020 & 2033
- Table 86: South Korea Prefabricated Rubber Track Volume (K) Forecast, by Application 2020 & 2033
- Table 87: ASEAN Prefabricated Rubber Track Revenue (billion) Forecast, by Application 2020 & 2033
- Table 88: ASEAN Prefabricated Rubber Track Volume (K) Forecast, by Application 2020 & 2033
- Table 89: Oceania Prefabricated Rubber Track Revenue (billion) Forecast, by Application 2020 & 2033
- Table 90: Oceania Prefabricated Rubber Track Volume (K) Forecast, by Application 2020 & 2033
- Table 91: Rest of Asia Pacific Prefabricated Rubber Track Revenue (billion) Forecast, by Application 2020 & 2033
- Table 92: Rest of Asia Pacific Prefabricated Rubber Track Volume (K) Forecast, by Application 2020 & 2033
Frequently Asked Questions
1. What is the projected Compound Annual Growth Rate (CAGR) of the Prefabricated Rubber Track?
The projected CAGR is approximately 4.6%.
2. Which companies are prominent players in the Prefabricated Rubber Track?
Key companies in the market include MONDO, Flystep, ZSFloor Tech, REGUPOL, BRISPAN, ENLIO, Huadong Track, Nanjing Feeling, Sansu Sport, Asher Sports, Topthink, Fastto Sport, Tianjin NWT Sports, Huanteng Rubber And Plastic Products, Shengli Sports, Tianjin Dingxing Rubber & Plastic.
3. What are the main segments of the Prefabricated Rubber Track?
The market segments include Application, Type.
4. Can you provide details about the market size?
The market size is estimated to be USD 1.04 billion as of 2022.
5. What are some drivers contributing to market growth?
N/A
6. What are the notable trends driving market growth?
N/A
7. Are there any restraints impacting market growth?
N/A
8. Can you provide examples of recent developments in the market?
N/A
9. What pricing options are available for accessing the report?
Pricing options include single-user, multi-user, and enterprise licenses priced at USD 3950.00, USD 5925.00, and USD 7900.00 respectively.
10. Is the market size provided in terms of value or volume?
The market size is provided in terms of value, measured in billion and volume, measured in K.
11. Are there any specific market keywords associated with the report?
Yes, the market keyword associated with the report is "Prefabricated Rubber Track," which aids in identifying and referencing the specific market segment covered.
12. How do I determine which pricing option suits my needs best?
The pricing options vary based on user requirements and access needs. Individual users may opt for single-user licenses, while businesses requiring broader access may choose multi-user or enterprise licenses for cost-effective access to the report.
13. Are there any additional resources or data provided in the Prefabricated Rubber Track report?
While the report offers comprehensive insights, it's advisable to review the specific contents or supplementary materials provided to ascertain if additional resources or data are available.
14. How can I stay updated on further developments or reports in the Prefabricated Rubber Track?
To stay informed about further developments, trends, and reports in the Prefabricated Rubber Track, consider subscribing to industry newsletters, following relevant companies and organizations, or regularly checking reputable industry news sources and publications.
Methodology
Step 1 - Identification of Relevant Samples Size from Population Database


Step 2 - Approaches for Defining Global Market Size (Value, Volume* & Price*)

Note*: In applicable scenarios
Step 3 - Data Sources
Primary Research
- Web Analytics
- Survey Reports
- Research Institute
- Latest Research Reports
- Opinion Leaders
Secondary Research
- Annual Reports
- White Paper
- Latest Press Release
- Industry Association
- Paid Database
- Investor Presentations

Step 4 - Data Triangulation
Involves using different sources of information in order to increase the validity of a study
These sources are likely to be stakeholders in a program - participants, other researchers, program staff, other community members, and so on.
Then we put all data in single framework & apply various statistical tools to find out the dynamic on the market.
During the analysis stage, feedback from the stakeholder groups would be compared to determine areas of agreement as well as areas of divergence

