
Key Insights
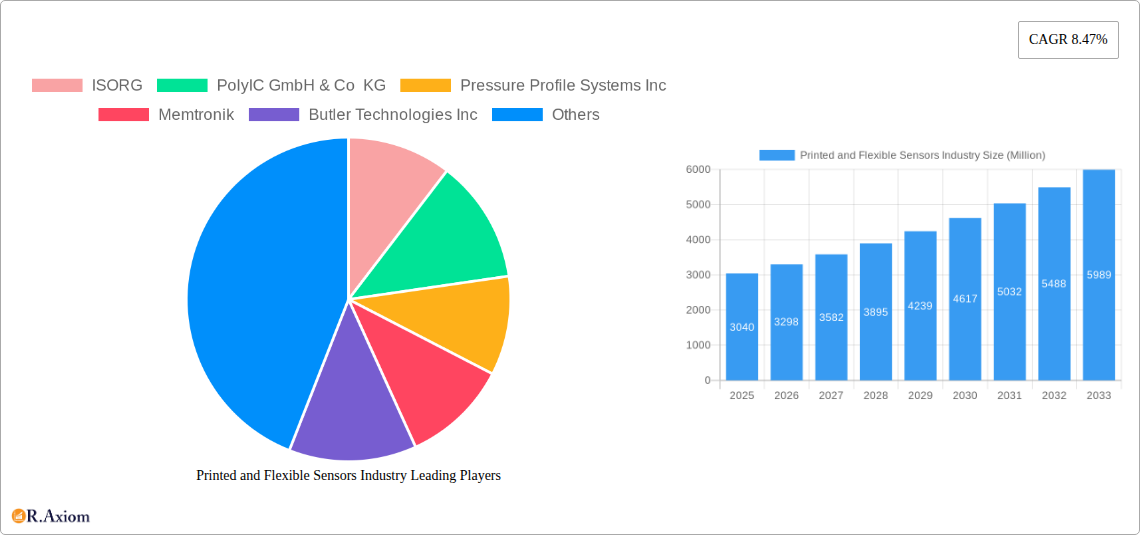
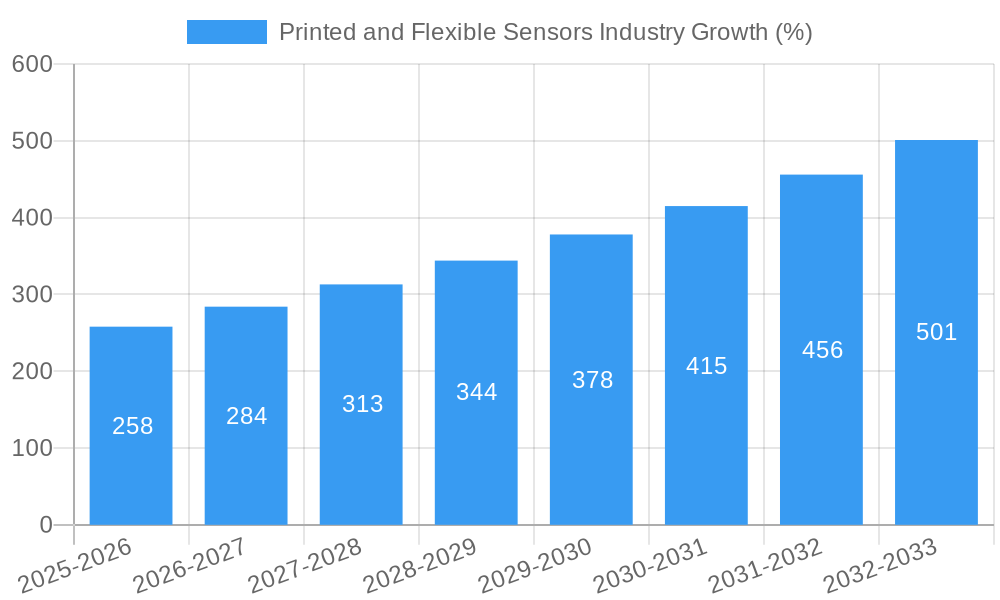
The printed and flexible sensors market is experiencing robust growth, projected to reach a market size of $3.04 billion in 2025 and maintain a compound annual growth rate (CAGR) of 8.47% from 2025 to 2033. This expansion is driven by several key factors. The increasing demand for miniaturization and improved performance in consumer electronics, particularly wearables and smart devices, is a significant driver. The automotive industry's adoption of advanced driver-assistance systems (ADAS) and electric vehicles (EVs) also fuels market growth, as flexible sensors are crucial for safety and performance monitoring. Furthermore, the healthcare sector's increasing use of wearable health monitors and implantable medical devices is creating significant opportunities. The diverse applications of these sensors across various end-user segments contribute to the market's overall expansion. Technological advancements leading to higher sensitivity, improved durability, and lower manufacturing costs are further accelerating market penetration.
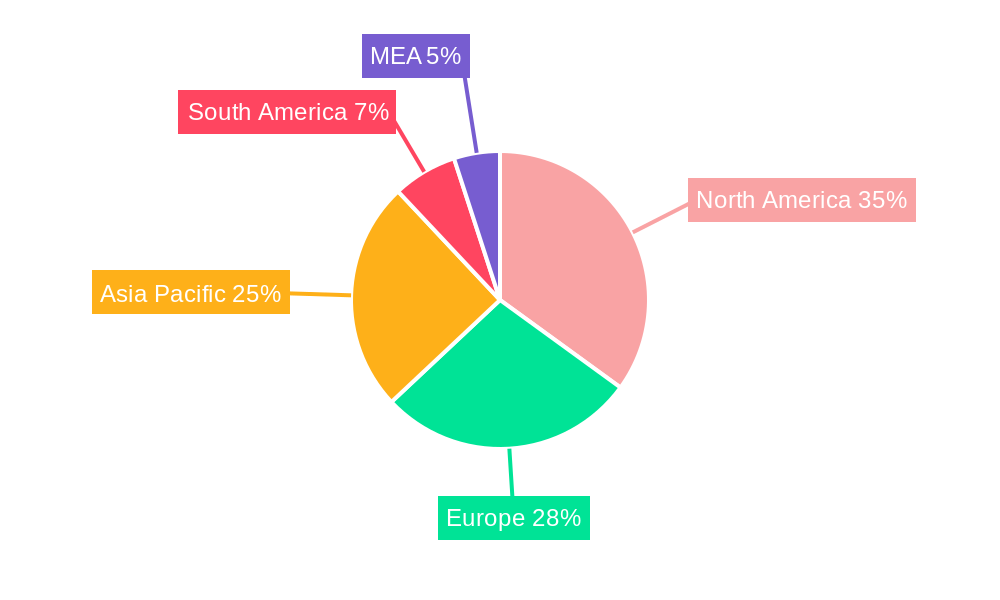
However, challenges remain. High initial investment costs for manufacturing facilities and equipment can present a barrier to entry for smaller players. The need for robust quality control and testing procedures to ensure reliability and longevity is another important factor. Competition from traditional rigid sensor technologies remains, although the advantages offered by flexibility and conformability in specific applications are gradually outweighing this challenge. Nevertheless, ongoing innovation in materials science and manufacturing processes is expected to mitigate these constraints and further propel market growth, particularly in niche applications within the medical, aerospace, and industrial sectors. Regional growth will be influenced by factors such as government regulations, technological infrastructure, and the rate of technological adoption, with North America and Asia Pacific expected to lead the market.
Printed and Flexible Sensors Industry: A Comprehensive Market Report (2019-2033)
This detailed report provides a comprehensive analysis of the Printed and Flexible Sensors industry, offering invaluable insights for stakeholders, investors, and industry professionals. With a study period spanning 2019-2033, a base year of 2025, and a forecast period of 2025-2033, this report leverages extensive market research to deliver actionable intelligence. The market size is expected to reach xx Million by 2033, exhibiting a robust CAGR of xx% during the forecast period.
Printed and Flexible Sensors Industry Market Concentration & Innovation
This section analyzes the competitive landscape, innovation drivers, and regulatory influences shaping the Printed and Flexible Sensors market. The industry exhibits a moderately concentrated structure, with key players such as ISORG, PolyIC GmbH & Co KG, and Tekscan Inc holding significant market share. However, the presence of numerous smaller, specialized companies fosters innovation and competition. Market share data for 2024 indicates that the top 5 players collectively hold approximately xx% of the market, while the remaining xx% is distributed among numerous smaller participants.
- Innovation Drivers: Miniaturization, improved sensitivity, enhanced flexibility, and integration with advanced materials are key innovation drivers.
- Regulatory Frameworks: Stringent regulations concerning safety and performance, particularly in medical and automotive applications, significantly impact industry growth.
- Product Substitutes: Traditional rigid sensors pose a competitive threat, though the advantages of flexibility and cost-effectiveness for printed sensors are driving market shift.
- End-User Trends: Increasing demand for wearable electronics, advanced medical devices, and smart vehicles fuels market growth across diverse end-user segments.
- M&A Activities: The past five years have witnessed several strategic mergers and acquisitions, with deal values totaling approximately xx Million, indicating industry consolidation and expansion.
Printed and Flexible Sensors Industry Industry Trends & Insights
The Printed and Flexible Sensors market is characterized by strong growth, driven by advancements in materials science, printing technologies, and rising demand across various sectors. The market witnessed a significant expansion during the historical period (2019-2024), registering a CAGR of xx%. This upward trend is expected to continue throughout the forecast period (2025-2033), fueled by technological innovations and increasing adoption across diverse applications. Market penetration remains relatively high in established sectors like consumer electronics, while significant growth opportunities exist in emerging areas such as medical diagnostics and smart agriculture. The increasing integration of printed sensors into Internet of Things (IoT) applications further contributes to market expansion. Competitive dynamics are intense, with established players focusing on product differentiation and technological advancements, while new entrants are emerging with innovative solutions and cost-effective manufacturing processes.
Dominant Markets & Segments in Printed and Flexible Sensors Industry
The global Printed and Flexible Sensors market is geographically diverse, with significant regional variations in growth rates and market size. North America currently dominates the market, primarily driven by strong demand in the automotive, consumer electronics, and medical sectors. However, the Asia-Pacific region is expected to experience the fastest growth, fueled by rapid industrialization, rising disposable incomes, and substantial investments in electronic manufacturing. The European market also displays robust growth, underpinned by stringent environmental regulations and a focus on technological advancement.
Dominant Segments (By Type):
- Pressure Sensors: This segment holds the largest market share due to widespread applications in various industries, including automotive, medical, and industrial automation.
- Touch Sensors: The high demand for touchscreens in consumer electronics significantly contributes to the growth of this segment.
- Biosensors: This segment is witnessing rapid expansion due to the growing demand for point-of-care diagnostics and wearable health monitoring devices.
Dominant Segments (By End User):
- Consumer Electronics: This segment exhibits the highest market share, propelled by the widespread use of touchscreens and other sensor-integrated devices.
- Automotive: The rising adoption of advanced driver-assistance systems (ADAS) and the increasing need for enhanced vehicle safety features fuels robust growth in this segment.
- Medical and Healthcare: The sector's rapid expansion is fueled by the demand for minimally invasive diagnostic tools, wearable health monitoring devices, and advanced medical implants.
Key Drivers:
- North America: Strong government support for technological innovation, a robust automotive industry, and a well-established medical device market.
- Asia-Pacific: Rapid industrialization, growing disposable incomes, a large consumer base, and significant investments in electronics manufacturing.
- Europe: Stringent environmental regulations, a focus on sustainable technologies, and strong government support for research and development.
Printed and Flexible Sensors Industry Product Developments
Recent advancements in printed and flexible sensors are focusing on enhancing sensitivity, reducing production costs, and expanding application possibilities. New materials, such as graphene and carbon nanotubes, are improving sensor performance. Moreover, the integration of advanced manufacturing techniques like inkjet printing and screen printing is enabling high-volume production at reduced costs. These improvements are widening sensor applications across various sectors, driving significant market growth.
Report Scope & Segmentation Analysis
This report offers a comprehensive segmentation of the Printed and Flexible Sensors market, categorized by type (Biosensor, Touch Sensor, Photodetectors, Temperature Sensor, Pressure Sensors, Other Types) and end-user (Automotive, Consumer Electronics, Medical and Healthcare, Defense and Aerospace, Other End Users). Each segment is analyzed based on its current market size, projected growth rate, and competitive dynamics. The report provides detailed insights into market share, competitive landscape, and growth drivers for each segment, enabling strategic decision-making for businesses operating in this dynamic industry.
Key Drivers of Printed and Flexible Sensors Industry Growth
Several factors are driving the growth of the Printed and Flexible Sensors industry. Technological advancements, such as the development of new materials and printing techniques, are leading to improved sensor performance and reduced costs. The increasing demand for wearable electronics, smart devices, and advanced medical applications is fueling significant market expansion. Furthermore, supportive government policies and initiatives aimed at promoting technological innovation are encouraging investments in this field.
Challenges in the Printed and Flexible Sensors Industry Sector
Despite the significant growth potential, the Printed and Flexible Sensors industry faces certain challenges. Maintaining consistent sensor quality and reliability throughout mass production remains a significant hurdle. Supply chain disruptions, particularly in the availability of specialized materials, can impact production timelines and costs. Intense competition from established sensor manufacturers and emerging startups also poses a challenge.
Emerging Opportunities in Printed and Flexible Sensors Industry
The Printed and Flexible Sensors industry presents several exciting opportunities. The growing demand for smart packaging, environmental monitoring solutions, and advanced healthcare diagnostics presents significant market potential. The integration of printed sensors into the Internet of Things (IoT) is driving innovation and creating new applications across multiple sectors. Furthermore, the development of new materials with enhanced sensitivity and durability opens doors for further advancements and market expansion.
Leading Players in the Printed and Flexible Sensors Industry Market
- ISORG
- PolyIC GmbH & Co KG
- Pressure Profile Systems Inc
- Memtronik
- Butler Technologies Inc
- E2IP Technologies
- Linepro Controls Pvt Ltd
- PST Sensors
- Tekscan Inc
- Forciot
- Quad Industries
- Brewer Science
- Nissha Co Lt
- Canatu Oy
Key Developments in Printed and Flexible Sensors Industry Industry
- February 2023: Quad Industries showcased new developments in capacitive touch controls, medical electrode patches, printed flexible circuits, pressure sensors, and stretchable film heaters at LOPEC 2023. This highlights the ongoing innovation and diversification within the industry.
- March 2023: Tekscan launched the High-Speed TireScan system, enabling precise monitoring of tire pressure at high speeds. This development signifies advancements in sensor technology for the automotive industry.
Strategic Outlook for Printed and Flexible Sensors Industry Market
The Printed and Flexible Sensors market is poised for significant growth over the next decade. Continuous technological advancements, expanding applications across various sectors, and increasing government support will drive market expansion. Companies focused on innovation, cost optimization, and strategic partnerships are best positioned to capitalize on the emerging opportunities in this dynamic industry.
Printed and Flexible Sensors Industry Segmentation
-
1. Type
- 1.1. Biosensor
- 1.2. Touch Sensor
- 1.3. Photodetectors
- 1.4. Temperature Sensor
- 1.5. Pressure Sensor
- 1.6. Other Types
-
2. End-user Industry
- 2.1. Automotive
- 2.2. Consumer Electronics
- 2.3. Medical and Healthcare
- 2.4. Defense and Aerospace
- 2.5. Other End-user Industries
Printed and Flexible Sensors Industry Segmentation By Geography
- 1. North America
- 2. Europe
- 3. Asia
- 4. Australia and New Zealand
- 5. Latin America
- 6. Middle East and Africa
Printed and Flexible Sensors Industry REPORT HIGHLIGHTS
| Aspects | Details |
|---|---|
| Study Period | 2019-2033 |
| Base Year | 2024 |
| Estimated Year | 2025 |
| Forecast Period | 2025-2033 |
| Historical Period | 2019-2024 |
| Growth Rate | CAGR of 8.47% from 2019-2033 |
| Segmentation |
|
Table of Contents
- 1. Introduction
- 1.1. Research Scope
- 1.2. Market Segmentation
- 1.3. Research Methodology
- 1.4. Definitions and Assumptions
- 2. Executive Summary
- 2.1. Introduction
- 3. Market Dynamics
- 3.1. Introduction
- 3.2. Market Drivers
- 3.2.1 Progression in Demand for Energy-efficient
- 3.2.2 Thin
- 3.2.3 and Flexible Consumer Electronics Products; Rising Integration of Printed Sensors in Medical Wearable Devices
- 3.3. Market Restrains
- 3.3.1. Requirement of Technological Improvements for Wider Adoption
- 3.4. Market Trends
- 3.4.1. Medical and Healthcare to Witness the Growth
- 4. Market Factor Analysis
- 4.1. Porters Five Forces
- 4.2. Supply/Value Chain
- 4.3. PESTEL analysis
- 4.4. Market Entropy
- 4.5. Patent/Trademark Analysis
- 5. Global Printed and Flexible Sensors Industry Analysis, Insights and Forecast, 2019-2031
- 5.1. Market Analysis, Insights and Forecast - by Type
- 5.1.1. Biosensor
- 5.1.2. Touch Sensor
- 5.1.3. Photodetectors
- 5.1.4. Temperature Sensor
- 5.1.5. Pressure Sensor
- 5.1.6. Other Types
- 5.2. Market Analysis, Insights and Forecast - by End-user Industry
- 5.2.1. Automotive
- 5.2.2. Consumer Electronics
- 5.2.3. Medical and Healthcare
- 5.2.4. Defense and Aerospace
- 5.2.5. Other End-user Industries
- 5.3. Market Analysis, Insights and Forecast - by Region
- 5.3.1. North America
- 5.3.2. Europe
- 5.3.3. Asia
- 5.3.4. Australia and New Zealand
- 5.3.5. Latin America
- 5.3.6. Middle East and Africa
- 5.1. Market Analysis, Insights and Forecast - by Type
- 6. North America Printed and Flexible Sensors Industry Analysis, Insights and Forecast, 2019-2031
- 6.1. Market Analysis, Insights and Forecast - by Type
- 6.1.1. Biosensor
- 6.1.2. Touch Sensor
- 6.1.3. Photodetectors
- 6.1.4. Temperature Sensor
- 6.1.5. Pressure Sensor
- 6.1.6. Other Types
- 6.2. Market Analysis, Insights and Forecast - by End-user Industry
- 6.2.1. Automotive
- 6.2.2. Consumer Electronics
- 6.2.3. Medical and Healthcare
- 6.2.4. Defense and Aerospace
- 6.2.5. Other End-user Industries
- 6.1. Market Analysis, Insights and Forecast - by Type
- 7. Europe Printed and Flexible Sensors Industry Analysis, Insights and Forecast, 2019-2031
- 7.1. Market Analysis, Insights and Forecast - by Type
- 7.1.1. Biosensor
- 7.1.2. Touch Sensor
- 7.1.3. Photodetectors
- 7.1.4. Temperature Sensor
- 7.1.5. Pressure Sensor
- 7.1.6. Other Types
- 7.2. Market Analysis, Insights and Forecast - by End-user Industry
- 7.2.1. Automotive
- 7.2.2. Consumer Electronics
- 7.2.3. Medical and Healthcare
- 7.2.4. Defense and Aerospace
- 7.2.5. Other End-user Industries
- 7.1. Market Analysis, Insights and Forecast - by Type
- 8. Asia Printed and Flexible Sensors Industry Analysis, Insights and Forecast, 2019-2031
- 8.1. Market Analysis, Insights and Forecast - by Type
- 8.1.1. Biosensor
- 8.1.2. Touch Sensor
- 8.1.3. Photodetectors
- 8.1.4. Temperature Sensor
- 8.1.5. Pressure Sensor
- 8.1.6. Other Types
- 8.2. Market Analysis, Insights and Forecast - by End-user Industry
- 8.2.1. Automotive
- 8.2.2. Consumer Electronics
- 8.2.3. Medical and Healthcare
- 8.2.4. Defense and Aerospace
- 8.2.5. Other End-user Industries
- 8.1. Market Analysis, Insights and Forecast - by Type
- 9. Australia and New Zealand Printed and Flexible Sensors Industry Analysis, Insights and Forecast, 2019-2031
- 9.1. Market Analysis, Insights and Forecast - by Type
- 9.1.1. Biosensor
- 9.1.2. Touch Sensor
- 9.1.3. Photodetectors
- 9.1.4. Temperature Sensor
- 9.1.5. Pressure Sensor
- 9.1.6. Other Types
- 9.2. Market Analysis, Insights and Forecast - by End-user Industry
- 9.2.1. Automotive
- 9.2.2. Consumer Electronics
- 9.2.3. Medical and Healthcare
- 9.2.4. Defense and Aerospace
- 9.2.5. Other End-user Industries
- 9.1. Market Analysis, Insights and Forecast - by Type
- 10. Latin America Printed and Flexible Sensors Industry Analysis, Insights and Forecast, 2019-2031
- 10.1. Market Analysis, Insights and Forecast - by Type
- 10.1.1. Biosensor
- 10.1.2. Touch Sensor
- 10.1.3. Photodetectors
- 10.1.4. Temperature Sensor
- 10.1.5. Pressure Sensor
- 10.1.6. Other Types
- 10.2. Market Analysis, Insights and Forecast - by End-user Industry
- 10.2.1. Automotive
- 10.2.2. Consumer Electronics
- 10.2.3. Medical and Healthcare
- 10.2.4. Defense and Aerospace
- 10.2.5. Other End-user Industries
- 10.1. Market Analysis, Insights and Forecast - by Type
- 11. Middle East and Africa Printed and Flexible Sensors Industry Analysis, Insights and Forecast, 2019-2031
- 11.1. Market Analysis, Insights and Forecast - by Type
- 11.1.1. Biosensor
- 11.1.2. Touch Sensor
- 11.1.3. Photodetectors
- 11.1.4. Temperature Sensor
- 11.1.5. Pressure Sensor
- 11.1.6. Other Types
- 11.2. Market Analysis, Insights and Forecast - by End-user Industry
- 11.2.1. Automotive
- 11.2.2. Consumer Electronics
- 11.2.3. Medical and Healthcare
- 11.2.4. Defense and Aerospace
- 11.2.5. Other End-user Industries
- 11.1. Market Analysis, Insights and Forecast - by Type
- 12. North America Printed and Flexible Sensors Industry Analysis, Insights and Forecast, 2019-2031
- 12.1. Market Analysis, Insights and Forecast - By Country/Sub-region
- 12.1.1 United States
- 12.1.2 Canada
- 12.1.3 Mexico
- 13. Europe Printed and Flexible Sensors Industry Analysis, Insights and Forecast, 2019-2031
- 13.1. Market Analysis, Insights and Forecast - By Country/Sub-region
- 13.1.1 Germany
- 13.1.2 United Kingdom
- 13.1.3 France
- 13.1.4 Spain
- 13.1.5 Italy
- 13.1.6 Spain
- 13.1.7 Belgium
- 13.1.8 Netherland
- 13.1.9 Nordics
- 13.1.10 Rest of Europe
- 14. Asia Pacific Printed and Flexible Sensors Industry Analysis, Insights and Forecast, 2019-2031
- 14.1. Market Analysis, Insights and Forecast - By Country/Sub-region
- 14.1.1 China
- 14.1.2 Japan
- 14.1.3 India
- 14.1.4 South Korea
- 14.1.5 Southeast Asia
- 14.1.6 Australia
- 14.1.7 Indonesia
- 14.1.8 Phillipes
- 14.1.9 Singapore
- 14.1.10 Thailandc
- 14.1.11 Rest of Asia Pacific
- 15. South America Printed and Flexible Sensors Industry Analysis, Insights and Forecast, 2019-2031
- 15.1. Market Analysis, Insights and Forecast - By Country/Sub-region
- 15.1.1 Brazil
- 15.1.2 Argentina
- 15.1.3 Peru
- 15.1.4 Chile
- 15.1.5 Colombia
- 15.1.6 Ecuador
- 15.1.7 Venezuela
- 15.1.8 Rest of South America
- 16. North America Printed and Flexible Sensors Industry Analysis, Insights and Forecast, 2019-2031
- 16.1. Market Analysis, Insights and Forecast - By Country/Sub-region
- 16.1.1 United States
- 16.1.2 Canada
- 16.1.3 Mexico
- 17. MEA Printed and Flexible Sensors Industry Analysis, Insights and Forecast, 2019-2031
- 17.1. Market Analysis, Insights and Forecast - By Country/Sub-region
- 17.1.1 United Arab Emirates
- 17.1.2 Saudi Arabia
- 17.1.3 South Africa
- 17.1.4 Rest of Middle East and Africa
- 18. Competitive Analysis
- 18.1. Global Market Share Analysis 2024
- 18.2. Company Profiles
- 18.2.1 ISORG
- 18.2.1.1. Overview
- 18.2.1.2. Products
- 18.2.1.3. SWOT Analysis
- 18.2.1.4. Recent Developments
- 18.2.1.5. Financials (Based on Availability)
- 18.2.2 PolyIC GmbH & Co KG
- 18.2.2.1. Overview
- 18.2.2.2. Products
- 18.2.2.3. SWOT Analysis
- 18.2.2.4. Recent Developments
- 18.2.2.5. Financials (Based on Availability)
- 18.2.3 Pressure Profile Systems Inc
- 18.2.3.1. Overview
- 18.2.3.2. Products
- 18.2.3.3. SWOT Analysis
- 18.2.3.4. Recent Developments
- 18.2.3.5. Financials (Based on Availability)
- 18.2.4 Memtronik
- 18.2.4.1. Overview
- 18.2.4.2. Products
- 18.2.4.3. SWOT Analysis
- 18.2.4.4. Recent Developments
- 18.2.4.5. Financials (Based on Availability)
- 18.2.5 Butler Technologies Inc
- 18.2.5.1. Overview
- 18.2.5.2. Products
- 18.2.5.3. SWOT Analysis
- 18.2.5.4. Recent Developments
- 18.2.5.5. Financials (Based on Availability)
- 18.2.6 E2IP Technologies
- 18.2.6.1. Overview
- 18.2.6.2. Products
- 18.2.6.3. SWOT Analysis
- 18.2.6.4. Recent Developments
- 18.2.6.5. Financials (Based on Availability)
- 18.2.7 Linepro Controls Pvt Ltd
- 18.2.7.1. Overview
- 18.2.7.2. Products
- 18.2.7.3. SWOT Analysis
- 18.2.7.4. Recent Developments
- 18.2.7.5. Financials (Based on Availability)
- 18.2.8 PST Sensors
- 18.2.8.1. Overview
- 18.2.8.2. Products
- 18.2.8.3. SWOT Analysis
- 18.2.8.4. Recent Developments
- 18.2.8.5. Financials (Based on Availability)
- 18.2.9 Tekscan Inc
- 18.2.9.1. Overview
- 18.2.9.2. Products
- 18.2.9.3. SWOT Analysis
- 18.2.9.4. Recent Developments
- 18.2.9.5. Financials (Based on Availability)
- 18.2.10 Forciot
- 18.2.10.1. Overview
- 18.2.10.2. Products
- 18.2.10.3. SWOT Analysis
- 18.2.10.4. Recent Developments
- 18.2.10.5. Financials (Based on Availability)
- 18.2.11 Quad Industries
- 18.2.11.1. Overview
- 18.2.11.2. Products
- 18.2.11.3. SWOT Analysis
- 18.2.11.4. Recent Developments
- 18.2.11.5. Financials (Based on Availability)
- 18.2.12 Brewer Science
- 18.2.12.1. Overview
- 18.2.12.2. Products
- 18.2.12.3. SWOT Analysis
- 18.2.12.4. Recent Developments
- 18.2.12.5. Financials (Based on Availability)
- 18.2.13 Nissha Co Lt
- 18.2.13.1. Overview
- 18.2.13.2. Products
- 18.2.13.3. SWOT Analysis
- 18.2.13.4. Recent Developments
- 18.2.13.5. Financials (Based on Availability)
- 18.2.14 Canatu Oy
- 18.2.14.1. Overview
- 18.2.14.2. Products
- 18.2.14.3. SWOT Analysis
- 18.2.14.4. Recent Developments
- 18.2.14.5. Financials (Based on Availability)
- 18.2.1 ISORG
List of Figures
- Figure 1: Global Printed and Flexible Sensors Industry Revenue Breakdown (Million, %) by Region 2024 & 2032
- Figure 2: Global Printed and Flexible Sensors Industry Volume Breakdown (K Unit, %) by Region 2024 & 2032
- Figure 3: North America Printed and Flexible Sensors Industry Revenue (Million), by Country 2024 & 2032
- Figure 4: North America Printed and Flexible Sensors Industry Volume (K Unit), by Country 2024 & 2032
- Figure 5: North America Printed and Flexible Sensors Industry Revenue Share (%), by Country 2024 & 2032
- Figure 6: North America Printed and Flexible Sensors Industry Volume Share (%), by Country 2024 & 2032
- Figure 7: Europe Printed and Flexible Sensors Industry Revenue (Million), by Country 2024 & 2032
- Figure 8: Europe Printed and Flexible Sensors Industry Volume (K Unit), by Country 2024 & 2032
- Figure 9: Europe Printed and Flexible Sensors Industry Revenue Share (%), by Country 2024 & 2032
- Figure 10: Europe Printed and Flexible Sensors Industry Volume Share (%), by Country 2024 & 2032
- Figure 11: Asia Pacific Printed and Flexible Sensors Industry Revenue (Million), by Country 2024 & 2032
- Figure 12: Asia Pacific Printed and Flexible Sensors Industry Volume (K Unit), by Country 2024 & 2032
- Figure 13: Asia Pacific Printed and Flexible Sensors Industry Revenue Share (%), by Country 2024 & 2032
- Figure 14: Asia Pacific Printed and Flexible Sensors Industry Volume Share (%), by Country 2024 & 2032
- Figure 15: South America Printed and Flexible Sensors Industry Revenue (Million), by Country 2024 & 2032
- Figure 16: South America Printed and Flexible Sensors Industry Volume (K Unit), by Country 2024 & 2032
- Figure 17: South America Printed and Flexible Sensors Industry Revenue Share (%), by Country 2024 & 2032
- Figure 18: South America Printed and Flexible Sensors Industry Volume Share (%), by Country 2024 & 2032
- Figure 19: North America Printed and Flexible Sensors Industry Revenue (Million), by Country 2024 & 2032
- Figure 20: North America Printed and Flexible Sensors Industry Volume (K Unit), by Country 2024 & 2032
- Figure 21: North America Printed and Flexible Sensors Industry Revenue Share (%), by Country 2024 & 2032
- Figure 22: North America Printed and Flexible Sensors Industry Volume Share (%), by Country 2024 & 2032
- Figure 23: MEA Printed and Flexible Sensors Industry Revenue (Million), by Country 2024 & 2032
- Figure 24: MEA Printed and Flexible Sensors Industry Volume (K Unit), by Country 2024 & 2032
- Figure 25: MEA Printed and Flexible Sensors Industry Revenue Share (%), by Country 2024 & 2032
- Figure 26: MEA Printed and Flexible Sensors Industry Volume Share (%), by Country 2024 & 2032
- Figure 27: North America Printed and Flexible Sensors Industry Revenue (Million), by Type 2024 & 2032
- Figure 28: North America Printed and Flexible Sensors Industry Volume (K Unit), by Type 2024 & 2032
- Figure 29: North America Printed and Flexible Sensors Industry Revenue Share (%), by Type 2024 & 2032
- Figure 30: North America Printed and Flexible Sensors Industry Volume Share (%), by Type 2024 & 2032
- Figure 31: North America Printed and Flexible Sensors Industry Revenue (Million), by End-user Industry 2024 & 2032
- Figure 32: North America Printed and Flexible Sensors Industry Volume (K Unit), by End-user Industry 2024 & 2032
- Figure 33: North America Printed and Flexible Sensors Industry Revenue Share (%), by End-user Industry 2024 & 2032
- Figure 34: North America Printed and Flexible Sensors Industry Volume Share (%), by End-user Industry 2024 & 2032
- Figure 35: North America Printed and Flexible Sensors Industry Revenue (Million), by Country 2024 & 2032
- Figure 36: North America Printed and Flexible Sensors Industry Volume (K Unit), by Country 2024 & 2032
- Figure 37: North America Printed and Flexible Sensors Industry Revenue Share (%), by Country 2024 & 2032
- Figure 38: North America Printed and Flexible Sensors Industry Volume Share (%), by Country 2024 & 2032
- Figure 39: Europe Printed and Flexible Sensors Industry Revenue (Million), by Type 2024 & 2032
- Figure 40: Europe Printed and Flexible Sensors Industry Volume (K Unit), by Type 2024 & 2032
- Figure 41: Europe Printed and Flexible Sensors Industry Revenue Share (%), by Type 2024 & 2032
- Figure 42: Europe Printed and Flexible Sensors Industry Volume Share (%), by Type 2024 & 2032
- Figure 43: Europe Printed and Flexible Sensors Industry Revenue (Million), by End-user Industry 2024 & 2032
- Figure 44: Europe Printed and Flexible Sensors Industry Volume (K Unit), by End-user Industry 2024 & 2032
- Figure 45: Europe Printed and Flexible Sensors Industry Revenue Share (%), by End-user Industry 2024 & 2032
- Figure 46: Europe Printed and Flexible Sensors Industry Volume Share (%), by End-user Industry 2024 & 2032
- Figure 47: Europe Printed and Flexible Sensors Industry Revenue (Million), by Country 2024 & 2032
- Figure 48: Europe Printed and Flexible Sensors Industry Volume (K Unit), by Country 2024 & 2032
- Figure 49: Europe Printed and Flexible Sensors Industry Revenue Share (%), by Country 2024 & 2032
- Figure 50: Europe Printed and Flexible Sensors Industry Volume Share (%), by Country 2024 & 2032
- Figure 51: Asia Printed and Flexible Sensors Industry Revenue (Million), by Type 2024 & 2032
- Figure 52: Asia Printed and Flexible Sensors Industry Volume (K Unit), by Type 2024 & 2032
- Figure 53: Asia Printed and Flexible Sensors Industry Revenue Share (%), by Type 2024 & 2032
- Figure 54: Asia Printed and Flexible Sensors Industry Volume Share (%), by Type 2024 & 2032
- Figure 55: Asia Printed and Flexible Sensors Industry Revenue (Million), by End-user Industry 2024 & 2032
- Figure 56: Asia Printed and Flexible Sensors Industry Volume (K Unit), by End-user Industry 2024 & 2032
- Figure 57: Asia Printed and Flexible Sensors Industry Revenue Share (%), by End-user Industry 2024 & 2032
- Figure 58: Asia Printed and Flexible Sensors Industry Volume Share (%), by End-user Industry 2024 & 2032
- Figure 59: Asia Printed and Flexible Sensors Industry Revenue (Million), by Country 2024 & 2032
- Figure 60: Asia Printed and Flexible Sensors Industry Volume (K Unit), by Country 2024 & 2032
- Figure 61: Asia Printed and Flexible Sensors Industry Revenue Share (%), by Country 2024 & 2032
- Figure 62: Asia Printed and Flexible Sensors Industry Volume Share (%), by Country 2024 & 2032
- Figure 63: Australia and New Zealand Printed and Flexible Sensors Industry Revenue (Million), by Type 2024 & 2032
- Figure 64: Australia and New Zealand Printed and Flexible Sensors Industry Volume (K Unit), by Type 2024 & 2032
- Figure 65: Australia and New Zealand Printed and Flexible Sensors Industry Revenue Share (%), by Type 2024 & 2032
- Figure 66: Australia and New Zealand Printed and Flexible Sensors Industry Volume Share (%), by Type 2024 & 2032
- Figure 67: Australia and New Zealand Printed and Flexible Sensors Industry Revenue (Million), by End-user Industry 2024 & 2032
- Figure 68: Australia and New Zealand Printed and Flexible Sensors Industry Volume (K Unit), by End-user Industry 2024 & 2032
- Figure 69: Australia and New Zealand Printed and Flexible Sensors Industry Revenue Share (%), by End-user Industry 2024 & 2032
- Figure 70: Australia and New Zealand Printed and Flexible Sensors Industry Volume Share (%), by End-user Industry 2024 & 2032
- Figure 71: Australia and New Zealand Printed and Flexible Sensors Industry Revenue (Million), by Country 2024 & 2032
- Figure 72: Australia and New Zealand Printed and Flexible Sensors Industry Volume (K Unit), by Country 2024 & 2032
- Figure 73: Australia and New Zealand Printed and Flexible Sensors Industry Revenue Share (%), by Country 2024 & 2032
- Figure 74: Australia and New Zealand Printed and Flexible Sensors Industry Volume Share (%), by Country 2024 & 2032
- Figure 75: Latin America Printed and Flexible Sensors Industry Revenue (Million), by Type 2024 & 2032
- Figure 76: Latin America Printed and Flexible Sensors Industry Volume (K Unit), by Type 2024 & 2032
- Figure 77: Latin America Printed and Flexible Sensors Industry Revenue Share (%), by Type 2024 & 2032
- Figure 78: Latin America Printed and Flexible Sensors Industry Volume Share (%), by Type 2024 & 2032
- Figure 79: Latin America Printed and Flexible Sensors Industry Revenue (Million), by End-user Industry 2024 & 2032
- Figure 80: Latin America Printed and Flexible Sensors Industry Volume (K Unit), by End-user Industry 2024 & 2032
- Figure 81: Latin America Printed and Flexible Sensors Industry Revenue Share (%), by End-user Industry 2024 & 2032
- Figure 82: Latin America Printed and Flexible Sensors Industry Volume Share (%), by End-user Industry 2024 & 2032
- Figure 83: Latin America Printed and Flexible Sensors Industry Revenue (Million), by Country 2024 & 2032
- Figure 84: Latin America Printed and Flexible Sensors Industry Volume (K Unit), by Country 2024 & 2032
- Figure 85: Latin America Printed and Flexible Sensors Industry Revenue Share (%), by Country 2024 & 2032
- Figure 86: Latin America Printed and Flexible Sensors Industry Volume Share (%), by Country 2024 & 2032
- Figure 87: Middle East and Africa Printed and Flexible Sensors Industry Revenue (Million), by Type 2024 & 2032
- Figure 88: Middle East and Africa Printed and Flexible Sensors Industry Volume (K Unit), by Type 2024 & 2032
- Figure 89: Middle East and Africa Printed and Flexible Sensors Industry Revenue Share (%), by Type 2024 & 2032
- Figure 90: Middle East and Africa Printed and Flexible Sensors Industry Volume Share (%), by Type 2024 & 2032
- Figure 91: Middle East and Africa Printed and Flexible Sensors Industry Revenue (Million), by End-user Industry 2024 & 2032
- Figure 92: Middle East and Africa Printed and Flexible Sensors Industry Volume (K Unit), by End-user Industry 2024 & 2032
- Figure 93: Middle East and Africa Printed and Flexible Sensors Industry Revenue Share (%), by End-user Industry 2024 & 2032
- Figure 94: Middle East and Africa Printed and Flexible Sensors Industry Volume Share (%), by End-user Industry 2024 & 2032
- Figure 95: Middle East and Africa Printed and Flexible Sensors Industry Revenue (Million), by Country 2024 & 2032
- Figure 96: Middle East and Africa Printed and Flexible Sensors Industry Volume (K Unit), by Country 2024 & 2032
- Figure 97: Middle East and Africa Printed and Flexible Sensors Industry Revenue Share (%), by Country 2024 & 2032
- Figure 98: Middle East and Africa Printed and Flexible Sensors Industry Volume Share (%), by Country 2024 & 2032
List of Tables
- Table 1: Global Printed and Flexible Sensors Industry Revenue Million Forecast, by Region 2019 & 2032
- Table 2: Global Printed and Flexible Sensors Industry Volume K Unit Forecast, by Region 2019 & 2032
- Table 3: Global Printed and Flexible Sensors Industry Revenue Million Forecast, by Type 2019 & 2032
- Table 4: Global Printed and Flexible Sensors Industry Volume K Unit Forecast, by Type 2019 & 2032
- Table 5: Global Printed and Flexible Sensors Industry Revenue Million Forecast, by End-user Industry 2019 & 2032
- Table 6: Global Printed and Flexible Sensors Industry Volume K Unit Forecast, by End-user Industry 2019 & 2032
- Table 7: Global Printed and Flexible Sensors Industry Revenue Million Forecast, by Region 2019 & 2032
- Table 8: Global Printed and Flexible Sensors Industry Volume K Unit Forecast, by Region 2019 & 2032
- Table 9: Global Printed and Flexible Sensors Industry Revenue Million Forecast, by Country 2019 & 2032
- Table 10: Global Printed and Flexible Sensors Industry Volume K Unit Forecast, by Country 2019 & 2032
- Table 11: United States Printed and Flexible Sensors Industry Revenue (Million) Forecast, by Application 2019 & 2032
- Table 12: United States Printed and Flexible Sensors Industry Volume (K Unit) Forecast, by Application 2019 & 2032
- Table 13: Canada Printed and Flexible Sensors Industry Revenue (Million) Forecast, by Application 2019 & 2032
- Table 14: Canada Printed and Flexible Sensors Industry Volume (K Unit) Forecast, by Application 2019 & 2032
- Table 15: Mexico Printed and Flexible Sensors Industry Revenue (Million) Forecast, by Application 2019 & 2032
- Table 16: Mexico Printed and Flexible Sensors Industry Volume (K Unit) Forecast, by Application 2019 & 2032
- Table 17: Global Printed and Flexible Sensors Industry Revenue Million Forecast, by Country 2019 & 2032
- Table 18: Global Printed and Flexible Sensors Industry Volume K Unit Forecast, by Country 2019 & 2032
- Table 19: Germany Printed and Flexible Sensors Industry Revenue (Million) Forecast, by Application 2019 & 2032
- Table 20: Germany Printed and Flexible Sensors Industry Volume (K Unit) Forecast, by Application 2019 & 2032
- Table 21: United Kingdom Printed and Flexible Sensors Industry Revenue (Million) Forecast, by Application 2019 & 2032
- Table 22: United Kingdom Printed and Flexible Sensors Industry Volume (K Unit) Forecast, by Application 2019 & 2032
- Table 23: France Printed and Flexible Sensors Industry Revenue (Million) Forecast, by Application 2019 & 2032
- Table 24: France Printed and Flexible Sensors Industry Volume (K Unit) Forecast, by Application 2019 & 2032
- Table 25: Spain Printed and Flexible Sensors Industry Revenue (Million) Forecast, by Application 2019 & 2032
- Table 26: Spain Printed and Flexible Sensors Industry Volume (K Unit) Forecast, by Application 2019 & 2032
- Table 27: Italy Printed and Flexible Sensors Industry Revenue (Million) Forecast, by Application 2019 & 2032
- Table 28: Italy Printed and Flexible Sensors Industry Volume (K Unit) Forecast, by Application 2019 & 2032
- Table 29: Spain Printed and Flexible Sensors Industry Revenue (Million) Forecast, by Application 2019 & 2032
- Table 30: Spain Printed and Flexible Sensors Industry Volume (K Unit) Forecast, by Application 2019 & 2032
- Table 31: Belgium Printed and Flexible Sensors Industry Revenue (Million) Forecast, by Application 2019 & 2032
- Table 32: Belgium Printed and Flexible Sensors Industry Volume (K Unit) Forecast, by Application 2019 & 2032
- Table 33: Netherland Printed and Flexible Sensors Industry Revenue (Million) Forecast, by Application 2019 & 2032
- Table 34: Netherland Printed and Flexible Sensors Industry Volume (K Unit) Forecast, by Application 2019 & 2032
- Table 35: Nordics Printed and Flexible Sensors Industry Revenue (Million) Forecast, by Application 2019 & 2032
- Table 36: Nordics Printed and Flexible Sensors Industry Volume (K Unit) Forecast, by Application 2019 & 2032
- Table 37: Rest of Europe Printed and Flexible Sensors Industry Revenue (Million) Forecast, by Application 2019 & 2032
- Table 38: Rest of Europe Printed and Flexible Sensors Industry Volume (K Unit) Forecast, by Application 2019 & 2032
- Table 39: Global Printed and Flexible Sensors Industry Revenue Million Forecast, by Country 2019 & 2032
- Table 40: Global Printed and Flexible Sensors Industry Volume K Unit Forecast, by Country 2019 & 2032
- Table 41: China Printed and Flexible Sensors Industry Revenue (Million) Forecast, by Application 2019 & 2032
- Table 42: China Printed and Flexible Sensors Industry Volume (K Unit) Forecast, by Application 2019 & 2032
- Table 43: Japan Printed and Flexible Sensors Industry Revenue (Million) Forecast, by Application 2019 & 2032
- Table 44: Japan Printed and Flexible Sensors Industry Volume (K Unit) Forecast, by Application 2019 & 2032
- Table 45: India Printed and Flexible Sensors Industry Revenue (Million) Forecast, by Application 2019 & 2032
- Table 46: India Printed and Flexible Sensors Industry Volume (K Unit) Forecast, by Application 2019 & 2032
- Table 47: South Korea Printed and Flexible Sensors Industry Revenue (Million) Forecast, by Application 2019 & 2032
- Table 48: South Korea Printed and Flexible Sensors Industry Volume (K Unit) Forecast, by Application 2019 & 2032
- Table 49: Southeast Asia Printed and Flexible Sensors Industry Revenue (Million) Forecast, by Application 2019 & 2032
- Table 50: Southeast Asia Printed and Flexible Sensors Industry Volume (K Unit) Forecast, by Application 2019 & 2032
- Table 51: Australia Printed and Flexible Sensors Industry Revenue (Million) Forecast, by Application 2019 & 2032
- Table 52: Australia Printed and Flexible Sensors Industry Volume (K Unit) Forecast, by Application 2019 & 2032
- Table 53: Indonesia Printed and Flexible Sensors Industry Revenue (Million) Forecast, by Application 2019 & 2032
- Table 54: Indonesia Printed and Flexible Sensors Industry Volume (K Unit) Forecast, by Application 2019 & 2032
- Table 55: Phillipes Printed and Flexible Sensors Industry Revenue (Million) Forecast, by Application 2019 & 2032
- Table 56: Phillipes Printed and Flexible Sensors Industry Volume (K Unit) Forecast, by Application 2019 & 2032
- Table 57: Singapore Printed and Flexible Sensors Industry Revenue (Million) Forecast, by Application 2019 & 2032
- Table 58: Singapore Printed and Flexible Sensors Industry Volume (K Unit) Forecast, by Application 2019 & 2032
- Table 59: Thailandc Printed and Flexible Sensors Industry Revenue (Million) Forecast, by Application 2019 & 2032
- Table 60: Thailandc Printed and Flexible Sensors Industry Volume (K Unit) Forecast, by Application 2019 & 2032
- Table 61: Rest of Asia Pacific Printed and Flexible Sensors Industry Revenue (Million) Forecast, by Application 2019 & 2032
- Table 62: Rest of Asia Pacific Printed and Flexible Sensors Industry Volume (K Unit) Forecast, by Application 2019 & 2032
- Table 63: Global Printed and Flexible Sensors Industry Revenue Million Forecast, by Country 2019 & 2032
- Table 64: Global Printed and Flexible Sensors Industry Volume K Unit Forecast, by Country 2019 & 2032
- Table 65: Brazil Printed and Flexible Sensors Industry Revenue (Million) Forecast, by Application 2019 & 2032
- Table 66: Brazil Printed and Flexible Sensors Industry Volume (K Unit) Forecast, by Application 2019 & 2032
- Table 67: Argentina Printed and Flexible Sensors Industry Revenue (Million) Forecast, by Application 2019 & 2032
- Table 68: Argentina Printed and Flexible Sensors Industry Volume (K Unit) Forecast, by Application 2019 & 2032
- Table 69: Peru Printed and Flexible Sensors Industry Revenue (Million) Forecast, by Application 2019 & 2032
- Table 70: Peru Printed and Flexible Sensors Industry Volume (K Unit) Forecast, by Application 2019 & 2032
- Table 71: Chile Printed and Flexible Sensors Industry Revenue (Million) Forecast, by Application 2019 & 2032
- Table 72: Chile Printed and Flexible Sensors Industry Volume (K Unit) Forecast, by Application 2019 & 2032
- Table 73: Colombia Printed and Flexible Sensors Industry Revenue (Million) Forecast, by Application 2019 & 2032
- Table 74: Colombia Printed and Flexible Sensors Industry Volume (K Unit) Forecast, by Application 2019 & 2032
- Table 75: Ecuador Printed and Flexible Sensors Industry Revenue (Million) Forecast, by Application 2019 & 2032
- Table 76: Ecuador Printed and Flexible Sensors Industry Volume (K Unit) Forecast, by Application 2019 & 2032
- Table 77: Venezuela Printed and Flexible Sensors Industry Revenue (Million) Forecast, by Application 2019 & 2032
- Table 78: Venezuela Printed and Flexible Sensors Industry Volume (K Unit) Forecast, by Application 2019 & 2032
- Table 79: Rest of South America Printed and Flexible Sensors Industry Revenue (Million) Forecast, by Application 2019 & 2032
- Table 80: Rest of South America Printed and Flexible Sensors Industry Volume (K Unit) Forecast, by Application 2019 & 2032
- Table 81: Global Printed and Flexible Sensors Industry Revenue Million Forecast, by Country 2019 & 2032
- Table 82: Global Printed and Flexible Sensors Industry Volume K Unit Forecast, by Country 2019 & 2032
- Table 83: United States Printed and Flexible Sensors Industry Revenue (Million) Forecast, by Application 2019 & 2032
- Table 84: United States Printed and Flexible Sensors Industry Volume (K Unit) Forecast, by Application 2019 & 2032
- Table 85: Canada Printed and Flexible Sensors Industry Revenue (Million) Forecast, by Application 2019 & 2032
- Table 86: Canada Printed and Flexible Sensors Industry Volume (K Unit) Forecast, by Application 2019 & 2032
- Table 87: Mexico Printed and Flexible Sensors Industry Revenue (Million) Forecast, by Application 2019 & 2032
- Table 88: Mexico Printed and Flexible Sensors Industry Volume (K Unit) Forecast, by Application 2019 & 2032
- Table 89: Global Printed and Flexible Sensors Industry Revenue Million Forecast, by Country 2019 & 2032
- Table 90: Global Printed and Flexible Sensors Industry Volume K Unit Forecast, by Country 2019 & 2032
- Table 91: United Arab Emirates Printed and Flexible Sensors Industry Revenue (Million) Forecast, by Application 2019 & 2032
- Table 92: United Arab Emirates Printed and Flexible Sensors Industry Volume (K Unit) Forecast, by Application 2019 & 2032
- Table 93: Saudi Arabia Printed and Flexible Sensors Industry Revenue (Million) Forecast, by Application 2019 & 2032
- Table 94: Saudi Arabia Printed and Flexible Sensors Industry Volume (K Unit) Forecast, by Application 2019 & 2032
- Table 95: South Africa Printed and Flexible Sensors Industry Revenue (Million) Forecast, by Application 2019 & 2032
- Table 96: South Africa Printed and Flexible Sensors Industry Volume (K Unit) Forecast, by Application 2019 & 2032
- Table 97: Rest of Middle East and Africa Printed and Flexible Sensors Industry Revenue (Million) Forecast, by Application 2019 & 2032
- Table 98: Rest of Middle East and Africa Printed and Flexible Sensors Industry Volume (K Unit) Forecast, by Application 2019 & 2032
- Table 99: Global Printed and Flexible Sensors Industry Revenue Million Forecast, by Type 2019 & 2032
- Table 100: Global Printed and Flexible Sensors Industry Volume K Unit Forecast, by Type 2019 & 2032
- Table 101: Global Printed and Flexible Sensors Industry Revenue Million Forecast, by End-user Industry 2019 & 2032
- Table 102: Global Printed and Flexible Sensors Industry Volume K Unit Forecast, by End-user Industry 2019 & 2032
- Table 103: Global Printed and Flexible Sensors Industry Revenue Million Forecast, by Country 2019 & 2032
- Table 104: Global Printed and Flexible Sensors Industry Volume K Unit Forecast, by Country 2019 & 2032
- Table 105: Global Printed and Flexible Sensors Industry Revenue Million Forecast, by Type 2019 & 2032
- Table 106: Global Printed and Flexible Sensors Industry Volume K Unit Forecast, by Type 2019 & 2032
- Table 107: Global Printed and Flexible Sensors Industry Revenue Million Forecast, by End-user Industry 2019 & 2032
- Table 108: Global Printed and Flexible Sensors Industry Volume K Unit Forecast, by End-user Industry 2019 & 2032
- Table 109: Global Printed and Flexible Sensors Industry Revenue Million Forecast, by Country 2019 & 2032
- Table 110: Global Printed and Flexible Sensors Industry Volume K Unit Forecast, by Country 2019 & 2032
- Table 111: Global Printed and Flexible Sensors Industry Revenue Million Forecast, by Type 2019 & 2032
- Table 112: Global Printed and Flexible Sensors Industry Volume K Unit Forecast, by Type 2019 & 2032
- Table 113: Global Printed and Flexible Sensors Industry Revenue Million Forecast, by End-user Industry 2019 & 2032
- Table 114: Global Printed and Flexible Sensors Industry Volume K Unit Forecast, by End-user Industry 2019 & 2032
- Table 115: Global Printed and Flexible Sensors Industry Revenue Million Forecast, by Country 2019 & 2032
- Table 116: Global Printed and Flexible Sensors Industry Volume K Unit Forecast, by Country 2019 & 2032
- Table 117: Global Printed and Flexible Sensors Industry Revenue Million Forecast, by Type 2019 & 2032
- Table 118: Global Printed and Flexible Sensors Industry Volume K Unit Forecast, by Type 2019 & 2032
- Table 119: Global Printed and Flexible Sensors Industry Revenue Million Forecast, by End-user Industry 2019 & 2032
- Table 120: Global Printed and Flexible Sensors Industry Volume K Unit Forecast, by End-user Industry 2019 & 2032
- Table 121: Global Printed and Flexible Sensors Industry Revenue Million Forecast, by Country 2019 & 2032
- Table 122: Global Printed and Flexible Sensors Industry Volume K Unit Forecast, by Country 2019 & 2032
- Table 123: Global Printed and Flexible Sensors Industry Revenue Million Forecast, by Type 2019 & 2032
- Table 124: Global Printed and Flexible Sensors Industry Volume K Unit Forecast, by Type 2019 & 2032
- Table 125: Global Printed and Flexible Sensors Industry Revenue Million Forecast, by End-user Industry 2019 & 2032
- Table 126: Global Printed and Flexible Sensors Industry Volume K Unit Forecast, by End-user Industry 2019 & 2032
- Table 127: Global Printed and Flexible Sensors Industry Revenue Million Forecast, by Country 2019 & 2032
- Table 128: Global Printed and Flexible Sensors Industry Volume K Unit Forecast, by Country 2019 & 2032
- Table 129: Global Printed and Flexible Sensors Industry Revenue Million Forecast, by Type 2019 & 2032
- Table 130: Global Printed and Flexible Sensors Industry Volume K Unit Forecast, by Type 2019 & 2032
- Table 131: Global Printed and Flexible Sensors Industry Revenue Million Forecast, by End-user Industry 2019 & 2032
- Table 132: Global Printed and Flexible Sensors Industry Volume K Unit Forecast, by End-user Industry 2019 & 2032
- Table 133: Global Printed and Flexible Sensors Industry Revenue Million Forecast, by Country 2019 & 2032
- Table 134: Global Printed and Flexible Sensors Industry Volume K Unit Forecast, by Country 2019 & 2032
Frequently Asked Questions
1. What is the projected Compound Annual Growth Rate (CAGR) of the Printed and Flexible Sensors Industry?
The projected CAGR is approximately 8.47%.
2. Which companies are prominent players in the Printed and Flexible Sensors Industry?
Key companies in the market include ISORG, PolyIC GmbH & Co KG, Pressure Profile Systems Inc, Memtronik, Butler Technologies Inc, E2IP Technologies, Linepro Controls Pvt Ltd, PST Sensors, Tekscan Inc, Forciot, Quad Industries, Brewer Science, Nissha Co Lt, Canatu Oy.
3. What are the main segments of the Printed and Flexible Sensors Industry?
The market segments include Type, End-user Industry.
4. Can you provide details about the market size?
The market size is estimated to be USD 3.04 Million as of 2022.
5. What are some drivers contributing to market growth?
Progression in Demand for Energy-efficient. Thin. and Flexible Consumer Electronics Products; Rising Integration of Printed Sensors in Medical Wearable Devices.
6. What are the notable trends driving market growth?
Medical and Healthcare to Witness the Growth.
7. Are there any restraints impacting market growth?
Requirement of Technological Improvements for Wider Adoption.
8. Can you provide examples of recent developments in the market?
March 2023 - Tekscanofficially announced the launch of the High-Speed TireScansystem. Through this, tire makers can precisely, repeatedly, and effectively monitor dynamic contact patch pressure (DCPP) data from a tire rolling on a belt at speeds up to 165 mph (265 km/h) due to the development of this lightweight, durable device.
9. What pricing options are available for accessing the report?
Pricing options include single-user, multi-user, and enterprise licenses priced at USD 4750, USD 5250, and USD 8750 respectively.
10. Is the market size provided in terms of value or volume?
The market size is provided in terms of value, measured in Million and volume, measured in K Unit.
11. Are there any specific market keywords associated with the report?
Yes, the market keyword associated with the report is "Printed and Flexible Sensors Industry," which aids in identifying and referencing the specific market segment covered.
12. How do I determine which pricing option suits my needs best?
The pricing options vary based on user requirements and access needs. Individual users may opt for single-user licenses, while businesses requiring broader access may choose multi-user or enterprise licenses for cost-effective access to the report.
13. Are there any additional resources or data provided in the Printed and Flexible Sensors Industry report?
While the report offers comprehensive insights, it's advisable to review the specific contents or supplementary materials provided to ascertain if additional resources or data are available.
14. How can I stay updated on further developments or reports in the Printed and Flexible Sensors Industry?
To stay informed about further developments, trends, and reports in the Printed and Flexible Sensors Industry, consider subscribing to industry newsletters, following relevant companies and organizations, or regularly checking reputable industry news sources and publications.
Methodology
Step 1 - Identification of Relevant Samples Size from Population Database


Step 2 - Approaches for Defining Global Market Size (Value, Volume* & Price*)

Note*: In applicable scenarios
Step 3 - Data Sources
Primary Research
- Web Analytics
- Survey Reports
- Research Institute
- Latest Research Reports
- Opinion Leaders
Secondary Research
- Annual Reports
- White Paper
- Latest Press Release
- Industry Association
- Paid Database
- Investor Presentations

Step 4 - Data Triangulation
Involves using different sources of information in order to increase the validity of a study
These sources are likely to be stakeholders in a program - participants, other researchers, program staff, other community members, and so on.
Then we put all data in single framework & apply various statistical tools to find out the dynamic on the market.
During the analysis stage, feedback from the stakeholder groups would be compared to determine areas of agreement as well as areas of divergence


