

Key Insights
The global private equity (PE) industry is experiencing robust growth, driven by several key factors. The industry's Compound Annual Growth Rate (CAGR) exceeding 10% from 2019 to 2024 indicates a significant expansion, projected to continue into 2033. This growth is fueled by increasing institutional investor interest, abundant capital seeking higher returns than traditional asset classes, and a favorable regulatory environment in many key markets. The technology, healthcare, and real estate sectors remain dominant investment areas, attracting significant capital due to their growth potential and relatively strong performance in recent years. The market is segmented by fund type (buyout, venture capital, real estate, infrastructure, and others), investment stage (large cap, upper middle market, lower middle market), and geographic region. North America and Europe currently hold the largest market shares, but Asia-Pacific is expected to experience rapid growth, driven by economic expansion and increasing private equity activity in countries like China and India. While macroeconomic uncertainties and potential interest rate hikes present headwinds, the long-term outlook for the PE industry remains positive, supported by the continued search for attractive investment opportunities and the increasing sophistication of PE strategies.
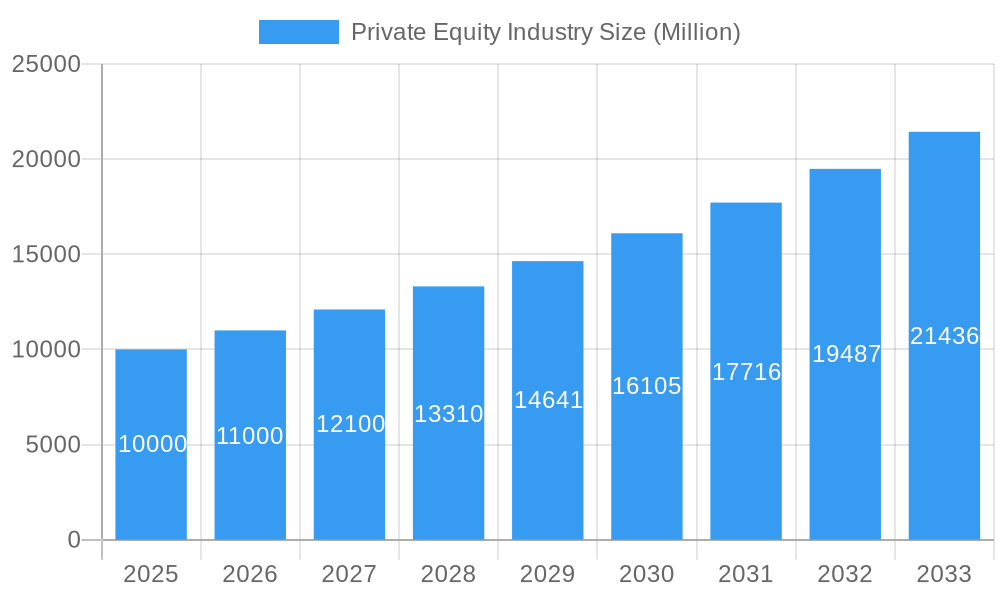
Private Equity Industry Market Size (In Billion)
Several key trends are shaping the PE landscape. A notable shift is the growing focus on environmental, social, and governance (ESG) factors in investment decisions, reflecting both investor preferences and regulatory pressures. Technological advancements, particularly in areas like data analytics and artificial intelligence, are transforming deal sourcing, due diligence, and portfolio management, enhancing efficiency and risk assessment. The rise of specialized PE funds focused on specific sectors or investment strategies, such as sustainable investments or impact investing, also demonstrates the industry's ongoing evolution. Competition among PE firms remains intense, driving innovation and specialization to gain an edge. Geographic expansion into emerging markets with high growth potential continues to be a significant focus, though regulatory complexities and market risks in these regions must be carefully considered. Overall, the PE industry shows considerable resilience and adaptability, demonstrating its ability to navigate macroeconomic fluctuations and successfully capitalize on emerging opportunities.
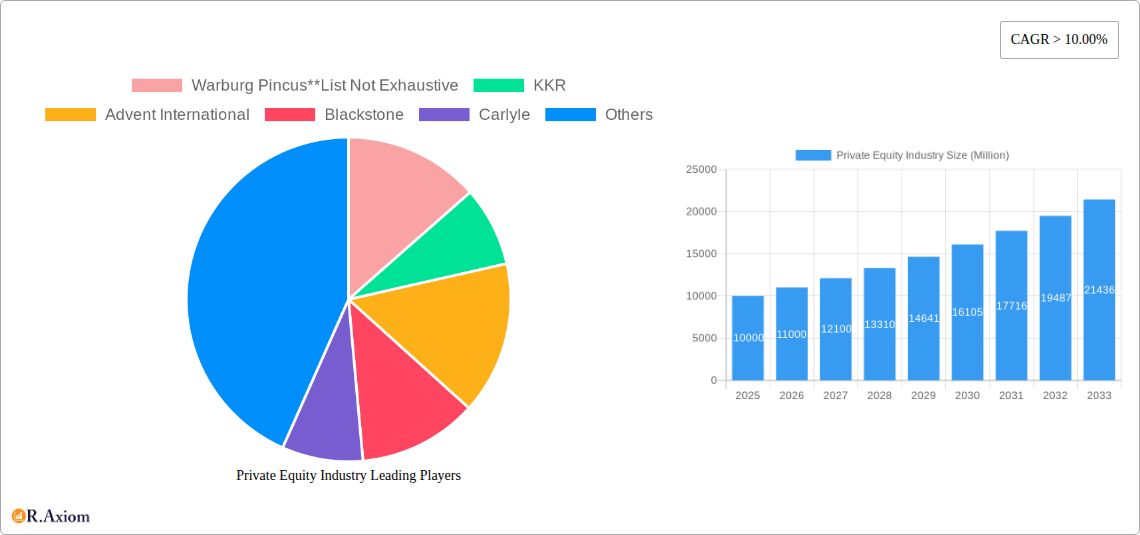
Private Equity Industry Company Market Share
Private Equity Industry: A Comprehensive Market Report (2019-2033)
This detailed report provides a comprehensive analysis of the Private Equity industry, encompassing market size, growth drivers, key players, and future trends. The study period covers 2019-2033, with 2025 as the base and estimated year. The forecast period spans 2025-2033, and the historical period is 2019-2024. The report leverages extensive data analysis to offer actionable insights for industry stakeholders, including private equity firms, investors, and businesses seeking funding.
Private Equity Industry Market Concentration & Innovation
The Private Equity industry exhibits high market concentration, with a few dominant players controlling significant assets under management (AUM). Blackstone, KKR, and Carlyle consistently rank among the top firms globally, commanding a combined market share estimated at xx%. However, a growing number of mid-market and niche players are emerging, driving innovation and competition. The industry's innovative landscape is shaped by several factors:
- Regulatory Frameworks: Evolving regulations concerning private equity investment strategies, particularly in areas like ESG (Environmental, Social, and Governance) investing, influence market dynamics.
- Product Substitutes: Alternative investment vehicles, such as hedge funds and real estate investment trusts (REITs), present competitive alternatives, impacting private equity's market share.
- End-User Trends: The increasing demand for private equity investments from institutional and high-net-worth investors fuels industry growth.
- M&A Activities: The private equity sector is characterized by frequent mergers and acquisitions (M&A). In 2024, the total value of M&A deals involving private equity firms reached approximately $xx Million, showcasing significant consolidation and growth strategies. Key deals included the xx Million acquisition of YYY by ZZZ and the xx Million acquisition of AAA by BBB, illustrating the magnitude of investment in different sectors.
Private Equity Industry Industry Trends & Insights
The Private Equity industry is experiencing robust growth, driven by several factors. The Compound Annual Growth Rate (CAGR) from 2025 to 2033 is projected to be xx%, indicating significant expansion. Market penetration is increasing across various segments, especially in developing economies.
Technological advancements, particularly in data analytics and artificial intelligence (AI), are reshaping investment strategies, due diligence processes, and portfolio management. Consumer preferences toward sustainable and ethical investments are influencing the industry's focus on ESG-related factors. Competitive dynamics are intensified by the entry of new players and the increasing sophistication of investment strategies. The industry is witnessing a shift towards specialized funds focusing on specific sectors like technology, healthcare, and renewable energy, leading to heightened competition in these niche markets. The increasing adoption of technology within the sector has led to greater efficiency in deal sourcing, due diligence and fund management. This includes enhanced data analytics for predictive modeling, improved portfolio monitoring and risk management systems. This heightened efficiency enhances returns and further attracts investments into the sector. The rising prevalence of ESG considerations in investment decisions is also shaping the industry landscape, directing capital towards businesses aligning with sustainability goals. This focus on ESG-compliant investments reflects evolving investor preferences and regulatory pressures.
Dominant Markets & Segments in Private Equity Industry
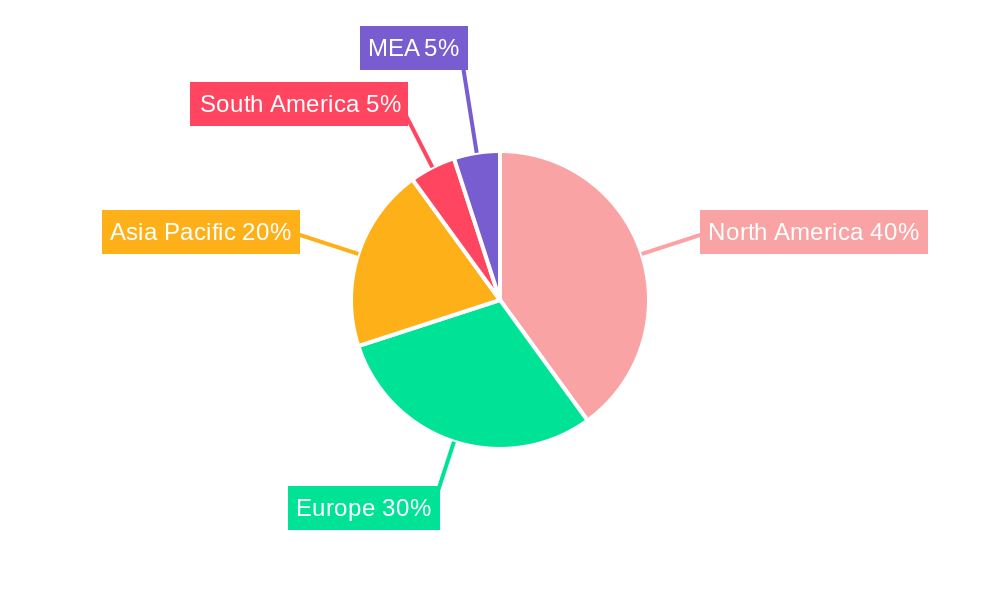
The North American market currently dominates the global private equity landscape, accounting for approximately xx% of total AUM, followed by Europe and Asia. Within the segmentations, several areas showcase robust growth:
- Fund Type: Buyout funds remain the largest segment, followed by Venture Capital (VCs), with Real Estate and Infrastructure funds also exhibiting significant growth.
- Sector: The Technology (Software) sector attracts the highest investment, driven by rapid innovation and high growth potential. Healthcare and Financial Services are also prominent sectors.
- Investments: Large Cap investments continue to dominate, with increasing activity in the Upper Middle Market segment.
Key Drivers for Dominance:
- Strong economic growth: Robust economic performance in certain regions drives higher investment activity.
- Developed financial markets: Mature financial systems and investor base facilitate larger deal flows.
- Supportive government policies: Favorable regulatory environments encourage private equity investment.
- Abundant capital: Significant availability of capital from both domestic and international sources.
- Presence of skilled professionals: Abundance of experienced industry experts and specialists.
Private Equity Industry Product Developments
Recent innovations include the development of specialized funds focusing on specific sectors or investment strategies (e.g., impact investing, sustainable infrastructure). These specialized funds offer tailored approaches to risk management and value creation, catering to specific investor preferences and market opportunities. The integration of technology and data analytics is revolutionizing deal sourcing, due diligence and portfolio management, creating competitive advantages for private equity firms that successfully deploy these tools.
Report Scope & Segmentation Analysis
This report comprehensively analyzes the Private Equity industry, segmented by:
- Fund Type: Buyout, Venture Capital, Real Estate, Infrastructure, Other (Distressed PE, Direct Lending) – each segment's growth projections, market sizes, and competitive dynamics are analyzed separately.
- Sector: Technology (Software), Healthcare, Real Estate & Services, Financial Services, Industrials, Consumer & Retail, Energy & Power, Media & Entertainment, Telecom, Others (Transportation) – individual sector analysis provides insights into specific investment trends.
- Investment Size: Large Cap, Upper Middle Market, Lower Middle Market, Real Estate – the report differentiates investment strategies and their respective market characteristics.
Each segment’s projected growth, current market size, and prevailing competitive dynamics are detailed within the report.
Key Drivers of Private Equity Industry Growth
Several factors fuel the industry's growth:
- Increased availability of capital: Abundant capital from institutional investors and sovereign wealth funds.
- Technological advancements: Data analytics and AI enhance due diligence and investment decision-making.
- Favorable regulatory environment: In certain jurisdictions, regulations support private equity investments.
- Strong M&A activity: Private equity firms' continued involvement in mergers and acquisitions fuels overall growth.
Challenges in the Private Equity Industry Sector
The Private Equity industry faces several challenges:
- Regulatory scrutiny: Increased regulatory scrutiny can impact deal execution and investment strategies.
- Economic uncertainty: Global economic downturns can negatively affect portfolio company performance.
- Competition: Intense competition among private equity firms for attractive investment opportunities.
- Valuation concerns: Concerns exist about inflated valuations in certain sectors. These concerns can lead to reduced investment returns and market corrections.
Emerging Opportunities in Private Equity Industry
Opportunities include:
- Focus on ESG investing: Growing interest in sustainable and responsible investments.
- Expansion into emerging markets: Significant growth potential in developing economies.
- Technological disruption: Leveraging AI and data analytics to enhance investment returns.
- Sector-specific strategies: Focusing on specific sectors like renewable energy or fintech.
Leading Players in the Private Equity Industry Market
- Warburg Pincus
- KKR
- Advent International
- Blackstone
- Carlyle
- EnCap Investments
- CVC Capital Partners
- TPG Capital
- Neuberger Berman
- Apollo Global Management
Key Developments in Private Equity Industry Industry
- September 2022: Nonantum Capital Partners acquired LJP Waste Solutions, a leading regional provider of waste management services. This acquisition highlights the continued interest in the environmental services sector.
- August 2022: Prosus Ventures and PayU India acquired BillDesk for USD 4.7 Billion, representing the largest acquisition in the Indian digital payments space. This deal highlights the significant investment in the fintech sector and the growing importance of digital payments in emerging markets.
Strategic Outlook for Private Equity Industry Market
The Private Equity industry is poised for continued growth, driven by increased capital availability, technological innovation, and evolving investor preferences. Future opportunities lie in focusing on sustainable investments, expanding into new markets, and leveraging technological advancements to enhance efficiency and returns. The sector is expected to continue its strong growth trajectory, driven by a combination of long-term structural trends and cyclical factors. However, challenges remain in the form of increased regulatory scrutiny and potential economic headwinds. Navigating these challenges effectively will be key to realizing the full potential of this dynamic industry.
Private Equity Industry Segmentation
-
1. Fund Type
- 1.1. Buyout
- 1.2. Venture Capital (VCs)
- 1.3. Real Estate
- 1.4. Infrastructure
- 1.5. Other (Distressed PE, Direct Lending, etc.)
-
2. Sector
- 2.1. Technology (Software)
- 2.2. Healthcare
- 2.3. Real Estate and Services
- 2.4. Financial Services
- 2.5. Industrials
- 2.6. Consumer & Retail
- 2.7. Energy & Power
- 2.8. Media & Entertainment
- 2.9. Telecom
- 2.10. Others (Transportation, etc.)
-
3. Investments
- 3.1. Large Cap
- 3.2. Upper Middle Market
- 3.3. Lower Middle Market
- 3.4. Real Estate
Private Equity Industry Segmentation By Geography
- 1. North America
- 2. Europe
- 3. Asia Pacific
- 4. Latin America
- 5. Middle East
Private Equity Industry Regional Market Share
Geographic Coverage of Private Equity Industry
Private Equity Industry REPORT HIGHLIGHTS
| Aspects | Details |
|---|---|
| Study Period | 2020-2034 |
| Base Year | 2025 |
| Estimated Year | 2026 |
| Forecast Period | 2026-2034 |
| Historical Period | 2020-2025 |
| Growth Rate | CAGR of 11% from 2020-2034 |
| Segmentation |
|
Table of Contents
- 1. Introduction
- 1.1. Research Scope
- 1.2. Market Segmentation
- 1.3. Research Objective
- 1.4. Definitions and Assumptions
- 2. Executive Summary
- 2.1. Market Snapshot
- 3. Market Dynamics
- 3.1. Market Drivers
- 3.2. Market Restrains
- 3.3. Market Trends
- 3.4. Market Opportunities
- 4. Market Factor Analysis
- 4.1. Porters Five Forces
- 4.1.1. Bargaining Power of Suppliers
- 4.1.2. Bargaining Power of Buyers
- 4.1.3. Threat of New Entrants
- 4.1.4. Threat of Substitutes
- 4.1.5. Competitive Rivalry
- 4.2. PESTEL analysis
- 4.3. BCG Analysis
- 4.3.1. Stars (High Growth, High Market Share)
- 4.3.2. Cash Cows (Low Growth, High Market Share)
- 4.3.3. Question Mark (High Growth, Low Market Share)
- 4.3.4. Dogs (Low Growth, Low Market Share)
- 4.4. Ansoff Matrix Analysis
- 4.5. Supply Chain Analysis
- 4.6. Regulatory Landscape
- 4.7. Current Market Potential and Opportunity Assessment (TAM–SAM–SOM Framework)
- 4.8. RAX Analyst Note
- 4.1. Porters Five Forces
- 5. Market Analysis, Insights and Forecast 2021-2033
- 5.1. Market Analysis, Insights and Forecast - by Fund Type
- 5.1.1. Buyout
- 5.1.2. Venture Capital (VCs)
- 5.1.3. Real Estate
- 5.1.4. Infrastructure
- 5.1.5. Other (Distressed PE, Direct Lending, etc.)
- 5.2. Market Analysis, Insights and Forecast - by Sector
- 5.2.1. Technology (Software)
- 5.2.2. Healthcare
- 5.2.3. Real Estate and Services
- 5.2.4. Financial Services
- 5.2.5. Industrials
- 5.2.6. Consumer & Retail
- 5.2.7. Energy & Power
- 5.2.8. Media & Entertainment
- 5.2.9. Telecom
- 5.2.10. Others (Transportation, etc.)
- 5.3. Market Analysis, Insights and Forecast - by Investments
- 5.3.1. Large Cap
- 5.3.2. Upper Middle Market
- 5.3.3. Lower Middle Market
- 5.3.4. Real Estate
- 5.4. Market Analysis, Insights and Forecast - by Region
- 5.4.1. North America
- 5.4.2. Europe
- 5.4.3. Asia Pacific
- 5.4.4. Latin America
- 5.4.5. Middle East
- 5.1. Market Analysis, Insights and Forecast - by Fund Type
- 6. Global Private Equity Industry Analysis, Insights and Forecast, 2021-2033
- 6.1. Market Analysis, Insights and Forecast - by Fund Type
- 6.1.1. Buyout
- 6.1.2. Venture Capital (VCs)
- 6.1.3. Real Estate
- 6.1.4. Infrastructure
- 6.1.5. Other (Distressed PE, Direct Lending, etc.)
- 6.2. Market Analysis, Insights and Forecast - by Sector
- 6.2.1. Technology (Software)
- 6.2.2. Healthcare
- 6.2.3. Real Estate and Services
- 6.2.4. Financial Services
- 6.2.5. Industrials
- 6.2.6. Consumer & Retail
- 6.2.7. Energy & Power
- 6.2.8. Media & Entertainment
- 6.2.9. Telecom
- 6.2.10. Others (Transportation, etc.)
- 6.3. Market Analysis, Insights and Forecast - by Investments
- 6.3.1. Large Cap
- 6.3.2. Upper Middle Market
- 6.3.3. Lower Middle Market
- 6.3.4. Real Estate
- 6.1. Market Analysis, Insights and Forecast - by Fund Type
- 7. North America Private Equity Industry Analysis, Insights and Forecast, 2020-2032
- 7.1. Market Analysis, Insights and Forecast - by Fund Type
- 7.1.1. Buyout
- 7.1.2. Venture Capital (VCs)
- 7.1.3. Real Estate
- 7.1.4. Infrastructure
- 7.1.5. Other (Distressed PE, Direct Lending, etc.)
- 7.2. Market Analysis, Insights and Forecast - by Sector
- 7.2.1. Technology (Software)
- 7.2.2. Healthcare
- 7.2.3. Real Estate and Services
- 7.2.4. Financial Services
- 7.2.5. Industrials
- 7.2.6. Consumer & Retail
- 7.2.7. Energy & Power
- 7.2.8. Media & Entertainment
- 7.2.9. Telecom
- 7.2.10. Others (Transportation, etc.)
- 7.3. Market Analysis, Insights and Forecast - by Investments
- 7.3.1. Large Cap
- 7.3.2. Upper Middle Market
- 7.3.3. Lower Middle Market
- 7.3.4. Real Estate
- 7.1. Market Analysis, Insights and Forecast - by Fund Type
- 8. Europe Private Equity Industry Analysis, Insights and Forecast, 2020-2032
- 8.1. Market Analysis, Insights and Forecast - by Fund Type
- 8.1.1. Buyout
- 8.1.2. Venture Capital (VCs)
- 8.1.3. Real Estate
- 8.1.4. Infrastructure
- 8.1.5. Other (Distressed PE, Direct Lending, etc.)
- 8.2. Market Analysis, Insights and Forecast - by Sector
- 8.2.1. Technology (Software)
- 8.2.2. Healthcare
- 8.2.3. Real Estate and Services
- 8.2.4. Financial Services
- 8.2.5. Industrials
- 8.2.6. Consumer & Retail
- 8.2.7. Energy & Power
- 8.2.8. Media & Entertainment
- 8.2.9. Telecom
- 8.2.10. Others (Transportation, etc.)
- 8.3. Market Analysis, Insights and Forecast - by Investments
- 8.3.1. Large Cap
- 8.3.2. Upper Middle Market
- 8.3.3. Lower Middle Market
- 8.3.4. Real Estate
- 8.1. Market Analysis, Insights and Forecast - by Fund Type
- 9. Asia Pacific Private Equity Industry Analysis, Insights and Forecast, 2020-2032
- 9.1. Market Analysis, Insights and Forecast - by Fund Type
- 9.1.1. Buyout
- 9.1.2. Venture Capital (VCs)
- 9.1.3. Real Estate
- 9.1.4. Infrastructure
- 9.1.5. Other (Distressed PE, Direct Lending, etc.)
- 9.2. Market Analysis, Insights and Forecast - by Sector
- 9.2.1. Technology (Software)
- 9.2.2. Healthcare
- 9.2.3. Real Estate and Services
- 9.2.4. Financial Services
- 9.2.5. Industrials
- 9.2.6. Consumer & Retail
- 9.2.7. Energy & Power
- 9.2.8. Media & Entertainment
- 9.2.9. Telecom
- 9.2.10. Others (Transportation, etc.)
- 9.3. Market Analysis, Insights and Forecast - by Investments
- 9.3.1. Large Cap
- 9.3.2. Upper Middle Market
- 9.3.3. Lower Middle Market
- 9.3.4. Real Estate
- 9.1. Market Analysis, Insights and Forecast - by Fund Type
- 10. Latin America Private Equity Industry Analysis, Insights and Forecast, 2020-2032
- 10.1. Market Analysis, Insights and Forecast - by Fund Type
- 10.1.1. Buyout
- 10.1.2. Venture Capital (VCs)
- 10.1.3. Real Estate
- 10.1.4. Infrastructure
- 10.1.5. Other (Distressed PE, Direct Lending, etc.)
- 10.2. Market Analysis, Insights and Forecast - by Sector
- 10.2.1. Technology (Software)
- 10.2.2. Healthcare
- 10.2.3. Real Estate and Services
- 10.2.4. Financial Services
- 10.2.5. Industrials
- 10.2.6. Consumer & Retail
- 10.2.7. Energy & Power
- 10.2.8. Media & Entertainment
- 10.2.9. Telecom
- 10.2.10. Others (Transportation, etc.)
- 10.3. Market Analysis, Insights and Forecast - by Investments
- 10.3.1. Large Cap
- 10.3.2. Upper Middle Market
- 10.3.3. Lower Middle Market
- 10.3.4. Real Estate
- 10.1. Market Analysis, Insights and Forecast - by Fund Type
- 11. Middle East Private Equity Industry Analysis, Insights and Forecast, 2020-2032
- 11.1. Market Analysis, Insights and Forecast - by Fund Type
- 11.1.1. Buyout
- 11.1.2. Venture Capital (VCs)
- 11.1.3. Real Estate
- 11.1.4. Infrastructure
- 11.1.5. Other (Distressed PE, Direct Lending, etc.)
- 11.2. Market Analysis, Insights and Forecast - by Sector
- 11.2.1. Technology (Software)
- 11.2.2. Healthcare
- 11.2.3. Real Estate and Services
- 11.2.4. Financial Services
- 11.2.5. Industrials
- 11.2.6. Consumer & Retail
- 11.2.7. Energy & Power
- 11.2.8. Media & Entertainment
- 11.2.9. Telecom
- 11.2.10. Others (Transportation, etc.)
- 11.3. Market Analysis, Insights and Forecast - by Investments
- 11.3.1. Large Cap
- 11.3.2. Upper Middle Market
- 11.3.3. Lower Middle Market
- 11.3.4. Real Estate
- 11.1. Market Analysis, Insights and Forecast - by Fund Type
- 12. Competitive Analysis
- 12.1. Company Profiles
- 12.1.1 Warburg Pincus**List Not Exhaustive
- 12.1.1.1. Company Overview
- 12.1.1.2. Products
- 12.1.1.3. Company Financials
- 12.1.1.4. SWOT Analysis
- 12.1.2 KKR
- 12.1.2.1. Company Overview
- 12.1.2.2. Products
- 12.1.2.3. Company Financials
- 12.1.2.4. SWOT Analysis
- 12.1.3 Advent International
- 12.1.3.1. Company Overview
- 12.1.3.2. Products
- 12.1.3.3. Company Financials
- 12.1.3.4. SWOT Analysis
- 12.1.4 Blackstone
- 12.1.4.1. Company Overview
- 12.1.4.2. Products
- 12.1.4.3. Company Financials
- 12.1.4.4. SWOT Analysis
- 12.1.5 Carlyle
- 12.1.5.1. Company Overview
- 12.1.5.2. Products
- 12.1.5.3. Company Financials
- 12.1.5.4. SWOT Analysis
- 12.1.6 EnCap Investments
- 12.1.6.1. Company Overview
- 12.1.6.2. Products
- 12.1.6.3. Company Financials
- 12.1.6.4. SWOT Analysis
- 12.1.7 CVC Capital Partners
- 12.1.7.1. Company Overview
- 12.1.7.2. Products
- 12.1.7.3. Company Financials
- 12.1.7.4. SWOT Analysis
- 12.1.8 TPG Capital
- 12.1.8.1. Company Overview
- 12.1.8.2. Products
- 12.1.8.3. Company Financials
- 12.1.8.4. SWOT Analysis
- 12.1.9 Neuberger Berman
- 12.1.9.1. Company Overview
- 12.1.9.2. Products
- 12.1.9.3. Company Financials
- 12.1.9.4. SWOT Analysis
- 12.1.10 Apollo Global Management
- 12.1.10.1. Company Overview
- 12.1.10.2. Products
- 12.1.10.3. Company Financials
- 12.1.10.4. SWOT Analysis
- 12.1.1 Warburg Pincus**List Not Exhaustive
- 12.2. Market Entropy
- 12.2.1 Company's Key Areas Served
- 12.2.2 Recent Developments
- 12.3. Company Market Share Analysis 2025
- 12.3.1 Top 5 Companies Market Share Analysis
- 12.3.2 Top 3 Companies Market Share Analysis
- 12.4. List of Potential Customers
- 13. Research Methodology
List of Figures
- Figure 1: Global Private Equity Industry Revenue Breakdown (billion, %) by Region 2025 & 2033
- Figure 2: North America Private Equity Industry Revenue (billion), by Fund Type 2025 & 2033
- Figure 3: North America Private Equity Industry Revenue Share (%), by Fund Type 2025 & 2033
- Figure 4: North America Private Equity Industry Revenue (billion), by Sector 2025 & 2033
- Figure 5: North America Private Equity Industry Revenue Share (%), by Sector 2025 & 2033
- Figure 6: North America Private Equity Industry Revenue (billion), by Investments 2025 & 2033
- Figure 7: North America Private Equity Industry Revenue Share (%), by Investments 2025 & 2033
- Figure 8: North America Private Equity Industry Revenue (billion), by Country 2025 & 2033
- Figure 9: North America Private Equity Industry Revenue Share (%), by Country 2025 & 2033
- Figure 10: Europe Private Equity Industry Revenue (billion), by Fund Type 2025 & 2033
- Figure 11: Europe Private Equity Industry Revenue Share (%), by Fund Type 2025 & 2033
- Figure 12: Europe Private Equity Industry Revenue (billion), by Sector 2025 & 2033
- Figure 13: Europe Private Equity Industry Revenue Share (%), by Sector 2025 & 2033
- Figure 14: Europe Private Equity Industry Revenue (billion), by Investments 2025 & 2033
- Figure 15: Europe Private Equity Industry Revenue Share (%), by Investments 2025 & 2033
- Figure 16: Europe Private Equity Industry Revenue (billion), by Country 2025 & 2033
- Figure 17: Europe Private Equity Industry Revenue Share (%), by Country 2025 & 2033
- Figure 18: Asia Pacific Private Equity Industry Revenue (billion), by Fund Type 2025 & 2033
- Figure 19: Asia Pacific Private Equity Industry Revenue Share (%), by Fund Type 2025 & 2033
- Figure 20: Asia Pacific Private Equity Industry Revenue (billion), by Sector 2025 & 2033
- Figure 21: Asia Pacific Private Equity Industry Revenue Share (%), by Sector 2025 & 2033
- Figure 22: Asia Pacific Private Equity Industry Revenue (billion), by Investments 2025 & 2033
- Figure 23: Asia Pacific Private Equity Industry Revenue Share (%), by Investments 2025 & 2033
- Figure 24: Asia Pacific Private Equity Industry Revenue (billion), by Country 2025 & 2033
- Figure 25: Asia Pacific Private Equity Industry Revenue Share (%), by Country 2025 & 2033
- Figure 26: Latin America Private Equity Industry Revenue (billion), by Fund Type 2025 & 2033
- Figure 27: Latin America Private Equity Industry Revenue Share (%), by Fund Type 2025 & 2033
- Figure 28: Latin America Private Equity Industry Revenue (billion), by Sector 2025 & 2033
- Figure 29: Latin America Private Equity Industry Revenue Share (%), by Sector 2025 & 2033
- Figure 30: Latin America Private Equity Industry Revenue (billion), by Investments 2025 & 2033
- Figure 31: Latin America Private Equity Industry Revenue Share (%), by Investments 2025 & 2033
- Figure 32: Latin America Private Equity Industry Revenue (billion), by Country 2025 & 2033
- Figure 33: Latin America Private Equity Industry Revenue Share (%), by Country 2025 & 2033
- Figure 34: Middle East Private Equity Industry Revenue (billion), by Fund Type 2025 & 2033
- Figure 35: Middle East Private Equity Industry Revenue Share (%), by Fund Type 2025 & 2033
- Figure 36: Middle East Private Equity Industry Revenue (billion), by Sector 2025 & 2033
- Figure 37: Middle East Private Equity Industry Revenue Share (%), by Sector 2025 & 2033
- Figure 38: Middle East Private Equity Industry Revenue (billion), by Investments 2025 & 2033
- Figure 39: Middle East Private Equity Industry Revenue Share (%), by Investments 2025 & 2033
- Figure 40: Middle East Private Equity Industry Revenue (billion), by Country 2025 & 2033
- Figure 41: Middle East Private Equity Industry Revenue Share (%), by Country 2025 & 2033
List of Tables
- Table 1: Global Private Equity Industry Revenue billion Forecast, by Fund Type 2020 & 2033
- Table 2: Global Private Equity Industry Revenue billion Forecast, by Sector 2020 & 2033
- Table 3: Global Private Equity Industry Revenue billion Forecast, by Investments 2020 & 2033
- Table 4: Global Private Equity Industry Revenue billion Forecast, by Region 2020 & 2033
- Table 5: Global Private Equity Industry Revenue billion Forecast, by Fund Type 2020 & 2033
- Table 6: Global Private Equity Industry Revenue billion Forecast, by Sector 2020 & 2033
- Table 7: Global Private Equity Industry Revenue billion Forecast, by Investments 2020 & 2033
- Table 8: Global Private Equity Industry Revenue billion Forecast, by Country 2020 & 2033
- Table 9: Global Private Equity Industry Revenue billion Forecast, by Fund Type 2020 & 2033
- Table 10: Global Private Equity Industry Revenue billion Forecast, by Sector 2020 & 2033
- Table 11: Global Private Equity Industry Revenue billion Forecast, by Investments 2020 & 2033
- Table 12: Global Private Equity Industry Revenue billion Forecast, by Country 2020 & 2033
- Table 13: Global Private Equity Industry Revenue billion Forecast, by Fund Type 2020 & 2033
- Table 14: Global Private Equity Industry Revenue billion Forecast, by Sector 2020 & 2033
- Table 15: Global Private Equity Industry Revenue billion Forecast, by Investments 2020 & 2033
- Table 16: Global Private Equity Industry Revenue billion Forecast, by Country 2020 & 2033
- Table 17: Global Private Equity Industry Revenue billion Forecast, by Fund Type 2020 & 2033
- Table 18: Global Private Equity Industry Revenue billion Forecast, by Sector 2020 & 2033
- Table 19: Global Private Equity Industry Revenue billion Forecast, by Investments 2020 & 2033
- Table 20: Global Private Equity Industry Revenue billion Forecast, by Country 2020 & 2033
- Table 21: Global Private Equity Industry Revenue billion Forecast, by Fund Type 2020 & 2033
- Table 22: Global Private Equity Industry Revenue billion Forecast, by Sector 2020 & 2033
- Table 23: Global Private Equity Industry Revenue billion Forecast, by Investments 2020 & 2033
- Table 24: Global Private Equity Industry Revenue billion Forecast, by Country 2020 & 2033
Frequently Asked Questions
1. What is the projected Compound Annual Growth Rate (CAGR) of the Private Equity Industry?
The projected CAGR is approximately 11%.
2. Which companies are prominent players in the Private Equity Industry?
Key companies in the market include Warburg Pincus**List Not Exhaustive, KKR, Advent International, Blackstone, Carlyle, EnCap Investments, CVC Capital Partners, TPG Capital, Neuberger Berman, Apollo Global Management.
3. What are the main segments of the Private Equity Industry?
The market segments include Fund Type, Sector, Investments.
4. Can you provide details about the market size?
The market size is estimated to be USD 460 billion as of 2022.
5. What are some drivers contributing to market growth?
Increasing Adoption of Innovative Tracking Technologies.
6. What are the notable trends driving market growth?
Growth Investments Have Become Larger and More Complex.
7. Are there any restraints impacting market growth?
Rising Competition of Banks with Fintech and Financial Services.
8. Can you provide examples of recent developments in the market?
September 2022: Nonantum Capital Partners, a middle-market private equity firm, today announced the acquisition of LJP Waste Solutions ("LJP") from Aperion Management. LJP is a leading regional provider of non-hazardous solid waste and recycling services specializing in zero landfill and waste-to-energy solutions.
9. What pricing options are available for accessing the report?
Pricing options include single-user, multi-user, and enterprise licenses priced at USD 4750, USD 5250, and USD 8750 respectively.
10. Is the market size provided in terms of value or volume?
The market size is provided in terms of value, measured in billion.
11. Are there any specific market keywords associated with the report?
Yes, the market keyword associated with the report is "Private Equity Industry," which aids in identifying and referencing the specific market segment covered.
12. How do I determine which pricing option suits my needs best?
The pricing options vary based on user requirements and access needs. Individual users may opt for single-user licenses, while businesses requiring broader access may choose multi-user or enterprise licenses for cost-effective access to the report.
13. Are there any additional resources or data provided in the Private Equity Industry report?
While the report offers comprehensive insights, it's advisable to review the specific contents or supplementary materials provided to ascertain if additional resources or data are available.
14. How can I stay updated on further developments or reports in the Private Equity Industry?
To stay informed about further developments, trends, and reports in the Private Equity Industry, consider subscribing to industry newsletters, following relevant companies and organizations, or regularly checking reputable industry news sources and publications.
Methodology
Step 1 - Identification of Relevant Samples Size from Population Database


Step 2 - Approaches for Defining Global Market Size (Value, Volume* & Price*)

Note*: In applicable scenarios
Step 3 - Data Sources
Primary Research
- Web Analytics
- Survey Reports
- Research Institute
- Latest Research Reports
- Opinion Leaders
Secondary Research
- Annual Reports
- White Paper
- Latest Press Release
- Industry Association
- Paid Database
- Investor Presentations

Step 4 - Data Triangulation
Involves using different sources of information in order to increase the validity of a study
These sources are likely to be stakeholders in a program - participants, other researchers, program staff, other community members, and so on.
Then we put all data in single framework & apply various statistical tools to find out the dynamic on the market.
During the analysis stage, feedback from the stakeholder groups would be compared to determine areas of agreement as well as areas of divergence