
Key Insights
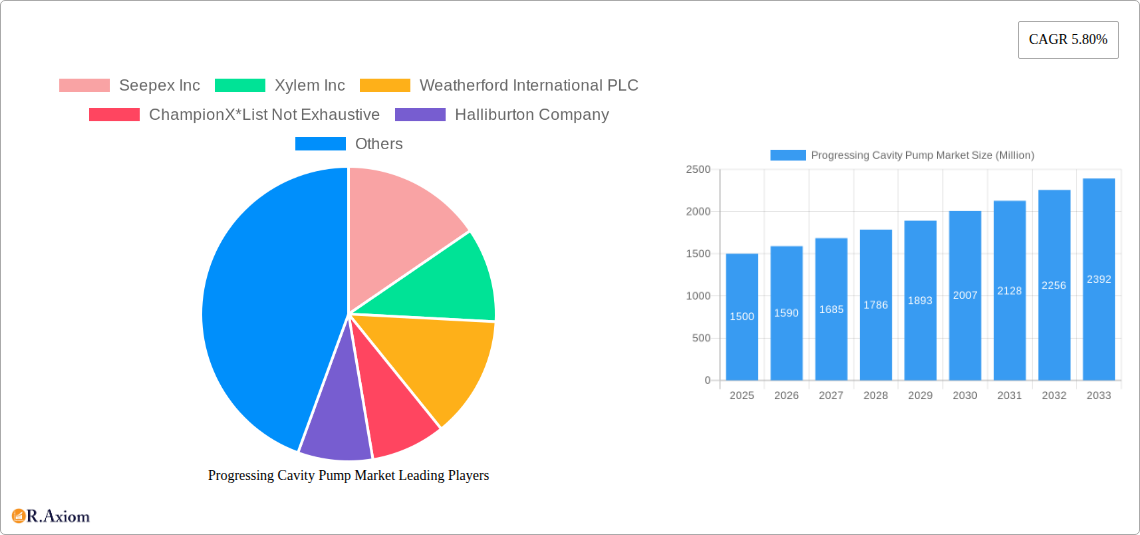
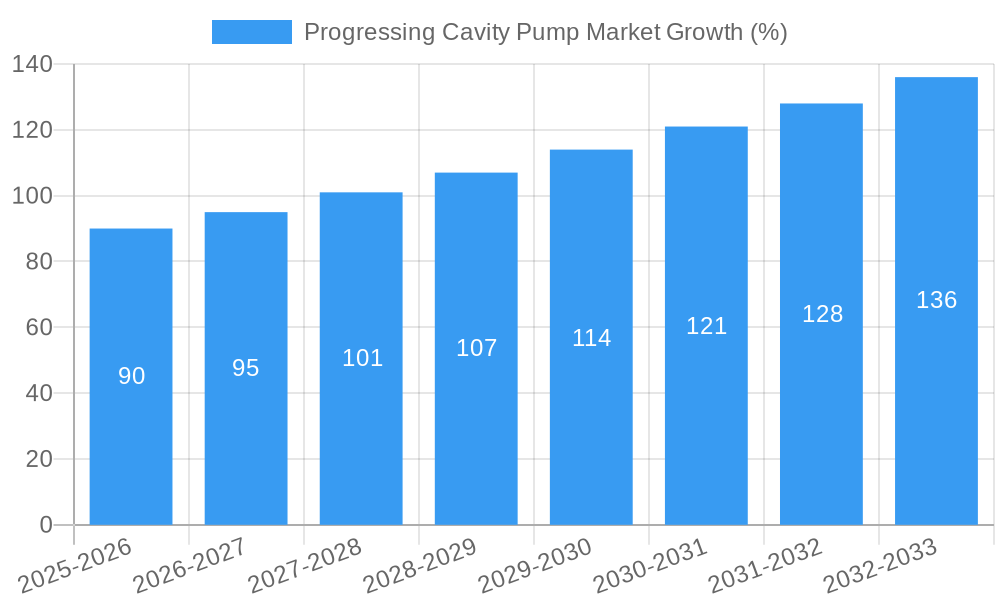
The progressing cavity pump (PCP) market, valued at approximately $XX million in 2025, is projected to experience robust growth, exhibiting a compound annual growth rate (CAGR) of 5.80% from 2025 to 2033. This expansion is fueled by several key drivers. The increasing demand for efficient and reliable pumping solutions across diverse industries, particularly in water and wastewater treatment, oil and gas extraction, and chemical processing, is a significant factor. Furthermore, the growing adoption of PCPs in applications requiring high viscosity and shear-sensitive fluids contributes to market growth. Technological advancements, such as improved materials and designs leading to enhanced efficiency and durability, are also driving market expansion. While potential restraints include the relatively high initial investment cost compared to other pump types and the need for specialized maintenance, the long-term operational advantages and increasing demand for reliable fluid handling solutions are expected to outweigh these challenges. Segmentation analysis reveals that the "Above 150 HP" power rating segment and the Oil and Gas end-user vertical are expected to demonstrate strong growth, reflecting the needs of large-scale industrial applications. Major players like Seepex Inc, Xylem Inc, and Weatherford International PLC, among others, are actively shaping the market landscape through innovation and strategic expansion.
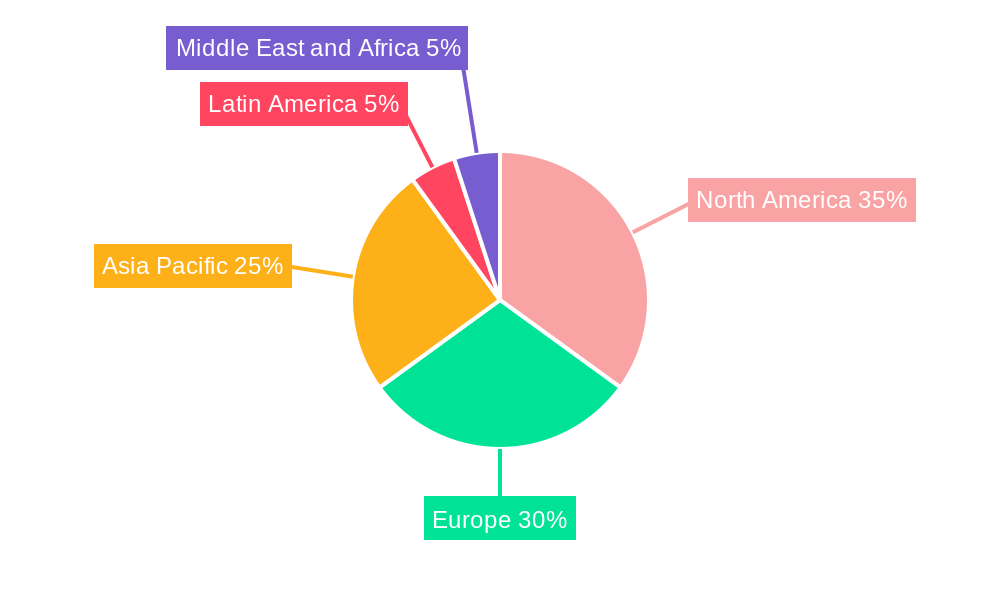
Geographic distribution shows a varied market penetration. North America and Europe currently hold significant market share, driven by established industrial infrastructure and stringent environmental regulations. However, the Asia-Pacific region is poised for substantial growth, fueled by rapid industrialization and infrastructure development. Latin America and the Middle East and Africa also present promising opportunities, although their growth might be somewhat slower due to factors such as varying levels of economic development and infrastructure investment. The forecast period, 2025-2033, presents a compelling investment outlook given the consistent demand drivers and the market’s steady expansion. Market participants are expected to focus on developing innovative PCP technologies, improving operational efficiency, and expanding their geographic reach to capitalize on this growth trajectory.
Progressing Cavity Pump Market: A Comprehensive Report (2019-2033)
This detailed report provides a comprehensive analysis of the progressing cavity pump market, offering invaluable insights for industry stakeholders. The study period spans from 2019 to 2033, with 2025 serving as the base and estimated year. The report meticulously examines market dynamics, competitive landscapes, and future growth prospects, incorporating key developments and trends. The analysis covers various segments, including power rating and end-user verticals, offering granular data and actionable recommendations.
Progressing Cavity Pump Market Concentration & Innovation
This section analyzes the market concentration, innovation drivers, regulatory frameworks, product substitutes, end-user trends, and M&A activities within the progressing cavity pump market. The market exhibits a moderately concentrated structure, with key players such as Seepex Inc, Xylem Inc, Weatherford International PLC, ChampionX, Halliburton Company, National-Oilwell Varco Inc, PCM Group, Schlumberger Limited, NETZSCH Group holding significant market share. Estimates suggest that the top 5 players collectively account for approximately xx% of the global market in 2025.
Innovation is driven by the increasing demand for energy-efficient and sustainable pumping solutions, particularly within the water and wastewater treatment sectors. Stringent environmental regulations are pushing for improved pump efficiency and reduced emissions. Key innovation areas include advanced materials, improved sealing technologies, and smart monitoring systems. The market has witnessed several M&A activities in recent years, with deal values ranging from xx Million to xx Million. These activities aim to expand market reach, enhance technological capabilities, and consolidate market share. Specific examples will be detailed within the full report. End-user trends show a rising preference for customized solutions that cater to specific application needs and optimize operational efficiency.
Progressing Cavity Pump Market Industry Trends & Insights
The progressing cavity pump market is experiencing robust growth, driven by several factors. Increasing industrialization and urbanization are leading to higher demand for water and wastewater treatment solutions, thus boosting market expansion. The oil and gas sector continues to be a significant end-user, with the market growth strongly influenced by upstream and downstream activities. The chemical and petrochemical industries require robust and reliable pumps for handling a variety of fluids, contributing significantly to market revenue. Technological advancements in pump design and materials are enhancing efficiency and durability, stimulating market expansion. The market's Compound Annual Growth Rate (CAGR) is projected at xx% during the forecast period (2025-2033). Market penetration is particularly strong in developed economies, with emerging markets exhibiting promising growth potential. Competitive dynamics are shaped by technological innovation, pricing strategies, and geographic expansion, with leading players focused on building strong brand equity and providing value-added services.
Dominant Markets & Segments in Progressing Cavity Pump Market
Leading Region/Country: North America and Europe currently hold the largest market share, driven by strong industrial activity and advanced infrastructure. However, Asia-Pacific is expected to witness the fastest growth rate during the forecast period, fuelled by rapid industrialization and infrastructure development.
Dominant Segments:
Power Rating: The segment with power ratings between 51 to 150 HP currently dominates, driven by its suitability for a wide range of industrial applications. This is further augmented by the increasing adoption of automation in industrial processes which require a higher power rating than segments with up to 50 HP.
End-User Vertical: The Oil and Gas and Water and Wastewater sectors currently represent the largest end-user segments. These industries are characterized by large-scale operations that require highly reliable and efficient pumping solutions. Government policies encouraging water conservation and wastewater treatment are also significantly driving growth within the Water and Wastewater sector.
Key drivers include supportive government policies for infrastructure development, stringent environmental regulations, and increasing investment in water management and industrial automation, particularly in the booming economies of Asia. The dominance of particular segments can be attributed to various factors, including application requirements, technological maturity, and market penetration strategies adopted by key players.
Progressing Cavity Pump Market Product Developments
Recent advancements focus on enhancing energy efficiency, improving durability, and expanding application versatility. Manufacturers are integrating advanced materials, such as high-performance polymers and composites, to withstand aggressive fluids and harsh operating conditions. The integration of smart sensors and digital technologies facilitates remote monitoring, predictive maintenance, and optimized performance, enabling better control and reduced downtime. This focus on innovation positions progressing cavity pumps as a highly sought-after solution in various industries, especially those with stringent environmental regulations and demanding operational requirements.
Report Scope & Segmentation Analysis
The report segments the progressing cavity pump market by power rating (Up to 50 HP, Between 51 to 150 HP, Above 150 HP) and end-user vertical (Water and Wastewater, Oil and Gas, Chemicals and Petrochemicals, Food and Beverage, Other End-Users). Each segment is analyzed based on its market size, growth projections, and competitive dynamics. The "Between 51 to 150 HP" power rating segment is expected to witness significant growth during the forecast period, driven by the rising demand for high-capacity pumps across numerous industrial applications. Similarly, the Water and Wastewater segment is expected to experience substantial growth due to increasing investments in water infrastructure and stringent environmental regulations. Competitive landscapes vary across segments with some segments seeing fierce competition while others are characterized by a smaller number of key players.
Key Drivers of Progressing Cavity Pump Market Growth
The market is propelled by several key growth factors. Technological advancements in pump design and materials are enhancing efficiency and reliability. The increasing demand for effective water and wastewater treatment solutions due to urbanization and stricter environmental regulations is a significant driver. Moreover, the continuous growth of the oil and gas and chemical industries necessitates efficient and robust pumping solutions. These factors, combined with supportive government initiatives fostering industrial development and infrastructure upgrades, are expected to boost market growth significantly over the coming years.
Challenges in the Progressing Cavity Pump Market Sector
The progressing cavity pump market faces several challenges. Fluctuations in raw material prices, particularly for metals and polymers, can significantly impact manufacturing costs. Supply chain disruptions can hinder production and delivery timelines, affecting market dynamics. Intense competition from alternative pump technologies and established market players requires continuous innovation and strategic positioning. Stringent environmental regulations necessitate compliance with emission standards, potentially impacting product development and operational costs. These challenges represent significant hurdles to market growth and necessitate strategic adaptations by industry players.
Emerging Opportunities in Progressing Cavity Pump Market
Emerging opportunities lie in the expanding adoption of smart pumping systems, which offer enhanced efficiency, predictive maintenance, and remote monitoring capabilities. The growing demand for sustainable and energy-efficient solutions across various industries presents promising avenues for growth. Expansion into new geographical markets, particularly in developing economies experiencing rapid industrialization, offers considerable potential. The development of specialized pumps catering to niche applications, such as those in the renewable energy and pharmaceutical sectors, also represents a significant avenue for expansion.
Leading Players in the Progressing Cavity Pump Market Market
- Seepex Inc
- Xylem Inc (Xylem Inc)
- Weatherford International PLC (Weatherford International PLC)
- ChampionX
- Halliburton Company (Halliburton Company)
- National-Oilwell Varco Inc (National-Oilwell Varco Inc)
- PCM Group
- Schlumberger Limited (Schlumberger Limited)
- NETZSCH Group (NETZSCH Group)
Key Developments in Progressing Cavity Pump Market Industry
February 2023: Netzsch Pumps & Systems announced the expansion of its production and logistics in East Asia with a new plant in Lanzhou, China. This significantly increases production capacity and strengthens its market position in the region.
October 2022: Xylem Singapore and Gross-Wen Technologies collaborated to develop sustainable wastewater treatment solutions using revolving algal biofilm (RAB) technology, promoting nutrient recovery and reducing carbon footprints. This partnership highlights the industry's increasing focus on sustainability.
Strategic Outlook for Progressing Cavity Pump Market Market
The progressing cavity pump market is poised for continued growth, driven by technological innovations, increasing industrial activity, and rising demand for sustainable solutions. The focus on energy efficiency, smart technologies, and customized solutions will shape future market dynamics. Strategic investments in research and development, expansion into new markets, and strategic partnerships are key to success in this evolving landscape. The market is expected to witness further consolidation through M&A activities, and companies that can adapt to evolving customer needs and regulatory changes will be best positioned for long-term success.
Progressing Cavity Pump Market Segmentation
-
1. Power Rating
- 1.1. Up to 50 HP
- 1.2. Between 51 to 150 HP
- 1.3. Above 150 HP
-
2. End-User Vertical
- 2.1. Water and Wastewater
- 2.2. Oil and Gas
- 2.3. Chemicals and Petrochemicals
- 2.4. Food and Beverage
- 2.5. Other End-Users
Progressing Cavity Pump Market Segmentation By Geography
- 1. North America
- 2. Europe
- 3. Asia Pacific
- 4. Latin America
- 5. Middle East and Africa
Progressing Cavity Pump Market REPORT HIGHLIGHTS
| Aspects | Details |
|---|---|
| Study Period | 2019-2033 |
| Base Year | 2024 |
| Estimated Year | 2025 |
| Forecast Period | 2025-2033 |
| Historical Period | 2019-2024 |
| Growth Rate | CAGR of 5.80% from 2019-2033 |
| Segmentation |
|
Table of Contents
- 1. Introduction
- 1.1. Research Scope
- 1.2. Market Segmentation
- 1.3. Research Methodology
- 1.4. Definitions and Assumptions
- 2. Executive Summary
- 2.1. Introduction
- 3. Market Dynamics
- 3.1. Introduction
- 3.2. Market Drivers
- 3.2.1. Increasing Demand From Water and Wastewater Management Infrastructure Industry Across the World; Suitability for Handling High-viscosity Fluids
- 3.3. Market Restrains
- 3.3.1. High Deployment and Maintenance Cost
- 3.4. Market Trends
- 3.4.1. Waste and Wastewater is Expected to Hold Major Share
- 4. Market Factor Analysis
- 4.1. Porters Five Forces
- 4.2. Supply/Value Chain
- 4.3. PESTEL analysis
- 4.4. Market Entropy
- 4.5. Patent/Trademark Analysis
- 5. Global Progressing Cavity Pump Market Analysis, Insights and Forecast, 2019-2031
- 5.1. Market Analysis, Insights and Forecast - by Power Rating
- 5.1.1. Up to 50 HP
- 5.1.2. Between 51 to 150 HP
- 5.1.3. Above 150 HP
- 5.2. Market Analysis, Insights and Forecast - by End-User Vertical
- 5.2.1. Water and Wastewater
- 5.2.2. Oil and Gas
- 5.2.3. Chemicals and Petrochemicals
- 5.2.4. Food and Beverage
- 5.2.5. Other End-Users
- 5.3. Market Analysis, Insights and Forecast - by Region
- 5.3.1. North America
- 5.3.2. Europe
- 5.3.3. Asia Pacific
- 5.3.4. Latin America
- 5.3.5. Middle East and Africa
- 5.1. Market Analysis, Insights and Forecast - by Power Rating
- 6. North America Progressing Cavity Pump Market Analysis, Insights and Forecast, 2019-2031
- 6.1. Market Analysis, Insights and Forecast - by Power Rating
- 6.1.1. Up to 50 HP
- 6.1.2. Between 51 to 150 HP
- 6.1.3. Above 150 HP
- 6.2. Market Analysis, Insights and Forecast - by End-User Vertical
- 6.2.1. Water and Wastewater
- 6.2.2. Oil and Gas
- 6.2.3. Chemicals and Petrochemicals
- 6.2.4. Food and Beverage
- 6.2.5. Other End-Users
- 6.1. Market Analysis, Insights and Forecast - by Power Rating
- 7. Europe Progressing Cavity Pump Market Analysis, Insights and Forecast, 2019-2031
- 7.1. Market Analysis, Insights and Forecast - by Power Rating
- 7.1.1. Up to 50 HP
- 7.1.2. Between 51 to 150 HP
- 7.1.3. Above 150 HP
- 7.2. Market Analysis, Insights and Forecast - by End-User Vertical
- 7.2.1. Water and Wastewater
- 7.2.2. Oil and Gas
- 7.2.3. Chemicals and Petrochemicals
- 7.2.4. Food and Beverage
- 7.2.5. Other End-Users
- 7.1. Market Analysis, Insights and Forecast - by Power Rating
- 8. Asia Pacific Progressing Cavity Pump Market Analysis, Insights and Forecast, 2019-2031
- 8.1. Market Analysis, Insights and Forecast - by Power Rating
- 8.1.1. Up to 50 HP
- 8.1.2. Between 51 to 150 HP
- 8.1.3. Above 150 HP
- 8.2. Market Analysis, Insights and Forecast - by End-User Vertical
- 8.2.1. Water and Wastewater
- 8.2.2. Oil and Gas
- 8.2.3. Chemicals and Petrochemicals
- 8.2.4. Food and Beverage
- 8.2.5. Other End-Users
- 8.1. Market Analysis, Insights and Forecast - by Power Rating
- 9. Latin America Progressing Cavity Pump Market Analysis, Insights and Forecast, 2019-2031
- 9.1. Market Analysis, Insights and Forecast - by Power Rating
- 9.1.1. Up to 50 HP
- 9.1.2. Between 51 to 150 HP
- 9.1.3. Above 150 HP
- 9.2. Market Analysis, Insights and Forecast - by End-User Vertical
- 9.2.1. Water and Wastewater
- 9.2.2. Oil and Gas
- 9.2.3. Chemicals and Petrochemicals
- 9.2.4. Food and Beverage
- 9.2.5. Other End-Users
- 9.1. Market Analysis, Insights and Forecast - by Power Rating
- 10. Middle East and Africa Progressing Cavity Pump Market Analysis, Insights and Forecast, 2019-2031
- 10.1. Market Analysis, Insights and Forecast - by Power Rating
- 10.1.1. Up to 50 HP
- 10.1.2. Between 51 to 150 HP
- 10.1.3. Above 150 HP
- 10.2. Market Analysis, Insights and Forecast - by End-User Vertical
- 10.2.1. Water and Wastewater
- 10.2.2. Oil and Gas
- 10.2.3. Chemicals and Petrochemicals
- 10.2.4. Food and Beverage
- 10.2.5. Other End-Users
- 10.1. Market Analysis, Insights and Forecast - by Power Rating
- 11. North America Progressing Cavity Pump Market Analysis, Insights and Forecast, 2019-2031
- 11.1. Market Analysis, Insights and Forecast - By Country/Sub-region
- 11.1.1.
- 12. Europe Progressing Cavity Pump Market Analysis, Insights and Forecast, 2019-2031
- 12.1. Market Analysis, Insights and Forecast - By Country/Sub-region
- 12.1.1.
- 13. Asia Pacific Progressing Cavity Pump Market Analysis, Insights and Forecast, 2019-2031
- 13.1. Market Analysis, Insights and Forecast - By Country/Sub-region
- 13.1.1.
- 14. Latin America Progressing Cavity Pump Market Analysis, Insights and Forecast, 2019-2031
- 14.1. Market Analysis, Insights and Forecast - By Country/Sub-region
- 14.1.1.
- 15. Middle East and Africa Progressing Cavity Pump Market Analysis, Insights and Forecast, 2019-2031
- 15.1. Market Analysis, Insights and Forecast - By Country/Sub-region
- 15.1.1.
- 16. Competitive Analysis
- 16.1. Global Market Share Analysis 2024
- 16.2. Company Profiles
- 16.2.1 Seepex Inc
- 16.2.1.1. Overview
- 16.2.1.2. Products
- 16.2.1.3. SWOT Analysis
- 16.2.1.4. Recent Developments
- 16.2.1.5. Financials (Based on Availability)
- 16.2.2 Xylem Inc
- 16.2.2.1. Overview
- 16.2.2.2. Products
- 16.2.2.3. SWOT Analysis
- 16.2.2.4. Recent Developments
- 16.2.2.5. Financials (Based on Availability)
- 16.2.3 Weatherford International PLC
- 16.2.3.1. Overview
- 16.2.3.2. Products
- 16.2.3.3. SWOT Analysis
- 16.2.3.4. Recent Developments
- 16.2.3.5. Financials (Based on Availability)
- 16.2.4 ChampionX*List Not Exhaustive
- 16.2.4.1. Overview
- 16.2.4.2. Products
- 16.2.4.3. SWOT Analysis
- 16.2.4.4. Recent Developments
- 16.2.4.5. Financials (Based on Availability)
- 16.2.5 Halliburton Company
- 16.2.5.1. Overview
- 16.2.5.2. Products
- 16.2.5.3. SWOT Analysis
- 16.2.5.4. Recent Developments
- 16.2.5.5. Financials (Based on Availability)
- 16.2.6 National-Oilwell Varco Inc
- 16.2.6.1. Overview
- 16.2.6.2. Products
- 16.2.6.3. SWOT Analysis
- 16.2.6.4. Recent Developments
- 16.2.6.5. Financials (Based on Availability)
- 16.2.7 PCM Group
- 16.2.7.1. Overview
- 16.2.7.2. Products
- 16.2.7.3. SWOT Analysis
- 16.2.7.4. Recent Developments
- 16.2.7.5. Financials (Based on Availability)
- 16.2.8 Schlumberger Limited
- 16.2.8.1. Overview
- 16.2.8.2. Products
- 16.2.8.3. SWOT Analysis
- 16.2.8.4. Recent Developments
- 16.2.8.5. Financials (Based on Availability)
- 16.2.9 NETZSCH Group
- 16.2.9.1. Overview
- 16.2.9.2. Products
- 16.2.9.3. SWOT Analysis
- 16.2.9.4. Recent Developments
- 16.2.9.5. Financials (Based on Availability)
- 16.2.1 Seepex Inc
List of Figures
- Figure 1: Global Progressing Cavity Pump Market Revenue Breakdown (Million, %) by Region 2024 & 2032
- Figure 2: North America Progressing Cavity Pump Market Revenue (Million), by Country 2024 & 2032
- Figure 3: North America Progressing Cavity Pump Market Revenue Share (%), by Country 2024 & 2032
- Figure 4: Europe Progressing Cavity Pump Market Revenue (Million), by Country 2024 & 2032
- Figure 5: Europe Progressing Cavity Pump Market Revenue Share (%), by Country 2024 & 2032
- Figure 6: Asia Pacific Progressing Cavity Pump Market Revenue (Million), by Country 2024 & 2032
- Figure 7: Asia Pacific Progressing Cavity Pump Market Revenue Share (%), by Country 2024 & 2032
- Figure 8: Latin America Progressing Cavity Pump Market Revenue (Million), by Country 2024 & 2032
- Figure 9: Latin America Progressing Cavity Pump Market Revenue Share (%), by Country 2024 & 2032
- Figure 10: Middle East and Africa Progressing Cavity Pump Market Revenue (Million), by Country 2024 & 2032
- Figure 11: Middle East and Africa Progressing Cavity Pump Market Revenue Share (%), by Country 2024 & 2032
- Figure 12: North America Progressing Cavity Pump Market Revenue (Million), by Power Rating 2024 & 2032
- Figure 13: North America Progressing Cavity Pump Market Revenue Share (%), by Power Rating 2024 & 2032
- Figure 14: North America Progressing Cavity Pump Market Revenue (Million), by End-User Vertical 2024 & 2032
- Figure 15: North America Progressing Cavity Pump Market Revenue Share (%), by End-User Vertical 2024 & 2032
- Figure 16: North America Progressing Cavity Pump Market Revenue (Million), by Country 2024 & 2032
- Figure 17: North America Progressing Cavity Pump Market Revenue Share (%), by Country 2024 & 2032
- Figure 18: Europe Progressing Cavity Pump Market Revenue (Million), by Power Rating 2024 & 2032
- Figure 19: Europe Progressing Cavity Pump Market Revenue Share (%), by Power Rating 2024 & 2032
- Figure 20: Europe Progressing Cavity Pump Market Revenue (Million), by End-User Vertical 2024 & 2032
- Figure 21: Europe Progressing Cavity Pump Market Revenue Share (%), by End-User Vertical 2024 & 2032
- Figure 22: Europe Progressing Cavity Pump Market Revenue (Million), by Country 2024 & 2032
- Figure 23: Europe Progressing Cavity Pump Market Revenue Share (%), by Country 2024 & 2032
- Figure 24: Asia Pacific Progressing Cavity Pump Market Revenue (Million), by Power Rating 2024 & 2032
- Figure 25: Asia Pacific Progressing Cavity Pump Market Revenue Share (%), by Power Rating 2024 & 2032
- Figure 26: Asia Pacific Progressing Cavity Pump Market Revenue (Million), by End-User Vertical 2024 & 2032
- Figure 27: Asia Pacific Progressing Cavity Pump Market Revenue Share (%), by End-User Vertical 2024 & 2032
- Figure 28: Asia Pacific Progressing Cavity Pump Market Revenue (Million), by Country 2024 & 2032
- Figure 29: Asia Pacific Progressing Cavity Pump Market Revenue Share (%), by Country 2024 & 2032
- Figure 30: Latin America Progressing Cavity Pump Market Revenue (Million), by Power Rating 2024 & 2032
- Figure 31: Latin America Progressing Cavity Pump Market Revenue Share (%), by Power Rating 2024 & 2032
- Figure 32: Latin America Progressing Cavity Pump Market Revenue (Million), by End-User Vertical 2024 & 2032
- Figure 33: Latin America Progressing Cavity Pump Market Revenue Share (%), by End-User Vertical 2024 & 2032
- Figure 34: Latin America Progressing Cavity Pump Market Revenue (Million), by Country 2024 & 2032
- Figure 35: Latin America Progressing Cavity Pump Market Revenue Share (%), by Country 2024 & 2032
- Figure 36: Middle East and Africa Progressing Cavity Pump Market Revenue (Million), by Power Rating 2024 & 2032
- Figure 37: Middle East and Africa Progressing Cavity Pump Market Revenue Share (%), by Power Rating 2024 & 2032
- Figure 38: Middle East and Africa Progressing Cavity Pump Market Revenue (Million), by End-User Vertical 2024 & 2032
- Figure 39: Middle East and Africa Progressing Cavity Pump Market Revenue Share (%), by End-User Vertical 2024 & 2032
- Figure 40: Middle East and Africa Progressing Cavity Pump Market Revenue (Million), by Country 2024 & 2032
- Figure 41: Middle East and Africa Progressing Cavity Pump Market Revenue Share (%), by Country 2024 & 2032
List of Tables
- Table 1: Global Progressing Cavity Pump Market Revenue Million Forecast, by Region 2019 & 2032
- Table 2: Global Progressing Cavity Pump Market Revenue Million Forecast, by Power Rating 2019 & 2032
- Table 3: Global Progressing Cavity Pump Market Revenue Million Forecast, by End-User Vertical 2019 & 2032
- Table 4: Global Progressing Cavity Pump Market Revenue Million Forecast, by Region 2019 & 2032
- Table 5: Global Progressing Cavity Pump Market Revenue Million Forecast, by Country 2019 & 2032
- Table 6: Progressing Cavity Pump Market Revenue (Million) Forecast, by Application 2019 & 2032
- Table 7: Global Progressing Cavity Pump Market Revenue Million Forecast, by Country 2019 & 2032
- Table 8: Progressing Cavity Pump Market Revenue (Million) Forecast, by Application 2019 & 2032
- Table 9: Global Progressing Cavity Pump Market Revenue Million Forecast, by Country 2019 & 2032
- Table 10: Progressing Cavity Pump Market Revenue (Million) Forecast, by Application 2019 & 2032
- Table 11: Global Progressing Cavity Pump Market Revenue Million Forecast, by Country 2019 & 2032
- Table 12: Progressing Cavity Pump Market Revenue (Million) Forecast, by Application 2019 & 2032
- Table 13: Global Progressing Cavity Pump Market Revenue Million Forecast, by Country 2019 & 2032
- Table 14: Progressing Cavity Pump Market Revenue (Million) Forecast, by Application 2019 & 2032
- Table 15: Global Progressing Cavity Pump Market Revenue Million Forecast, by Power Rating 2019 & 2032
- Table 16: Global Progressing Cavity Pump Market Revenue Million Forecast, by End-User Vertical 2019 & 2032
- Table 17: Global Progressing Cavity Pump Market Revenue Million Forecast, by Country 2019 & 2032
- Table 18: Global Progressing Cavity Pump Market Revenue Million Forecast, by Power Rating 2019 & 2032
- Table 19: Global Progressing Cavity Pump Market Revenue Million Forecast, by End-User Vertical 2019 & 2032
- Table 20: Global Progressing Cavity Pump Market Revenue Million Forecast, by Country 2019 & 2032
- Table 21: Global Progressing Cavity Pump Market Revenue Million Forecast, by Power Rating 2019 & 2032
- Table 22: Global Progressing Cavity Pump Market Revenue Million Forecast, by End-User Vertical 2019 & 2032
- Table 23: Global Progressing Cavity Pump Market Revenue Million Forecast, by Country 2019 & 2032
- Table 24: Global Progressing Cavity Pump Market Revenue Million Forecast, by Power Rating 2019 & 2032
- Table 25: Global Progressing Cavity Pump Market Revenue Million Forecast, by End-User Vertical 2019 & 2032
- Table 26: Global Progressing Cavity Pump Market Revenue Million Forecast, by Country 2019 & 2032
- Table 27: Global Progressing Cavity Pump Market Revenue Million Forecast, by Power Rating 2019 & 2032
- Table 28: Global Progressing Cavity Pump Market Revenue Million Forecast, by End-User Vertical 2019 & 2032
- Table 29: Global Progressing Cavity Pump Market Revenue Million Forecast, by Country 2019 & 2032
Frequently Asked Questions
1. What is the projected Compound Annual Growth Rate (CAGR) of the Progressing Cavity Pump Market?
The projected CAGR is approximately 5.80%.
2. Which companies are prominent players in the Progressing Cavity Pump Market?
Key companies in the market include Seepex Inc, Xylem Inc, Weatherford International PLC, ChampionX*List Not Exhaustive, Halliburton Company, National-Oilwell Varco Inc, PCM Group, Schlumberger Limited, NETZSCH Group.
3. What are the main segments of the Progressing Cavity Pump Market?
The market segments include Power Rating, End-User Vertical.
4. Can you provide details about the market size?
The market size is estimated to be USD XX Million as of 2022.
5. What are some drivers contributing to market growth?
Increasing Demand From Water and Wastewater Management Infrastructure Industry Across the World; Suitability for Handling High-viscosity Fluids.
6. What are the notable trends driving market growth?
Waste and Wastewater is Expected to Hold Major Share.
7. Are there any restraints impacting market growth?
High Deployment and Maintenance Cost.
8. Can you provide examples of recent developments in the market?
February 2023: Netzsch Pumps & Systems has announced expanding its production and logistics in East Asia. The production plant relocation in Lanzhou, China, is the leading investment. The "Lanzhou New Plant" project is expanding the Lanzhou site's production and logistics network, strengthening its presence in East Asia, and resulting in a significant rise in the number of pumps manufactured here in Lanzhou each year.
9. What pricing options are available for accessing the report?
Pricing options include single-user, multi-user, and enterprise licenses priced at USD 4750, USD 5250, and USD 8750 respectively.
10. Is the market size provided in terms of value or volume?
The market size is provided in terms of value, measured in Million.
11. Are there any specific market keywords associated with the report?
Yes, the market keyword associated with the report is "Progressing Cavity Pump Market," which aids in identifying and referencing the specific market segment covered.
12. How do I determine which pricing option suits my needs best?
The pricing options vary based on user requirements and access needs. Individual users may opt for single-user licenses, while businesses requiring broader access may choose multi-user or enterprise licenses for cost-effective access to the report.
13. Are there any additional resources or data provided in the Progressing Cavity Pump Market report?
While the report offers comprehensive insights, it's advisable to review the specific contents or supplementary materials provided to ascertain if additional resources or data are available.
14. How can I stay updated on further developments or reports in the Progressing Cavity Pump Market?
To stay informed about further developments, trends, and reports in the Progressing Cavity Pump Market, consider subscribing to industry newsletters, following relevant companies and organizations, or regularly checking reputable industry news sources and publications.
Methodology
Step 1 - Identification of Relevant Samples Size from Population Database


Step 2 - Approaches for Defining Global Market Size (Value, Volume* & Price*)

Note*: In applicable scenarios
Step 3 - Data Sources
Primary Research
- Web Analytics
- Survey Reports
- Research Institute
- Latest Research Reports
- Opinion Leaders
Secondary Research
- Annual Reports
- White Paper
- Latest Press Release
- Industry Association
- Paid Database
- Investor Presentations

Step 4 - Data Triangulation
Involves using different sources of information in order to increase the validity of a study
These sources are likely to be stakeholders in a program - participants, other researchers, program staff, other community members, and so on.
Then we put all data in single framework & apply various statistical tools to find out the dynamic on the market.
During the analysis stage, feedback from the stakeholder groups would be compared to determine areas of agreement as well as areas of divergence


