
Key Insights
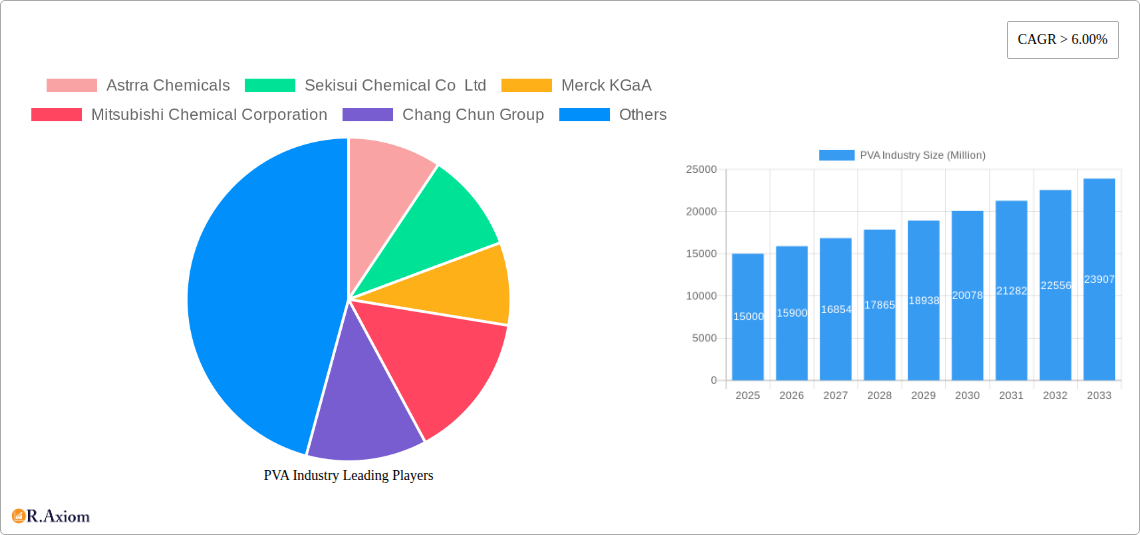
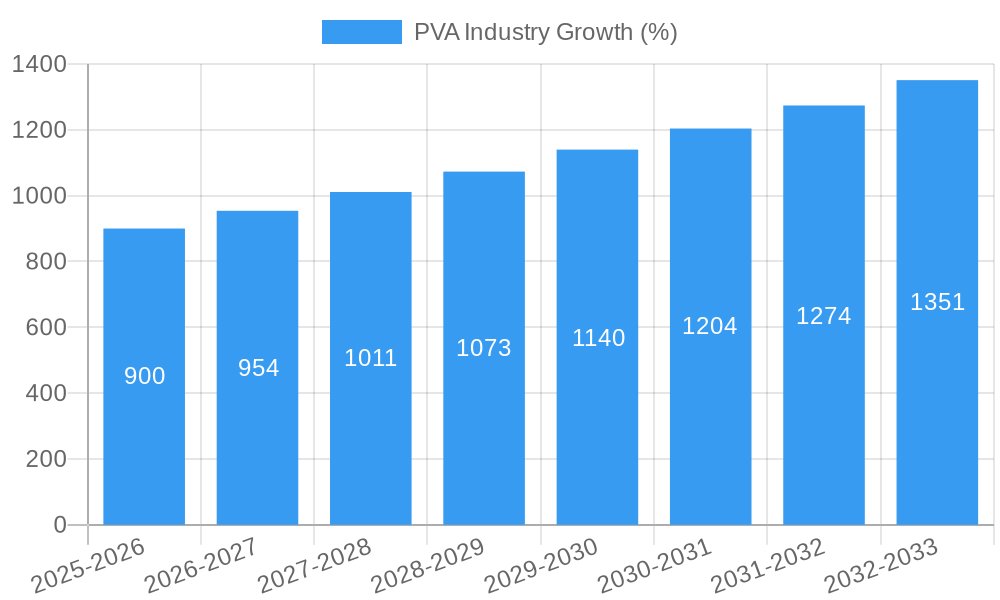
The global Polyvinyl Alcohol (PVA) market is experiencing robust growth, projected to maintain a Compound Annual Growth Rate (CAGR) exceeding 6% from 2025 to 2033. This expansion is fueled by several key drivers. The increasing demand for sustainable and biodegradable packaging solutions in the food industry is significantly boosting PVA consumption. Furthermore, the construction sector's reliance on PVA-based adhesives and binders, coupled with its use in paper manufacturing for improved strength and water resistance, contributes substantially to market growth. Technological advancements leading to the development of specialized PVA grades like low-foaming and tactified varieties further cater to niche applications within electronics and textiles, expanding the market's reach. While some restraints might exist due to fluctuating raw material prices and potential environmental concerns regarding specific manufacturing processes, these are largely outweighed by the strong and diversified demand across various sectors. The Asia-Pacific region, particularly China and India, are expected to remain key growth drivers due to their burgeoning economies and expanding industrial sectors. Competition among established players like Sekisui Chemical, Merck KGaA, and Mitsubishi Chemical, along with emerging regional manufacturers, is fostering innovation and driving down costs, making PVA an increasingly attractive material for diverse applications. The market segmentation by grade (fully, partially, and sub-partially hydrolyzed, etc.) reflects the specific needs of different applications, showcasing the market's maturity and ability to adapt to evolving technological demands.
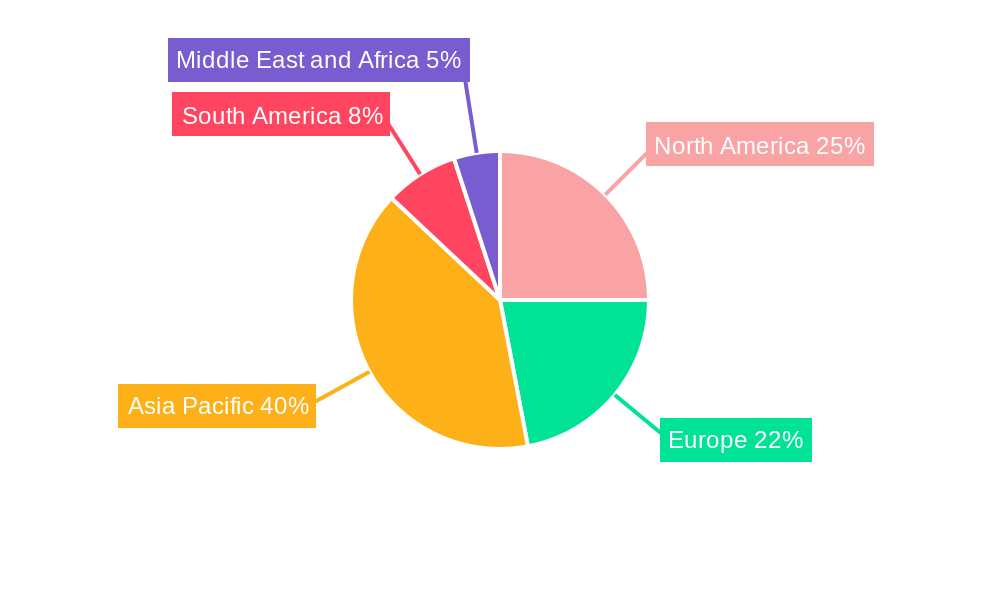
The market is witnessing a shift towards higher-performance PVA grades tailored for specific end-use applications. This includes increased demand for low-foaming grades in applications demanding precise control over foaming behavior, and the growth of specialized grades like tactified PVA which enhances certain properties like film forming ability. Furthermore, regional variations in market dynamics are evident, with North America and Europe demonstrating steady growth driven by established industries and regulatory frameworks, while Asia Pacific presents significant growth potential due to rapid industrialization and infrastructure development. The continued focus on sustainability and eco-friendly materials will likely further propel the adoption of PVA, especially in packaging and construction. This trend, along with ongoing research and development efforts to improve PVA properties and expand its applications, positions the market for continued expansion in the coming years. Analyzing the market performance across different segments – from fully hydrolyzed to other specialized grades – provides valuable insights for strategic decision-making within the PVA industry.
PVA Industry Market Report: 2019-2033
This comprehensive report provides an in-depth analysis of the global Polyvinyl Alcohol (PVA) industry, encompassing market size, growth projections, competitive landscape, and key trends from 2019 to 2033. The report utilizes a robust methodology, incorporating historical data (2019-2024), a base year of 2025, and forecast data extending to 2033. This in-depth analysis caters to industry stakeholders, investors, and businesses seeking strategic insights into this dynamic market. The study period covers 2019-2033, with 2025 as the base and estimated year. The forecast period is 2025-2033.
PVA Industry Market Concentration & Innovation
The global PVA market exhibits a moderately concentrated structure, with a few major players holding significant market share. Astrra Chemicals, Sekisui Chemical Co Ltd, Merck KGaA, Mitsubishi Chemical Corporation, and Chang Chun Group are prominent examples, though the market is not limited to these companies. Estimates suggest that the top five players collectively hold approximately xx% of the global market share in 2025. Innovation in the PVA industry is driven by the need for improved performance characteristics, such as enhanced water solubility, increased strength, and better film-forming properties. Regulatory frameworks, including those concerning environmental impact and safety, significantly influence product development and manufacturing processes. Product substitutes, such as starch-based polymers, pose a competitive challenge, pushing innovation toward cost-effective and environmentally friendly PVA alternatives. End-user trends, particularly in the packaging and construction sectors, are shaping demand for specialized PVA grades. The past five years have witnessed moderate M&A activity, with deal values totaling approximately $xx Million, primarily focused on expanding geographic reach and product portfolios.
- Market Share: Top 5 players hold approximately xx% of the market (2025).
- M&A Activity (2019-2024): Total deal value approximately $xx Million.
- Key Innovation Drivers: Improved performance, environmental regulations, and cost-effectiveness.
PVA Industry Industry Trends & Insights
The global PVA market is projected to experience robust growth, with a Compound Annual Growth Rate (CAGR) of xx% during the forecast period (2025-2033). This growth is primarily fueled by rising demand from key end-user industries, including food packaging, construction, and textiles. Technological advancements, particularly in polymerization techniques and grade modifications, are contributing to the development of high-performance PVA products with tailored properties. Consumer preferences for eco-friendly and sustainable packaging solutions are driving demand for biodegradable PVA alternatives. The competitive landscape is characterized by intense rivalry among established players and emerging entrants, prompting continuous innovation and strategic partnerships. Market penetration of specialized PVA grades, such as low-foaming grades and tactified grades, is expected to increase significantly, driven by the growing need for specific applications. The market size is estimated to reach $xx Million by 2033.
Dominant Markets & Segments in PVA Industry
The Asia-Pacific region dominates the global PVA market, driven by robust economic growth, expanding infrastructure development, and a large manufacturing base. Within this region, China and Japan are the leading national markets.
Dominant Segments:
- Grade: Fully Hydrolyzed PVA holds the largest market share due to its extensive applications across various industries. Partially hydrolyzed PVA is also significant, showing steady growth due to its unique properties suitable for specific applications. The market for Sub-partially Hydrolyzed, Low Foaming, and Other Grades (Tactified and Fine Particle) is expected to witness significant growth driven by increasing demand for specialized applications within end user industries.
- End User: The Food Packaging segment is currently the largest end-use sector due to the increasing demand for safe and sustainable packaging materials, closely followed by the Paper Manufacturing segment, with substantial use in paper coatings and adhesives. The Construction sector is growing rapidly because of PVA's utility as a binder and adhesive in construction materials.
Key Drivers:
- Asia-Pacific: Rapid industrialization, infrastructure development, and increasing consumer spending.
- Fully Hydrolyzed PVA: Wide range of applications across various industries.
- Food Packaging: Growing demand for safe and sustainable packaging.
PVA Industry Product Developments
Recent product innovations in the PVA industry focus on developing specialized grades with enhanced properties, such as improved water resistance, higher strength, and tailored film-forming capabilities. These advancements cater to specific applications in various end-user industries, providing competitive advantages in terms of performance and cost-effectiveness. Technological trends such as nanotechnology and bio-based modifications are shaping the development of next-generation PVA materials with superior functionalities and eco-friendly attributes.
Report Scope & Segmentation Analysis
This report provides a comprehensive segmentation analysis of the PVA market across various grades and end-use industries.
Grades: Fully Hydrolyzed, Partially Hydrolyzed, Sub-partially Hydrolyzed, Low Foaming Grades, Other Grades (Tactified Grades and Fine Particle Grades). Each grade segment is analyzed based on its market size, growth projections, and competitive dynamics.
End-Use Industries: Food Packaging, Paper Manufacturing, Construction, Electronics, Textile Manufacturing, Other End-User Industries. Each end-use segment's market size, growth prospects, and key applications are thoroughly examined, incorporating competitive dynamics and leading players.
Key Drivers of PVA Industry Growth
The PVA industry's growth is propelled by several key factors: the expanding global packaging sector, particularly the demand for sustainable alternatives, the construction industry's continuous development, and technological advancements leading to improved PVA properties and applications. Stringent environmental regulations also drive the adoption of PVA as a less harmful alternative to other adhesives and binders.
Challenges in the PVA Industry Sector
Challenges facing the PVA industry include fluctuating raw material prices, increasing competition from alternative materials, and stringent environmental regulations that necessitate continuous improvement in manufacturing processes and product formulations. Supply chain disruptions can also significantly impact production and market stability.
Emerging Opportunities in PVA Industry
Emerging opportunities lie in the development of bio-based PVA, catering to the growing demand for sustainable materials, and in exploring new applications in emerging sectors like renewable energy and advanced materials. Customization of PVA properties to address specific end-user needs also represents a significant growth opportunity.
Leading Players in the PVA Industry Market
- Astrra Chemicals
- Sekisui Chemical Co Ltd (Sekisui Chemical Co Ltd)
- Merck KGaA (Merck KGaA)
- Mitsubishi Chemical Corporation (Mitsubishi Chemical Corporation)
- Chang Chun Group
- SNP Inc
- Kemipex
- Kuraray Europe GmbH (Kuraray Europe GmbH)
- Anhui Wanwei Group
- Japan Vam & Poval Co Ltd
- Polysciences Inc
Key Developments in PVA Industry Industry
- August 2022: Sekisui Specialty Chemicals (SSC) initiated feasibility studies to expand its PVOH supply network, aiming for a 25% capacity increase.
- November 2021: Kuraray Poval launched a new sales organization in Iberia, enhancing its market reach and customer service.
Strategic Outlook for PVA Industry Market
The PVA industry is poised for continued growth, driven by increasing demand from key end-use sectors and ongoing innovation in material properties and applications. The focus on sustainability and the development of bio-based PVA will be key growth catalysts in the coming years, shaping the future of this dynamic market. The potential for market expansion into niche applications and emerging economies presents significant opportunities for industry players.
PVA Industry Segmentation
-
1. Grade
- 1.1. Fully Hydrolyzed
- 1.2. Partially Hydrolyzed
- 1.3. Sub-partially Hydrolyzed
- 1.4. Low Foaming Grades
- 1.5. Other Gr
-
2. End User
- 2.1. Food Packaging
- 2.2. Paper Manufacturing
- 2.3. Construction
- 2.4. Electronics
- 2.5. Textile Manufacturing
- 2.6. Other End User Industries
PVA Industry Segmentation By Geography
-
1. Asia Pacific
- 1.1. China
- 1.2. India
- 1.3. Japan
- 1.4. South Korea
- 1.5. Rest of Asia Pacific
-
2. North America
- 2.1. United States
- 2.2. Canada
- 2.3. Mexico
-
3. Europe
- 3.1. Germany
- 3.2. United Kingdom
- 3.3. Italy
- 3.4. France
- 3.5. Rest of Europe
-
4. South America
- 4.1. Brazil
- 4.2. Argentina
- 4.3. Rest of South America
-
5. Middle East and Africa
- 5.1. Saudi Arabia
- 5.2. South Africa
- 5.3. Rest of Middle East and Africa
PVA Industry REPORT HIGHLIGHTS
| Aspects | Details |
|---|---|
| Study Period | 2019-2033 |
| Base Year | 2024 |
| Estimated Year | 2025 |
| Forecast Period | 2025-2033 |
| Historical Period | 2019-2024 |
| Growth Rate | CAGR of > 6.00% from 2019-2033 |
| Segmentation |
|
Table of Contents
- 1. Introduction
- 1.1. Research Scope
- 1.2. Market Segmentation
- 1.3. Research Methodology
- 1.4. Definitions and Assumptions
- 2. Executive Summary
- 2.1. Introduction
- 3. Market Dynamics
- 3.1. Introduction
- 3.2. Market Drivers
- 3.2.1. Increasing Use in the Construction Industry; Growing Food Packaging Industry
- 3.3. Market Restrains
- 3.3.1. Hazardous Health Effects While Manufacturing
- 3.4. Market Trends
- 3.4.1. Food Packaging to Dominate the Market
- 4. Market Factor Analysis
- 4.1. Porters Five Forces
- 4.2. Supply/Value Chain
- 4.3. PESTEL analysis
- 4.4. Market Entropy
- 4.5. Patent/Trademark Analysis
- 5. Global PVA Industry Analysis, Insights and Forecast, 2019-2031
- 5.1. Market Analysis, Insights and Forecast - by Grade
- 5.1.1. Fully Hydrolyzed
- 5.1.2. Partially Hydrolyzed
- 5.1.3. Sub-partially Hydrolyzed
- 5.1.4. Low Foaming Grades
- 5.1.5. Other Gr
- 5.2. Market Analysis, Insights and Forecast - by End User
- 5.2.1. Food Packaging
- 5.2.2. Paper Manufacturing
- 5.2.3. Construction
- 5.2.4. Electronics
- 5.2.5. Textile Manufacturing
- 5.2.6. Other End User Industries
- 5.3. Market Analysis, Insights and Forecast - by Region
- 5.3.1. Asia Pacific
- 5.3.2. North America
- 5.3.3. Europe
- 5.3.4. South America
- 5.3.5. Middle East and Africa
- 5.1. Market Analysis, Insights and Forecast - by Grade
- 6. Asia Pacific PVA Industry Analysis, Insights and Forecast, 2019-2031
- 6.1. Market Analysis, Insights and Forecast - by Grade
- 6.1.1. Fully Hydrolyzed
- 6.1.2. Partially Hydrolyzed
- 6.1.3. Sub-partially Hydrolyzed
- 6.1.4. Low Foaming Grades
- 6.1.5. Other Gr
- 6.2. Market Analysis, Insights and Forecast - by End User
- 6.2.1. Food Packaging
- 6.2.2. Paper Manufacturing
- 6.2.3. Construction
- 6.2.4. Electronics
- 6.2.5. Textile Manufacturing
- 6.2.6. Other End User Industries
- 6.1. Market Analysis, Insights and Forecast - by Grade
- 7. North America PVA Industry Analysis, Insights and Forecast, 2019-2031
- 7.1. Market Analysis, Insights and Forecast - by Grade
- 7.1.1. Fully Hydrolyzed
- 7.1.2. Partially Hydrolyzed
- 7.1.3. Sub-partially Hydrolyzed
- 7.1.4. Low Foaming Grades
- 7.1.5. Other Gr
- 7.2. Market Analysis, Insights and Forecast - by End User
- 7.2.1. Food Packaging
- 7.2.2. Paper Manufacturing
- 7.2.3. Construction
- 7.2.4. Electronics
- 7.2.5. Textile Manufacturing
- 7.2.6. Other End User Industries
- 7.1. Market Analysis, Insights and Forecast - by Grade
- 8. Europe PVA Industry Analysis, Insights and Forecast, 2019-2031
- 8.1. Market Analysis, Insights and Forecast - by Grade
- 8.1.1. Fully Hydrolyzed
- 8.1.2. Partially Hydrolyzed
- 8.1.3. Sub-partially Hydrolyzed
- 8.1.4. Low Foaming Grades
- 8.1.5. Other Gr
- 8.2. Market Analysis, Insights and Forecast - by End User
- 8.2.1. Food Packaging
- 8.2.2. Paper Manufacturing
- 8.2.3. Construction
- 8.2.4. Electronics
- 8.2.5. Textile Manufacturing
- 8.2.6. Other End User Industries
- 8.1. Market Analysis, Insights and Forecast - by Grade
- 9. South America PVA Industry Analysis, Insights and Forecast, 2019-2031
- 9.1. Market Analysis, Insights and Forecast - by Grade
- 9.1.1. Fully Hydrolyzed
- 9.1.2. Partially Hydrolyzed
- 9.1.3. Sub-partially Hydrolyzed
- 9.1.4. Low Foaming Grades
- 9.1.5. Other Gr
- 9.2. Market Analysis, Insights and Forecast - by End User
- 9.2.1. Food Packaging
- 9.2.2. Paper Manufacturing
- 9.2.3. Construction
- 9.2.4. Electronics
- 9.2.5. Textile Manufacturing
- 9.2.6. Other End User Industries
- 9.1. Market Analysis, Insights and Forecast - by Grade
- 10. Middle East and Africa PVA Industry Analysis, Insights and Forecast, 2019-2031
- 10.1. Market Analysis, Insights and Forecast - by Grade
- 10.1.1. Fully Hydrolyzed
- 10.1.2. Partially Hydrolyzed
- 10.1.3. Sub-partially Hydrolyzed
- 10.1.4. Low Foaming Grades
- 10.1.5. Other Gr
- 10.2. Market Analysis, Insights and Forecast - by End User
- 10.2.1. Food Packaging
- 10.2.2. Paper Manufacturing
- 10.2.3. Construction
- 10.2.4. Electronics
- 10.2.5. Textile Manufacturing
- 10.2.6. Other End User Industries
- 10.1. Market Analysis, Insights and Forecast - by Grade
- 11. Asia Pacific PVA Industry Analysis, Insights and Forecast, 2019-2031
- 11.1. Market Analysis, Insights and Forecast - By Country/Sub-region
- 11.1.1 China
- 11.1.2 India
- 11.1.3 Japan
- 11.1.4 South Korea
- 11.1.5 Rest of Asia Pacific
- 12. North America PVA Industry Analysis, Insights and Forecast, 2019-2031
- 12.1. Market Analysis, Insights and Forecast - By Country/Sub-region
- 12.1.1 United States
- 12.1.2 Canada
- 12.1.3 Mexico
- 13. Europe PVA Industry Analysis, Insights and Forecast, 2019-2031
- 13.1. Market Analysis, Insights and Forecast - By Country/Sub-region
- 13.1.1 Germany
- 13.1.2 United Kingdom
- 13.1.3 Italy
- 13.1.4 France
- 13.1.5 Rest of Europe
- 14. South America PVA Industry Analysis, Insights and Forecast, 2019-2031
- 14.1. Market Analysis, Insights and Forecast - By Country/Sub-region
- 14.1.1 Brazil
- 14.1.2 Argentina
- 14.1.3 Rest of South America
- 15. Middle East and Africa PVA Industry Analysis, Insights and Forecast, 2019-2031
- 15.1. Market Analysis, Insights and Forecast - By Country/Sub-region
- 15.1.1 Saudi Arabia
- 15.1.2 South Africa
- 15.1.3 Rest of Middle East and Africa
- 16. Competitive Analysis
- 16.1. Global Market Share Analysis 2024
- 16.2. Company Profiles
- 16.2.1 Astrra Chemicals
- 16.2.1.1. Overview
- 16.2.1.2. Products
- 16.2.1.3. SWOT Analysis
- 16.2.1.4. Recent Developments
- 16.2.1.5. Financials (Based on Availability)
- 16.2.2 Sekisui Chemical Co Ltd
- 16.2.2.1. Overview
- 16.2.2.2. Products
- 16.2.2.3. SWOT Analysis
- 16.2.2.4. Recent Developments
- 16.2.2.5. Financials (Based on Availability)
- 16.2.3 Merck KGaA
- 16.2.3.1. Overview
- 16.2.3.2. Products
- 16.2.3.3. SWOT Analysis
- 16.2.3.4. Recent Developments
- 16.2.3.5. Financials (Based on Availability)
- 16.2.4 Mitsubishi Chemical Corporation
- 16.2.4.1. Overview
- 16.2.4.2. Products
- 16.2.4.3. SWOT Analysis
- 16.2.4.4. Recent Developments
- 16.2.4.5. Financials (Based on Availability)
- 16.2.5 Chang Chun Group
- 16.2.5.1. Overview
- 16.2.5.2. Products
- 16.2.5.3. SWOT Analysis
- 16.2.5.4. Recent Developments
- 16.2.5.5. Financials (Based on Availability)
- 16.2.6 SNP Inc *List Not Exhaustive
- 16.2.6.1. Overview
- 16.2.6.2. Products
- 16.2.6.3. SWOT Analysis
- 16.2.6.4. Recent Developments
- 16.2.6.5. Financials (Based on Availability)
- 16.2.7 Kemipex
- 16.2.7.1. Overview
- 16.2.7.2. Products
- 16.2.7.3. SWOT Analysis
- 16.2.7.4. Recent Developments
- 16.2.7.5. Financials (Based on Availability)
- 16.2.8 Kuraray Europe GmbH
- 16.2.8.1. Overview
- 16.2.8.2. Products
- 16.2.8.3. SWOT Analysis
- 16.2.8.4. Recent Developments
- 16.2.8.5. Financials (Based on Availability)
- 16.2.9 Anhui Wanwei Group
- 16.2.9.1. Overview
- 16.2.9.2. Products
- 16.2.9.3. SWOT Analysis
- 16.2.9.4. Recent Developments
- 16.2.9.5. Financials (Based on Availability)
- 16.2.10 Japan Vam & Poval Co Ltd
- 16.2.10.1. Overview
- 16.2.10.2. Products
- 16.2.10.3. SWOT Analysis
- 16.2.10.4. Recent Developments
- 16.2.10.5. Financials (Based on Availability)
- 16.2.11 Polysciences Inc
- 16.2.11.1. Overview
- 16.2.11.2. Products
- 16.2.11.3. SWOT Analysis
- 16.2.11.4. Recent Developments
- 16.2.11.5. Financials (Based on Availability)
- 16.2.1 Astrra Chemicals
List of Figures
- Figure 1: Global PVA Industry Revenue Breakdown (Million, %) by Region 2024 & 2032
- Figure 2: Asia Pacific PVA Industry Revenue (Million), by Country 2024 & 2032
- Figure 3: Asia Pacific PVA Industry Revenue Share (%), by Country 2024 & 2032
- Figure 4: North America PVA Industry Revenue (Million), by Country 2024 & 2032
- Figure 5: North America PVA Industry Revenue Share (%), by Country 2024 & 2032
- Figure 6: Europe PVA Industry Revenue (Million), by Country 2024 & 2032
- Figure 7: Europe PVA Industry Revenue Share (%), by Country 2024 & 2032
- Figure 8: South America PVA Industry Revenue (Million), by Country 2024 & 2032
- Figure 9: South America PVA Industry Revenue Share (%), by Country 2024 & 2032
- Figure 10: Middle East and Africa PVA Industry Revenue (Million), by Country 2024 & 2032
- Figure 11: Middle East and Africa PVA Industry Revenue Share (%), by Country 2024 & 2032
- Figure 12: Asia Pacific PVA Industry Revenue (Million), by Grade 2024 & 2032
- Figure 13: Asia Pacific PVA Industry Revenue Share (%), by Grade 2024 & 2032
- Figure 14: Asia Pacific PVA Industry Revenue (Million), by End User 2024 & 2032
- Figure 15: Asia Pacific PVA Industry Revenue Share (%), by End User 2024 & 2032
- Figure 16: Asia Pacific PVA Industry Revenue (Million), by Country 2024 & 2032
- Figure 17: Asia Pacific PVA Industry Revenue Share (%), by Country 2024 & 2032
- Figure 18: North America PVA Industry Revenue (Million), by Grade 2024 & 2032
- Figure 19: North America PVA Industry Revenue Share (%), by Grade 2024 & 2032
- Figure 20: North America PVA Industry Revenue (Million), by End User 2024 & 2032
- Figure 21: North America PVA Industry Revenue Share (%), by End User 2024 & 2032
- Figure 22: North America PVA Industry Revenue (Million), by Country 2024 & 2032
- Figure 23: North America PVA Industry Revenue Share (%), by Country 2024 & 2032
- Figure 24: Europe PVA Industry Revenue (Million), by Grade 2024 & 2032
- Figure 25: Europe PVA Industry Revenue Share (%), by Grade 2024 & 2032
- Figure 26: Europe PVA Industry Revenue (Million), by End User 2024 & 2032
- Figure 27: Europe PVA Industry Revenue Share (%), by End User 2024 & 2032
- Figure 28: Europe PVA Industry Revenue (Million), by Country 2024 & 2032
- Figure 29: Europe PVA Industry Revenue Share (%), by Country 2024 & 2032
- Figure 30: South America PVA Industry Revenue (Million), by Grade 2024 & 2032
- Figure 31: South America PVA Industry Revenue Share (%), by Grade 2024 & 2032
- Figure 32: South America PVA Industry Revenue (Million), by End User 2024 & 2032
- Figure 33: South America PVA Industry Revenue Share (%), by End User 2024 & 2032
- Figure 34: South America PVA Industry Revenue (Million), by Country 2024 & 2032
- Figure 35: South America PVA Industry Revenue Share (%), by Country 2024 & 2032
- Figure 36: Middle East and Africa PVA Industry Revenue (Million), by Grade 2024 & 2032
- Figure 37: Middle East and Africa PVA Industry Revenue Share (%), by Grade 2024 & 2032
- Figure 38: Middle East and Africa PVA Industry Revenue (Million), by End User 2024 & 2032
- Figure 39: Middle East and Africa PVA Industry Revenue Share (%), by End User 2024 & 2032
- Figure 40: Middle East and Africa PVA Industry Revenue (Million), by Country 2024 & 2032
- Figure 41: Middle East and Africa PVA Industry Revenue Share (%), by Country 2024 & 2032
List of Tables
- Table 1: Global PVA Industry Revenue Million Forecast, by Region 2019 & 2032
- Table 2: Global PVA Industry Revenue Million Forecast, by Grade 2019 & 2032
- Table 3: Global PVA Industry Revenue Million Forecast, by End User 2019 & 2032
- Table 4: Global PVA Industry Revenue Million Forecast, by Region 2019 & 2032
- Table 5: Global PVA Industry Revenue Million Forecast, by Country 2019 & 2032
- Table 6: China PVA Industry Revenue (Million) Forecast, by Application 2019 & 2032
- Table 7: India PVA Industry Revenue (Million) Forecast, by Application 2019 & 2032
- Table 8: Japan PVA Industry Revenue (Million) Forecast, by Application 2019 & 2032
- Table 9: South Korea PVA Industry Revenue (Million) Forecast, by Application 2019 & 2032
- Table 10: Rest of Asia Pacific PVA Industry Revenue (Million) Forecast, by Application 2019 & 2032
- Table 11: Global PVA Industry Revenue Million Forecast, by Country 2019 & 2032
- Table 12: United States PVA Industry Revenue (Million) Forecast, by Application 2019 & 2032
- Table 13: Canada PVA Industry Revenue (Million) Forecast, by Application 2019 & 2032
- Table 14: Mexico PVA Industry Revenue (Million) Forecast, by Application 2019 & 2032
- Table 15: Global PVA Industry Revenue Million Forecast, by Country 2019 & 2032
- Table 16: Germany PVA Industry Revenue (Million) Forecast, by Application 2019 & 2032
- Table 17: United Kingdom PVA Industry Revenue (Million) Forecast, by Application 2019 & 2032
- Table 18: Italy PVA Industry Revenue (Million) Forecast, by Application 2019 & 2032
- Table 19: France PVA Industry Revenue (Million) Forecast, by Application 2019 & 2032
- Table 20: Rest of Europe PVA Industry Revenue (Million) Forecast, by Application 2019 & 2032
- Table 21: Global PVA Industry Revenue Million Forecast, by Country 2019 & 2032
- Table 22: Brazil PVA Industry Revenue (Million) Forecast, by Application 2019 & 2032
- Table 23: Argentina PVA Industry Revenue (Million) Forecast, by Application 2019 & 2032
- Table 24: Rest of South America PVA Industry Revenue (Million) Forecast, by Application 2019 & 2032
- Table 25: Global PVA Industry Revenue Million Forecast, by Country 2019 & 2032
- Table 26: Saudi Arabia PVA Industry Revenue (Million) Forecast, by Application 2019 & 2032
- Table 27: South Africa PVA Industry Revenue (Million) Forecast, by Application 2019 & 2032
- Table 28: Rest of Middle East and Africa PVA Industry Revenue (Million) Forecast, by Application 2019 & 2032
- Table 29: Global PVA Industry Revenue Million Forecast, by Grade 2019 & 2032
- Table 30: Global PVA Industry Revenue Million Forecast, by End User 2019 & 2032
- Table 31: Global PVA Industry Revenue Million Forecast, by Country 2019 & 2032
- Table 32: China PVA Industry Revenue (Million) Forecast, by Application 2019 & 2032
- Table 33: India PVA Industry Revenue (Million) Forecast, by Application 2019 & 2032
- Table 34: Japan PVA Industry Revenue (Million) Forecast, by Application 2019 & 2032
- Table 35: South Korea PVA Industry Revenue (Million) Forecast, by Application 2019 & 2032
- Table 36: Rest of Asia Pacific PVA Industry Revenue (Million) Forecast, by Application 2019 & 2032
- Table 37: Global PVA Industry Revenue Million Forecast, by Grade 2019 & 2032
- Table 38: Global PVA Industry Revenue Million Forecast, by End User 2019 & 2032
- Table 39: Global PVA Industry Revenue Million Forecast, by Country 2019 & 2032
- Table 40: United States PVA Industry Revenue (Million) Forecast, by Application 2019 & 2032
- Table 41: Canada PVA Industry Revenue (Million) Forecast, by Application 2019 & 2032
- Table 42: Mexico PVA Industry Revenue (Million) Forecast, by Application 2019 & 2032
- Table 43: Global PVA Industry Revenue Million Forecast, by Grade 2019 & 2032
- Table 44: Global PVA Industry Revenue Million Forecast, by End User 2019 & 2032
- Table 45: Global PVA Industry Revenue Million Forecast, by Country 2019 & 2032
- Table 46: Germany PVA Industry Revenue (Million) Forecast, by Application 2019 & 2032
- Table 47: United Kingdom PVA Industry Revenue (Million) Forecast, by Application 2019 & 2032
- Table 48: Italy PVA Industry Revenue (Million) Forecast, by Application 2019 & 2032
- Table 49: France PVA Industry Revenue (Million) Forecast, by Application 2019 & 2032
- Table 50: Rest of Europe PVA Industry Revenue (Million) Forecast, by Application 2019 & 2032
- Table 51: Global PVA Industry Revenue Million Forecast, by Grade 2019 & 2032
- Table 52: Global PVA Industry Revenue Million Forecast, by End User 2019 & 2032
- Table 53: Global PVA Industry Revenue Million Forecast, by Country 2019 & 2032
- Table 54: Brazil PVA Industry Revenue (Million) Forecast, by Application 2019 & 2032
- Table 55: Argentina PVA Industry Revenue (Million) Forecast, by Application 2019 & 2032
- Table 56: Rest of South America PVA Industry Revenue (Million) Forecast, by Application 2019 & 2032
- Table 57: Global PVA Industry Revenue Million Forecast, by Grade 2019 & 2032
- Table 58: Global PVA Industry Revenue Million Forecast, by End User 2019 & 2032
- Table 59: Global PVA Industry Revenue Million Forecast, by Country 2019 & 2032
- Table 60: Saudi Arabia PVA Industry Revenue (Million) Forecast, by Application 2019 & 2032
- Table 61: South Africa PVA Industry Revenue (Million) Forecast, by Application 2019 & 2032
- Table 62: Rest of Middle East and Africa PVA Industry Revenue (Million) Forecast, by Application 2019 & 2032
Frequently Asked Questions
1. What is the projected Compound Annual Growth Rate (CAGR) of the PVA Industry?
The projected CAGR is approximately > 6.00%.
2. Which companies are prominent players in the PVA Industry?
Key companies in the market include Astrra Chemicals, Sekisui Chemical Co Ltd, Merck KGaA, Mitsubishi Chemical Corporation, Chang Chun Group, SNP Inc *List Not Exhaustive, Kemipex, Kuraray Europe GmbH, Anhui Wanwei Group, Japan Vam & Poval Co Ltd, Polysciences Inc.
3. What are the main segments of the PVA Industry?
The market segments include Grade, End User.
4. Can you provide details about the market size?
The market size is estimated to be USD XX Million as of 2022.
5. What are some drivers contributing to market growth?
Increasing Use in the Construction Industry; Growing Food Packaging Industry.
6. What are the notable trends driving market growth?
Food Packaging to Dominate the Market.
7. Are there any restraints impacting market growth?
Hazardous Health Effects While Manufacturing.
8. Can you provide examples of recent developments in the market?
August 2022: Sekisui Specialty Chemicals (SSC) began the feasibility studies for expanding its Polyvinyl Alcohol (PVOH) supply network to meet the growing needs of its downstream customers. It will increase Sekisui's PVOH capacity by as much as 25%.
9. What pricing options are available for accessing the report?
Pricing options include single-user, multi-user, and enterprise licenses priced at USD 4750, USD 5250, and USD 8750 respectively.
10. Is the market size provided in terms of value or volume?
The market size is provided in terms of value, measured in Million.
11. Are there any specific market keywords associated with the report?
Yes, the market keyword associated with the report is "PVA Industry," which aids in identifying and referencing the specific market segment covered.
12. How do I determine which pricing option suits my needs best?
The pricing options vary based on user requirements and access needs. Individual users may opt for single-user licenses, while businesses requiring broader access may choose multi-user or enterprise licenses for cost-effective access to the report.
13. Are there any additional resources or data provided in the PVA Industry report?
While the report offers comprehensive insights, it's advisable to review the specific contents or supplementary materials provided to ascertain if additional resources or data are available.
14. How can I stay updated on further developments or reports in the PVA Industry?
To stay informed about further developments, trends, and reports in the PVA Industry, consider subscribing to industry newsletters, following relevant companies and organizations, or regularly checking reputable industry news sources and publications.
Methodology
Step 1 - Identification of Relevant Samples Size from Population Database


Step 2 - Approaches for Defining Global Market Size (Value, Volume* & Price*)

Note*: In applicable scenarios
Step 3 - Data Sources
Primary Research
- Web Analytics
- Survey Reports
- Research Institute
- Latest Research Reports
- Opinion Leaders
Secondary Research
- Annual Reports
- White Paper
- Latest Press Release
- Industry Association
- Paid Database
- Investor Presentations

Step 4 - Data Triangulation
Involves using different sources of information in order to increase the validity of a study
These sources are likely to be stakeholders in a program - participants, other researchers, program staff, other community members, and so on.
Then we put all data in single framework & apply various statistical tools to find out the dynamic on the market.
During the analysis stage, feedback from the stakeholder groups would be compared to determine areas of agreement as well as areas of divergence


