

Key Insights
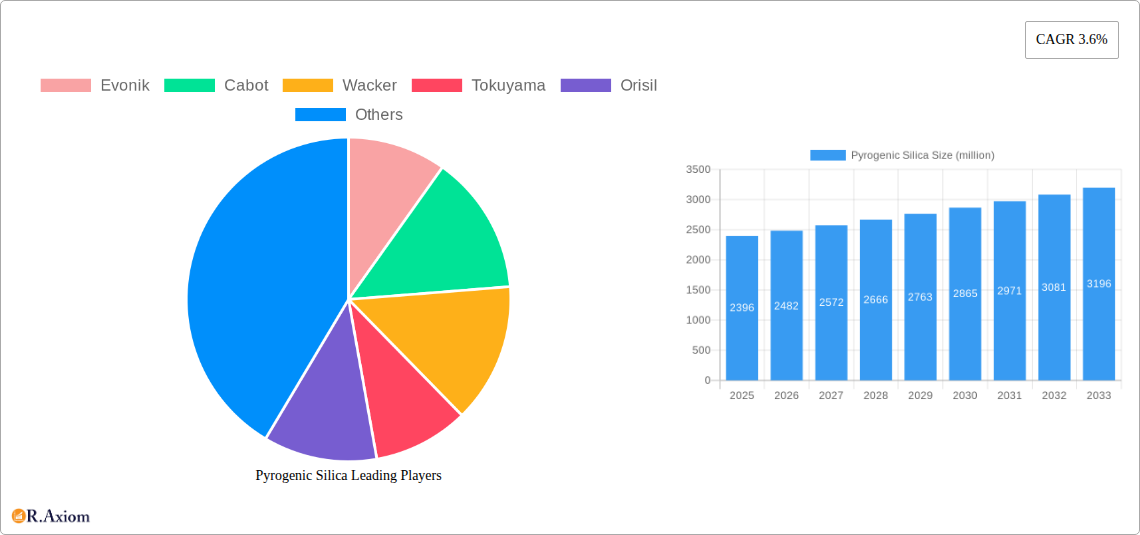
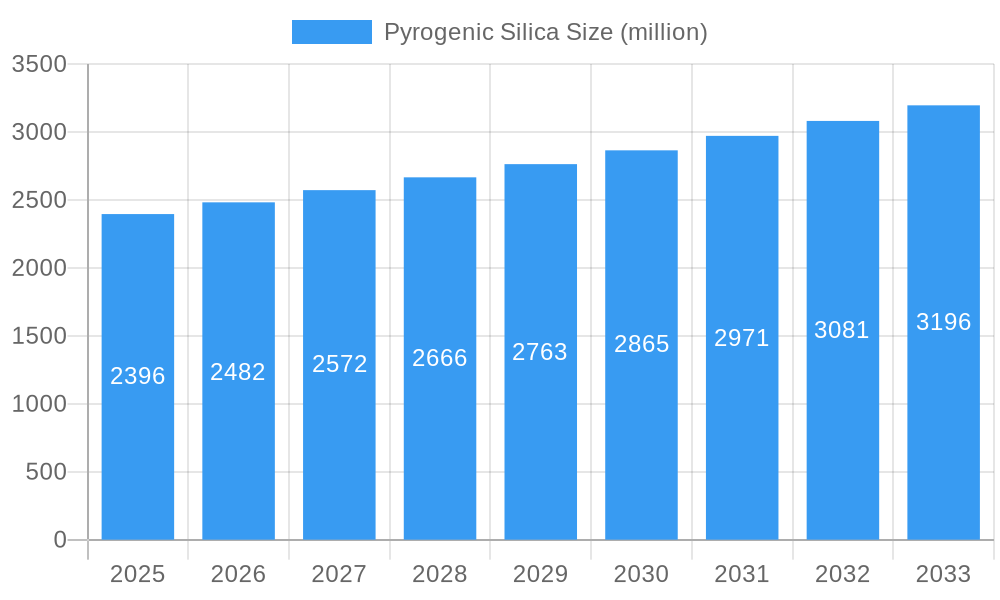
The pyrogenic silica market, valued at $2396 million in 2025, is projected to experience steady growth, driven by increasing demand across diverse sectors. The 3.6% CAGR indicates a consistent expansion through 2033, fueled by several key factors. The automotive industry's reliance on pyrogenic silica for improved tire performance and enhanced plastics is a significant driver, along with the growing construction sector utilizing it in sealants, adhesives, and coatings. Furthermore, the rising adoption of pyrogenic silica in personal care products, due to its excellent rheological properties and ability to enhance texture, contributes to market growth. Technological advancements leading to improved production efficiency and the development of novel applications in advanced materials further stimulate market expansion. Competitive pressures from numerous established players like Evonik, Cabot, and Wacker, alongside emerging regional manufacturers, are shaping the market landscape, fostering innovation and potentially impacting pricing dynamics. While potential supply chain disruptions or fluctuations in raw material prices could act as restraints, the overall market outlook remains positive, underpinned by continuous technological advancements and a broad range of applications.
Pyrogenic Silica Market Size (In Billion)
Despite the positive outlook, certain challenges exist. Maintaining consistent product quality and meeting stringent regulatory requirements are crucial for manufacturers. The market may also face pressure from alternative materials vying for market share in specific applications. However, the versatility of pyrogenic silica and its unique properties suggest that it will maintain its significance across numerous industries for the foreseeable future. The continuous research and development in material science should further propel the market's growth, creating opportunities for both established players and new entrants. Strategic partnerships and mergers & acquisitions could significantly alter the competitive landscape in the coming years.
Pyrogenic Silica Company Market Share
Pyrogenic Silica Market Report: 2019-2033 - A Comprehensive Analysis
This comprehensive report provides an in-depth analysis of the global pyrogenic silica market, offering invaluable insights for industry stakeholders, investors, and strategic decision-makers. Covering the period 2019-2033, with a base year of 2025 and a forecast period of 2025-2033, this report unveils the market's dynamics, trends, and future potential. The report leverages extensive data analysis and expert insights to deliver actionable intelligence across various market segments. The global market size is estimated at $XX million in 2025 and is projected to reach $XX million by 2033, exhibiting a CAGR of XX%.
Pyrogenic Silica Market Concentration & Innovation
The pyrogenic silica market exhibits a moderately concentrated landscape, with several major players controlling a significant market share. Evonik, Cabot, and Wacker Chemie are among the leading producers, collectively accounting for approximately XX% of the global market in 2025. However, the presence of numerous regional and specialized players fosters competition and innovation. The market is characterized by continuous innovation, driven by the demand for specialized grades with enhanced properties for specific applications.
- Market Share (2025, estimated): Evonik (XX%), Cabot (XX%), Wacker (XX%), Others (XX%).
- Innovation Drivers: Emphasis on improved dispersion, enhanced rheological properties, surface modification, and cost-effective manufacturing processes.
- Regulatory Landscape: Stringent environmental regulations regarding silica dust emissions influence manufacturing practices and drive innovation in dust control technologies.
- Product Substitutes: Alternative materials like precipitated silica and fumed alumina compete in certain applications, although pyrogenic silica's unique properties often maintain its dominance.
- End-User Trends: Growing demand from the coatings, adhesives, sealants, and elastomers (CASE) industries, coupled with increasing adoption in personal care and food products, drives market growth.
- M&A Activities: The past five years have witnessed xx million in M&A activity, primarily focused on strengthening supply chains and expanding product portfolios. Significant deals included [mention specific deals if available, otherwise, state "no significant deals reported"].
Pyrogenic Silica Industry Trends & Insights
The pyrogenic silica market is experiencing robust growth, propelled by several key factors. The increasing demand from the expanding construction, automotive, and electronics sectors is a significant driver. Technological advancements in surface modification and dispersion techniques are enhancing the performance and versatility of pyrogenic silica, enabling penetration into new applications. Consumer preferences for high-quality, durable, and eco-friendly products are also contributing to market expansion. The competitive landscape is dynamic, with companies focusing on product differentiation, cost optimization, and strategic partnerships to maintain a strong market position. The market's growth trajectory is strongly influenced by regional economic development and technological adoption rates. Specific market segments are demonstrating higher growth rates, such as the demand for high-purity pyrogenic silica in specialized applications. The global market is estimated to reach $XX million in 2033.
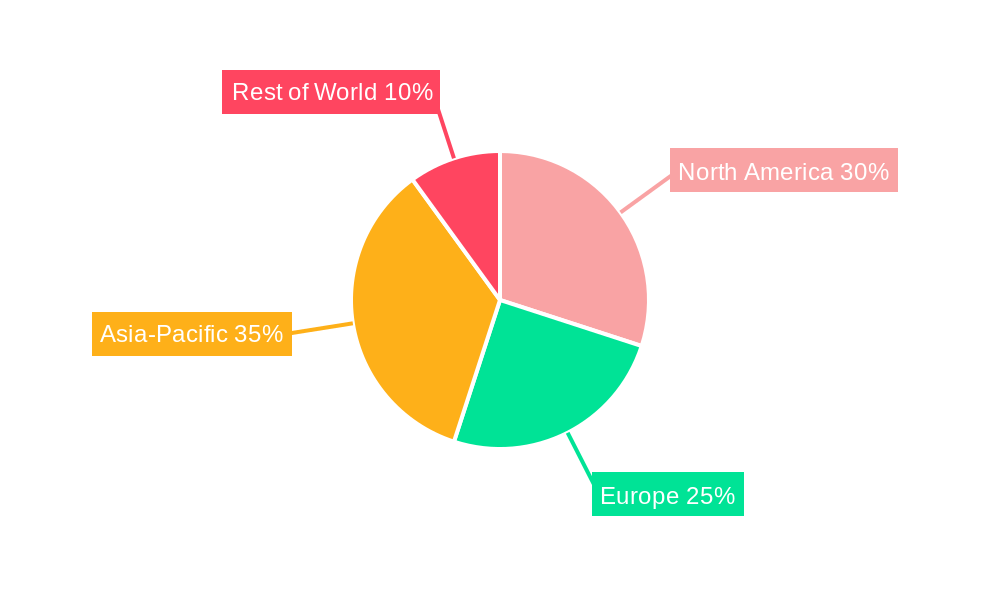
Dominant Markets & Segments in Pyrogenic Silica
The Asia-Pacific region dominates the global pyrogenic silica market, driven by rapid industrialization, economic growth, and expanding downstream industries. China is the leading national market within this region.
- Key Drivers in Asia-Pacific:
- Rapid industrialization and urbanization
- Expanding construction and automotive sectors
- Growing demand from the electronics and packaging industries
- Favorable government policies supporting industrial development.
- Dominance Analysis: The region's dominance is attributed to its large manufacturing base, significant demand from various end-use sectors, and the presence of major pyrogenic silica producers. The relatively lower production costs also contribute to the region's competitive advantage. Europe and North America hold significant market shares but experience slower growth compared to Asia-Pacific.
Pyrogenic Silica Product Developments
Recent advancements focus on creating tailored pyrogenic silica grades with specific surface functionalities and improved dispersibility. This includes surface modifications to enhance compatibility with specific polymers and resins, resulting in improved product performance and reduced processing costs. These developments cater to the growing demand for high-performance materials across various applications.
Report Scope & Segmentation Analysis
This report segments the pyrogenic silica market based on grade (hydrophilic, hydrophobic), application (coatings, adhesives, sealants, elastomers (CASE), personal care, food, others), and region (North America, Europe, Asia-Pacific, Rest of the World). Each segment's growth projection, market size, and competitive landscape are analyzed. Growth projections vary significantly depending on the segment, with CASE applications and the Asia-Pacific region showing the highest growth potential.
Key Drivers of Pyrogenic Silica Growth
Several factors are propelling the growth of the pyrogenic silica market. These include:
- Technological advancements: Continuous innovations in production processes, surface modification techniques, and dispersion methods lead to improved product properties and wider applications.
- Expanding downstream industries: The growing demand from the construction, automotive, and electronics industries fuels significant growth in pyrogenic silica consumption.
- Favorable government policies: Government initiatives promoting industrial development and infrastructure projects stimulate market growth in key regions.
Challenges in the Pyrogenic Silica Sector
The pyrogenic silica market faces several challenges:
- Fluctuating raw material prices: The price volatility of raw materials, such as silicon tetrachloride, directly impacts production costs and profitability.
- Stringent environmental regulations: Meeting stringent environmental regulations regarding silica dust emissions necessitates significant investments in pollution control technologies.
- Intense competition: The presence of numerous established and emerging players creates intense competition, pressuring margins and requiring continuous innovation.
Emerging Opportunities in Pyrogenic Silica
Emerging opportunities exist in:
- High-performance applications: The increasing demand for advanced materials in high-tech applications, such as aerospace and electronics, presents significant growth potential.
- Sustainable manufacturing practices: The focus on environmentally friendly production methods creates opportunities for companies implementing sustainable technologies.
- New geographic markets: Untapped markets in developing economies offer substantial growth potential.
Leading Players in the Pyrogenic Silica Market
Key Developments in Pyrogenic Silica Industry
- 2022 Q4: Evonik launched a new high-purity pyrogenic silica grade for advanced electronics applications.
- 2023 Q1: Cabot announced a strategic partnership to expand its production capacity in Asia.
- 2023 Q2: Wacker invested in upgrading its manufacturing facilities to enhance efficiency and reduce emissions. [Add further developments with dates if available]
Strategic Outlook for Pyrogenic Silica Market
The pyrogenic silica market is poised for continued growth, driven by increasing demand from key industries and ongoing technological advancements. The focus on sustainable manufacturing and the development of high-performance materials will further shape the market's future. Companies investing in research and development, capacity expansion, and strategic partnerships will be well-positioned to capitalize on the emerging opportunities.
Pyrogenic Silica Segmentation
-
1. Application
- 1.1. Silicone Rubber
- 1.2. Adhesives and Sealants
- 1.3. Polyester
- 1.4. Paints
- 1.5. Inks
- 1.6. Others
-
2. Type
- 2.1. Hydrophilic Fumed Silica
- 2.2. Hydrophobic Fumed Silica
Pyrogenic Silica Segmentation By Geography
-
1. North America
- 1.1. United States
- 1.2. Canada
- 1.3. Mexico
-
2. South America
- 2.1. Brazil
- 2.2. Argentina
- 2.3. Rest of South America
-
3. Europe
- 3.1. United Kingdom
- 3.2. Germany
- 3.3. France
- 3.4. Italy
- 3.5. Spain
- 3.6. Russia
- 3.7. Benelux
- 3.8. Nordics
- 3.9. Rest of Europe
-
4. Middle East & Africa
- 4.1. Turkey
- 4.2. Israel
- 4.3. GCC
- 4.4. North Africa
- 4.5. South Africa
- 4.6. Rest of Middle East & Africa
-
5. Asia Pacific
- 5.1. China
- 5.2. India
- 5.3. Japan
- 5.4. South Korea
- 5.5. ASEAN
- 5.6. Oceania
- 5.7. Rest of Asia Pacific
Pyrogenic Silica Regional Market Share
Geographic Coverage of Pyrogenic Silica
Pyrogenic Silica REPORT HIGHLIGHTS
| Aspects | Details |
|---|---|
| Study Period | 2020-2034 |
| Base Year | 2025 |
| Estimated Year | 2026 |
| Forecast Period | 2026-2034 |
| Historical Period | 2020-2025 |
| Growth Rate | CAGR of 3.6% from 2020-2034 |
| Segmentation |
|
Table of Contents
- 1. Introduction
- 1.1. Research Scope
- 1.2. Market Segmentation
- 1.3. Research Objective
- 1.4. Definitions and Assumptions
- 2. Executive Summary
- 2.1. Market Snapshot
- 3. Market Dynamics
- 3.1. Market Drivers
- 3.2. Market Restrains
- 3.3. Market Trends
- 3.4. Market Opportunities
- 4. Market Factor Analysis
- 4.1. Porters Five Forces
- 4.1.1. Bargaining Power of Suppliers
- 4.1.2. Bargaining Power of Buyers
- 4.1.3. Threat of New Entrants
- 4.1.4. Threat of Substitutes
- 4.1.5. Competitive Rivalry
- 4.2. PESTEL analysis
- 4.3. BCG Analysis
- 4.3.1. Stars (High Growth, High Market Share)
- 4.3.2. Cash Cows (Low Growth, High Market Share)
- 4.3.3. Question Mark (High Growth, Low Market Share)
- 4.3.4. Dogs (Low Growth, Low Market Share)
- 4.4. Ansoff Matrix Analysis
- 4.5. Supply Chain Analysis
- 4.6. Regulatory Landscape
- 4.7. Current Market Potential and Opportunity Assessment (TAM–SAM–SOM Framework)
- 4.8. RAX Analyst Note
- 4.1. Porters Five Forces
- 5. Market Analysis, Insights and Forecast 2021-2033
- 5.1. Market Analysis, Insights and Forecast - by Application
- 5.1.1. Silicone Rubber
- 5.1.2. Adhesives and Sealants
- 5.1.3. Polyester
- 5.1.4. Paints
- 5.1.5. Inks
- 5.1.6. Others
- 5.2. Market Analysis, Insights and Forecast - by Type
- 5.2.1. Hydrophilic Fumed Silica
- 5.2.2. Hydrophobic Fumed Silica
- 5.3. Market Analysis, Insights and Forecast - by Region
- 5.3.1. North America
- 5.3.2. South America
- 5.3.3. Europe
- 5.3.4. Middle East & Africa
- 5.3.5. Asia Pacific
- 5.1. Market Analysis, Insights and Forecast - by Application
- 6. Global Pyrogenic Silica Analysis, Insights and Forecast, 2021-2033
- 6.1. Market Analysis, Insights and Forecast - by Application
- 6.1.1. Silicone Rubber
- 6.1.2. Adhesives and Sealants
- 6.1.3. Polyester
- 6.1.4. Paints
- 6.1.5. Inks
- 6.1.6. Others
- 6.2. Market Analysis, Insights and Forecast - by Type
- 6.2.1. Hydrophilic Fumed Silica
- 6.2.2. Hydrophobic Fumed Silica
- 6.1. Market Analysis, Insights and Forecast - by Application
- 7. North America Pyrogenic Silica Analysis, Insights and Forecast, 2020-2032
- 7.1. Market Analysis, Insights and Forecast - by Application
- 7.1.1. Silicone Rubber
- 7.1.2. Adhesives and Sealants
- 7.1.3. Polyester
- 7.1.4. Paints
- 7.1.5. Inks
- 7.1.6. Others
- 7.2. Market Analysis, Insights and Forecast - by Type
- 7.2.1. Hydrophilic Fumed Silica
- 7.2.2. Hydrophobic Fumed Silica
- 7.1. Market Analysis, Insights and Forecast - by Application
- 8. South America Pyrogenic Silica Analysis, Insights and Forecast, 2020-2032
- 8.1. Market Analysis, Insights and Forecast - by Application
- 8.1.1. Silicone Rubber
- 8.1.2. Adhesives and Sealants
- 8.1.3. Polyester
- 8.1.4. Paints
- 8.1.5. Inks
- 8.1.6. Others
- 8.2. Market Analysis, Insights and Forecast - by Type
- 8.2.1. Hydrophilic Fumed Silica
- 8.2.2. Hydrophobic Fumed Silica
- 8.1. Market Analysis, Insights and Forecast - by Application
- 9. Europe Pyrogenic Silica Analysis, Insights and Forecast, 2020-2032
- 9.1. Market Analysis, Insights and Forecast - by Application
- 9.1.1. Silicone Rubber
- 9.1.2. Adhesives and Sealants
- 9.1.3. Polyester
- 9.1.4. Paints
- 9.1.5. Inks
- 9.1.6. Others
- 9.2. Market Analysis, Insights and Forecast - by Type
- 9.2.1. Hydrophilic Fumed Silica
- 9.2.2. Hydrophobic Fumed Silica
- 9.1. Market Analysis, Insights and Forecast - by Application
- 10. Middle East & Africa Pyrogenic Silica Analysis, Insights and Forecast, 2020-2032
- 10.1. Market Analysis, Insights and Forecast - by Application
- 10.1.1. Silicone Rubber
- 10.1.2. Adhesives and Sealants
- 10.1.3. Polyester
- 10.1.4. Paints
- 10.1.5. Inks
- 10.1.6. Others
- 10.2. Market Analysis, Insights and Forecast - by Type
- 10.2.1. Hydrophilic Fumed Silica
- 10.2.2. Hydrophobic Fumed Silica
- 10.1. Market Analysis, Insights and Forecast - by Application
- 11. Asia Pacific Pyrogenic Silica Analysis, Insights and Forecast, 2020-2032
- 11.1. Market Analysis, Insights and Forecast - by Application
- 11.1.1. Silicone Rubber
- 11.1.2. Adhesives and Sealants
- 11.1.3. Polyester
- 11.1.4. Paints
- 11.1.5. Inks
- 11.1.6. Others
- 11.2. Market Analysis, Insights and Forecast - by Type
- 11.2.1. Hydrophilic Fumed Silica
- 11.2.2. Hydrophobic Fumed Silica
- 11.1. Market Analysis, Insights and Forecast - by Application
- 12. Competitive Analysis
- 12.1. Company Profiles
- 12.1.1 Evonik
- 12.1.1.1. Company Overview
- 12.1.1.2. Products
- 12.1.1.3. Company Financials
- 12.1.1.4. SWOT Analysis
- 12.1.2 Cabot
- 12.1.2.1. Company Overview
- 12.1.2.2. Products
- 12.1.2.3. Company Financials
- 12.1.2.4. SWOT Analysis
- 12.1.3 Wacker
- 12.1.3.1. Company Overview
- 12.1.3.2. Products
- 12.1.3.3. Company Financials
- 12.1.3.4. SWOT Analysis
- 12.1.4 Tokuyama
- 12.1.4.1. Company Overview
- 12.1.4.2. Products
- 12.1.4.3. Company Financials
- 12.1.4.4. SWOT Analysis
- 12.1.5 Orisil
- 12.1.5.1. Company Overview
- 12.1.5.2. Products
- 12.1.5.3. Company Financials
- 12.1.5.4. SWOT Analysis
- 12.1.6 OCI Corporation
- 12.1.6.1. Company Overview
- 12.1.6.2. Products
- 12.1.6.3. Company Financials
- 12.1.6.4. SWOT Analysis
- 12.1.7 Heraeus
- 12.1.7.1. Company Overview
- 12.1.7.2. Products
- 12.1.7.3. Company Financials
- 12.1.7.4. SWOT Analysis
- 12.1.8 Vitro Minerals
- 12.1.8.1. Company Overview
- 12.1.8.2. Products
- 12.1.8.3. Company Financials
- 12.1.8.4. SWOT Analysis
- 12.1.9 Hoshine Silicon
- 12.1.9.1. Company Overview
- 12.1.9.2. Products
- 12.1.9.3. Company Financials
- 12.1.9.4. SWOT Analysis
- 12.1.10 Hubei Huifu Nanomaterial
- 12.1.10.1. Company Overview
- 12.1.10.2. Products
- 12.1.10.3. Company Financials
- 12.1.10.4. SWOT Analysis
- 12.1.11 GBS
- 12.1.11.1. Company Overview
- 12.1.11.2. Products
- 12.1.11.3. Company Financials
- 12.1.11.4. SWOT Analysis
- 12.1.12 Fushite
- 12.1.12.1. Company Overview
- 12.1.12.2. Products
- 12.1.12.3. Company Financials
- 12.1.12.4. SWOT Analysis
- 12.1.13 Blackcat
- 12.1.13.1. Company Overview
- 12.1.13.2. Products
- 12.1.13.3. Company Financials
- 12.1.13.4. SWOT Analysis
- 12.1.14 Sunfar
- 12.1.14.1. Company Overview
- 12.1.14.2. Products
- 12.1.14.3. Company Financials
- 12.1.14.4. SWOT Analysis
- 12.1.15 Jiangxi Hungpai New Materials
- 12.1.15.1. Company Overview
- 12.1.15.2. Products
- 12.1.15.3. Company Financials
- 12.1.15.4. SWOT Analysis
- 12.1.16 Shandong Dongyue Organic Silicon Material
- 12.1.16.1. Company Overview
- 12.1.16.2. Products
- 12.1.16.3. Company Financials
- 12.1.16.4. SWOT Analysis
- 12.1.17 Xinte
- 12.1.17.1. Company Overview
- 12.1.17.2. Products
- 12.1.17.3. Company Financials
- 12.1.17.4. SWOT Analysis
- 12.1.18 Emeishan Changqing New Material
- 12.1.18.1. Company Overview
- 12.1.18.2. Products
- 12.1.18.3. Company Financials
- 12.1.18.4. SWOT Analysis
- 12.1.19 Ningxia Futai Silicon Industry
- 12.1.19.1. Company Overview
- 12.1.19.2. Products
- 12.1.19.3. Company Financials
- 12.1.19.4. SWOT Analysis
- 12.1.20 Changtai
- 12.1.20.1. Company Overview
- 12.1.20.2. Products
- 12.1.20.3. Company Financials
- 12.1.20.4. SWOT Analysis
- 12.1.1 Evonik
- 12.2. Market Entropy
- 12.2.1 Company's Key Areas Served
- 12.2.2 Recent Developments
- 12.3. Company Market Share Analysis 2025
- 12.3.1 Top 5 Companies Market Share Analysis
- 12.3.2 Top 3 Companies Market Share Analysis
- 12.4. List of Potential Customers
- 13. Research Methodology
List of Figures
- Figure 1: Global Pyrogenic Silica Revenue Breakdown (million, %) by Region 2025 & 2033
- Figure 2: North America Pyrogenic Silica Revenue (million), by Application 2025 & 2033
- Figure 3: North America Pyrogenic Silica Revenue Share (%), by Application 2025 & 2033
- Figure 4: North America Pyrogenic Silica Revenue (million), by Type 2025 & 2033
- Figure 5: North America Pyrogenic Silica Revenue Share (%), by Type 2025 & 2033
- Figure 6: North America Pyrogenic Silica Revenue (million), by Country 2025 & 2033
- Figure 7: North America Pyrogenic Silica Revenue Share (%), by Country 2025 & 2033
- Figure 8: South America Pyrogenic Silica Revenue (million), by Application 2025 & 2033
- Figure 9: South America Pyrogenic Silica Revenue Share (%), by Application 2025 & 2033
- Figure 10: South America Pyrogenic Silica Revenue (million), by Type 2025 & 2033
- Figure 11: South America Pyrogenic Silica Revenue Share (%), by Type 2025 & 2033
- Figure 12: South America Pyrogenic Silica Revenue (million), by Country 2025 & 2033
- Figure 13: South America Pyrogenic Silica Revenue Share (%), by Country 2025 & 2033
- Figure 14: Europe Pyrogenic Silica Revenue (million), by Application 2025 & 2033
- Figure 15: Europe Pyrogenic Silica Revenue Share (%), by Application 2025 & 2033
- Figure 16: Europe Pyrogenic Silica Revenue (million), by Type 2025 & 2033
- Figure 17: Europe Pyrogenic Silica Revenue Share (%), by Type 2025 & 2033
- Figure 18: Europe Pyrogenic Silica Revenue (million), by Country 2025 & 2033
- Figure 19: Europe Pyrogenic Silica Revenue Share (%), by Country 2025 & 2033
- Figure 20: Middle East & Africa Pyrogenic Silica Revenue (million), by Application 2025 & 2033
- Figure 21: Middle East & Africa Pyrogenic Silica Revenue Share (%), by Application 2025 & 2033
- Figure 22: Middle East & Africa Pyrogenic Silica Revenue (million), by Type 2025 & 2033
- Figure 23: Middle East & Africa Pyrogenic Silica Revenue Share (%), by Type 2025 & 2033
- Figure 24: Middle East & Africa Pyrogenic Silica Revenue (million), by Country 2025 & 2033
- Figure 25: Middle East & Africa Pyrogenic Silica Revenue Share (%), by Country 2025 & 2033
- Figure 26: Asia Pacific Pyrogenic Silica Revenue (million), by Application 2025 & 2033
- Figure 27: Asia Pacific Pyrogenic Silica Revenue Share (%), by Application 2025 & 2033
- Figure 28: Asia Pacific Pyrogenic Silica Revenue (million), by Type 2025 & 2033
- Figure 29: Asia Pacific Pyrogenic Silica Revenue Share (%), by Type 2025 & 2033
- Figure 30: Asia Pacific Pyrogenic Silica Revenue (million), by Country 2025 & 2033
- Figure 31: Asia Pacific Pyrogenic Silica Revenue Share (%), by Country 2025 & 2033
List of Tables
- Table 1: Global Pyrogenic Silica Revenue million Forecast, by Application 2020 & 2033
- Table 2: Global Pyrogenic Silica Revenue million Forecast, by Type 2020 & 2033
- Table 3: Global Pyrogenic Silica Revenue million Forecast, by Region 2020 & 2033
- Table 4: Global Pyrogenic Silica Revenue million Forecast, by Application 2020 & 2033
- Table 5: Global Pyrogenic Silica Revenue million Forecast, by Type 2020 & 2033
- Table 6: Global Pyrogenic Silica Revenue million Forecast, by Country 2020 & 2033
- Table 7: United States Pyrogenic Silica Revenue (million) Forecast, by Application 2020 & 2033
- Table 8: Canada Pyrogenic Silica Revenue (million) Forecast, by Application 2020 & 2033
- Table 9: Mexico Pyrogenic Silica Revenue (million) Forecast, by Application 2020 & 2033
- Table 10: Global Pyrogenic Silica Revenue million Forecast, by Application 2020 & 2033
- Table 11: Global Pyrogenic Silica Revenue million Forecast, by Type 2020 & 2033
- Table 12: Global Pyrogenic Silica Revenue million Forecast, by Country 2020 & 2033
- Table 13: Brazil Pyrogenic Silica Revenue (million) Forecast, by Application 2020 & 2033
- Table 14: Argentina Pyrogenic Silica Revenue (million) Forecast, by Application 2020 & 2033
- Table 15: Rest of South America Pyrogenic Silica Revenue (million) Forecast, by Application 2020 & 2033
- Table 16: Global Pyrogenic Silica Revenue million Forecast, by Application 2020 & 2033
- Table 17: Global Pyrogenic Silica Revenue million Forecast, by Type 2020 & 2033
- Table 18: Global Pyrogenic Silica Revenue million Forecast, by Country 2020 & 2033
- Table 19: United Kingdom Pyrogenic Silica Revenue (million) Forecast, by Application 2020 & 2033
- Table 20: Germany Pyrogenic Silica Revenue (million) Forecast, by Application 2020 & 2033
- Table 21: France Pyrogenic Silica Revenue (million) Forecast, by Application 2020 & 2033
- Table 22: Italy Pyrogenic Silica Revenue (million) Forecast, by Application 2020 & 2033
- Table 23: Spain Pyrogenic Silica Revenue (million) Forecast, by Application 2020 & 2033
- Table 24: Russia Pyrogenic Silica Revenue (million) Forecast, by Application 2020 & 2033
- Table 25: Benelux Pyrogenic Silica Revenue (million) Forecast, by Application 2020 & 2033
- Table 26: Nordics Pyrogenic Silica Revenue (million) Forecast, by Application 2020 & 2033
- Table 27: Rest of Europe Pyrogenic Silica Revenue (million) Forecast, by Application 2020 & 2033
- Table 28: Global Pyrogenic Silica Revenue million Forecast, by Application 2020 & 2033
- Table 29: Global Pyrogenic Silica Revenue million Forecast, by Type 2020 & 2033
- Table 30: Global Pyrogenic Silica Revenue million Forecast, by Country 2020 & 2033
- Table 31: Turkey Pyrogenic Silica Revenue (million) Forecast, by Application 2020 & 2033
- Table 32: Israel Pyrogenic Silica Revenue (million) Forecast, by Application 2020 & 2033
- Table 33: GCC Pyrogenic Silica Revenue (million) Forecast, by Application 2020 & 2033
- Table 34: North Africa Pyrogenic Silica Revenue (million) Forecast, by Application 2020 & 2033
- Table 35: South Africa Pyrogenic Silica Revenue (million) Forecast, by Application 2020 & 2033
- Table 36: Rest of Middle East & Africa Pyrogenic Silica Revenue (million) Forecast, by Application 2020 & 2033
- Table 37: Global Pyrogenic Silica Revenue million Forecast, by Application 2020 & 2033
- Table 38: Global Pyrogenic Silica Revenue million Forecast, by Type 2020 & 2033
- Table 39: Global Pyrogenic Silica Revenue million Forecast, by Country 2020 & 2033
- Table 40: China Pyrogenic Silica Revenue (million) Forecast, by Application 2020 & 2033
- Table 41: India Pyrogenic Silica Revenue (million) Forecast, by Application 2020 & 2033
- Table 42: Japan Pyrogenic Silica Revenue (million) Forecast, by Application 2020 & 2033
- Table 43: South Korea Pyrogenic Silica Revenue (million) Forecast, by Application 2020 & 2033
- Table 44: ASEAN Pyrogenic Silica Revenue (million) Forecast, by Application 2020 & 2033
- Table 45: Oceania Pyrogenic Silica Revenue (million) Forecast, by Application 2020 & 2033
- Table 46: Rest of Asia Pacific Pyrogenic Silica Revenue (million) Forecast, by Application 2020 & 2033
Frequently Asked Questions
1. What is the projected Compound Annual Growth Rate (CAGR) of the Pyrogenic Silica?
The projected CAGR is approximately 3.6%.
2. Which companies are prominent players in the Pyrogenic Silica?
Key companies in the market include Evonik, Cabot, Wacker, Tokuyama, Orisil, OCI Corporation, Heraeus, Vitro Minerals, Hoshine Silicon, Hubei Huifu Nanomaterial, GBS, Fushite, Blackcat, Sunfar, Jiangxi Hungpai New Materials, Shandong Dongyue Organic Silicon Material, Xinte, Emeishan Changqing New Material, Ningxia Futai Silicon Industry, Changtai.
3. What are the main segments of the Pyrogenic Silica?
The market segments include Application, Type.
4. Can you provide details about the market size?
The market size is estimated to be USD 2396 million as of 2022.
5. What are some drivers contributing to market growth?
N/A
6. What are the notable trends driving market growth?
N/A
7. Are there any restraints impacting market growth?
N/A
8. Can you provide examples of recent developments in the market?
N/A
9. What pricing options are available for accessing the report?
Pricing options include single-user, multi-user, and enterprise licenses priced at USD 4900.00, USD 7350.00, and USD 9800.00 respectively.
10. Is the market size provided in terms of value or volume?
The market size is provided in terms of value, measured in million.
11. Are there any specific market keywords associated with the report?
Yes, the market keyword associated with the report is "Pyrogenic Silica," which aids in identifying and referencing the specific market segment covered.
12. How do I determine which pricing option suits my needs best?
The pricing options vary based on user requirements and access needs. Individual users may opt for single-user licenses, while businesses requiring broader access may choose multi-user or enterprise licenses for cost-effective access to the report.
13. Are there any additional resources or data provided in the Pyrogenic Silica report?
While the report offers comprehensive insights, it's advisable to review the specific contents or supplementary materials provided to ascertain if additional resources or data are available.
14. How can I stay updated on further developments or reports in the Pyrogenic Silica?
To stay informed about further developments, trends, and reports in the Pyrogenic Silica, consider subscribing to industry newsletters, following relevant companies and organizations, or regularly checking reputable industry news sources and publications.
Methodology
Step 1 - Identification of Relevant Samples Size from Population Database


Step 2 - Approaches for Defining Global Market Size (Value, Volume* & Price*)

Note*: In applicable scenarios
Step 3 - Data Sources
Primary Research
- Web Analytics
- Survey Reports
- Research Institute
- Latest Research Reports
- Opinion Leaders
Secondary Research
- Annual Reports
- White Paper
- Latest Press Release
- Industry Association
- Paid Database
- Investor Presentations

Step 4 - Data Triangulation
Involves using different sources of information in order to increase the validity of a study
These sources are likely to be stakeholders in a program - participants, other researchers, program staff, other community members, and so on.
Then we put all data in single framework & apply various statistical tools to find out the dynamic on the market.
During the analysis stage, feedback from the stakeholder groups would be compared to determine areas of agreement as well as areas of divergence