

Key Insights
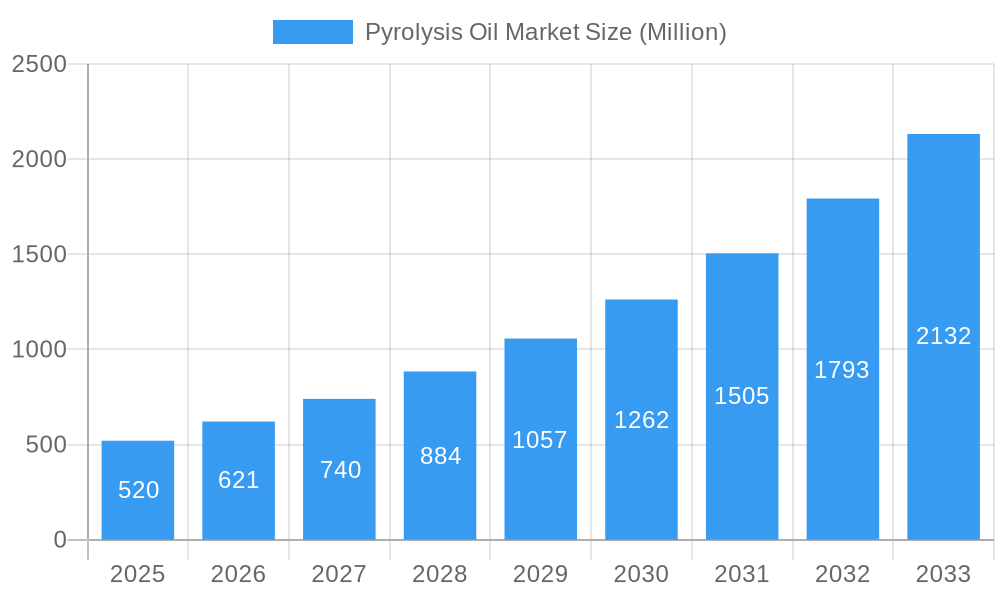
The pyrolysis oil market, valued at $0.52 billion in 2025, is experiencing robust growth, projected to expand at a compound annual growth rate (CAGR) of 19.71% from 2025 to 2033. This significant expansion is driven by several key factors. The increasing global focus on sustainable energy solutions and reducing reliance on fossil fuels is a primary driver. Government regulations promoting renewable energy and waste reduction initiatives are further accelerating market adoption. Furthermore, the rising demand for bio-based chemicals and fuels, coupled with advancements in pyrolysis technology leading to improved efficiency and cost-effectiveness, are contributing to market growth. The versatility of pyrolysis oil as a feedstock for various applications, including the production of fuels and chemicals from waste materials like plastics, rubber, wood, and oil sludge, broadens its market appeal. While challenges such as inconsistent raw material quality and the need for further technological advancements remain, the overall market outlook remains extremely positive.
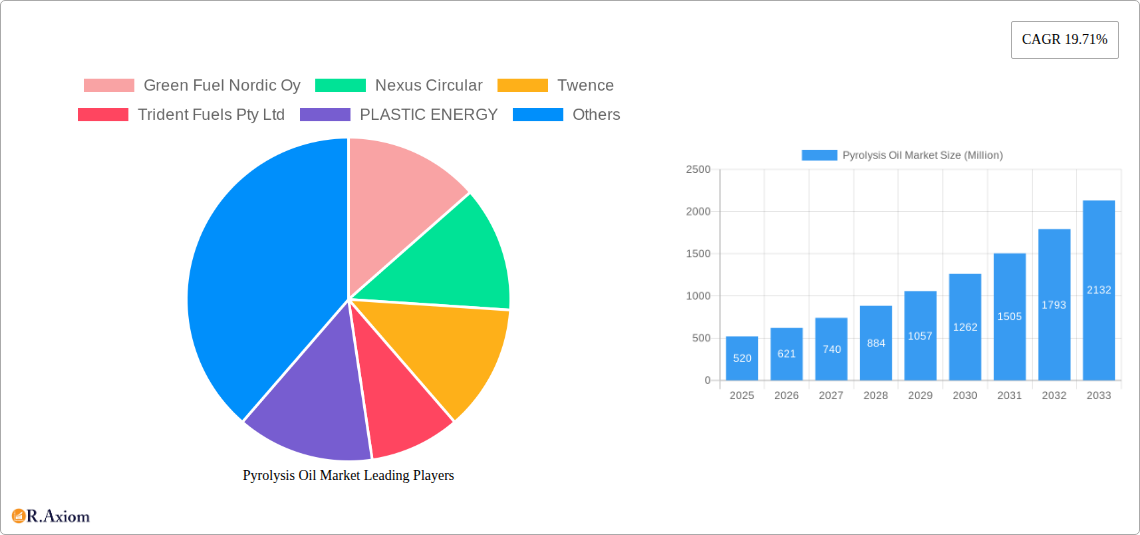
Pyrolysis Oil Market Market Size (In Million)
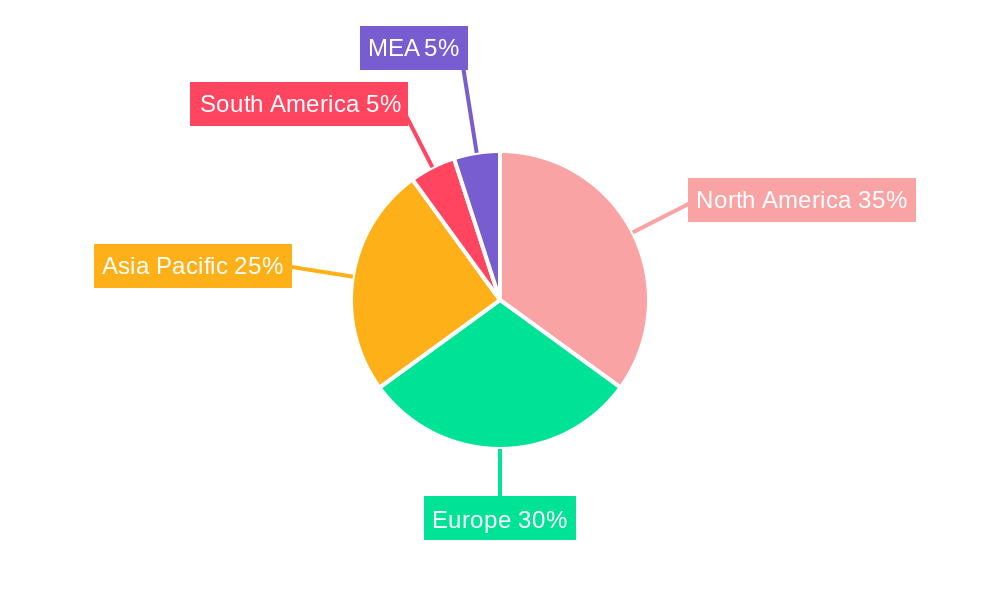
The market segmentation reveals strong growth potential across various applications. The fuels segment is expected to dominate, driven by the increasing demand for renewable transportation fuels. The chemicals segment is also experiencing substantial growth due to the increasing demand for bio-based chemicals in various industries. Geographically, North America and Europe are currently leading the market, primarily due to established infrastructure and supportive government policies. However, the Asia-Pacific region is projected to witness the fastest growth in the coming years, driven by rapid industrialization and increasing environmental concerns. Key players in the market are continuously investing in research and development to enhance the efficiency and scalability of pyrolysis technology, fostering further market expansion. The competitive landscape is characterized by a mix of established players and emerging companies, resulting in innovation and market diversification.
Pyrolysis Oil Market Company Market Share
This in-depth report provides a comprehensive analysis of the Pyrolysis Oil Market, covering the period from 2019 to 2033. It delves into market dynamics, segmentation, key players, and future growth potential, offering actionable insights for stakeholders across the value chain. The report utilizes a robust methodology, incorporating historical data (2019-2024), a base year of 2025, and a forecast period spanning 2025-2033. The market is segmented by raw material (Waste Plastic, Waste Rubber, Wood, Oil Sludge, Other Raw Materials) and application (Fuels, Chemicals). With a focus on key industry developments and the competitive landscape, this report serves as an essential resource for businesses seeking to understand and capitalize on opportunities within this rapidly evolving market. The total market size is projected to reach xx Million by 2033, representing a significant growth opportunity.
Pyrolysis Oil Market Concentration & Innovation
The Pyrolysis Oil Market exhibits a moderately concentrated structure, with a handful of major players holding significant market share. However, the market is witnessing increased innovation, driven by the need for sustainable waste management solutions and the rising demand for alternative fuels and chemicals. The market share distribution among leading companies like Green Fuel Nordic Oy, Nexus Circular, Twence, and Trident Fuels Pty Ltd is currently being analyzed.
- Market Concentration: The Herfindahl-Hirschman Index (HHI) is estimated at xx, indicating a moderately concentrated market. Further analysis is ongoing to determine precise market share for each player.
- Innovation Drivers: Stringent environmental regulations, coupled with growing concerns regarding plastic waste, are major catalysts for innovation. Advancements in pyrolysis technologies, focusing on efficiency and yield optimization, are transforming the industry.
- Regulatory Frameworks: Government policies promoting circular economy initiatives and incentives for renewable energy sources significantly influence market growth. Specific regulations vary by region, impacting market penetration in each area.
- Product Substitutes: Competition exists from other waste-to-energy technologies, such as gasification and incineration. However, pyrolysis offers unique advantages in terms of oil yield and versatility of end-products.
- End-User Trends: The increasing adoption of pyrolysis oil in various industries, including the chemical and fuel sectors, fuels market expansion. Demand is particularly strong in regions with stringent environmental regulations and limited fossil fuel resources.
- M&A Activities: The market has witnessed several mergers and acquisitions in recent years, with deal values ranging from xx Million to xx Million. These activities reflect the consolidation trends within the industry and a strategic pursuit of technological expertise and market expansion.
Pyrolysis Oil Market Industry Trends & Insights
The global pyrolysis oil market is experiencing robust growth, driven by several key factors. The market is projected to exhibit a Compound Annual Growth Rate (CAGR) of xx% during the forecast period (2025-2033). This growth is attributed to the escalating demand for sustainable solutions for waste management, coupled with the increasing adoption of pyrolysis technology across diverse industries. Technological advancements, including improvements in reactor design and process optimization, are enhancing the efficiency and cost-effectiveness of pyrolysis, making it a more attractive option for businesses. Changing consumer preferences towards environmentally friendly products and a growing focus on reducing carbon emissions are driving this adoption. However, the market's growth trajectory is also influenced by factors such as fluctuating raw material prices and the need for continuous technological advancements to ensure optimum cost-effectiveness. Market penetration is highest in regions with proactive waste management policies and high volumes of plastic waste. Competitive dynamics are intensifying, with established players and new entrants vying for market share through technological innovation, strategic partnerships, and expansion into new geographic areas.
Dominant Markets & Segments in Pyrolysis Oil Market
The pyrolysis oil market shows significant regional variations in growth, with [mention the leading region/country, e.g., Europe or North America] currently dominating. This dominance stems from several factors:
- Key Drivers for Leading Region:
- Stringent Environmental Regulations: Stricter emission standards and policies focused on waste reduction propel market expansion.
- Robust Infrastructure: Existing waste management infrastructure and supportive government initiatives facilitate the adoption of pyrolysis technology.
- High Plastic Waste Generation: Large volumes of plastic waste provide a substantial feedstock for pyrolysis processes.
- Favorable Economic Policies: Subsidies and incentives from governments stimulate investment in sustainable waste management solutions.
Dominant Segments:
- Raw Material: Waste plastic currently dominates the raw material segment due to its abundance and consistent availability globally. The growth in this segment will be influenced by the changing composition of plastic waste and availability of plastic recycling infrastructure.
- Application: The fuels application segment holds a dominant position currently, driven by the increasing demand for alternative energy sources and stricter emission norms. However, the chemical application segment is also anticipated to grow rapidly, spurred by the rising demand for bio-based chemicals. Detailed analysis indicates a xx Million market value for fuels in 2025 and a xx Million market value for chemicals.
Pyrolysis Oil Market Product Developments
Recent product innovations focus on enhancing process efficiency, improving oil yield, and broadening the range of acceptable feedstocks. Advancements in reactor design, catalyst development, and downstream processing are leading to more efficient and cost-effective pyrolysis systems. These developments are aligning with market needs for sustainable solutions and diversifying applications of the produced oil, further enhancing market penetration. Several companies are also concentrating on developing closed-loop recycling systems to optimize resource utilization.
Report Scope & Segmentation Analysis
This report comprehensively analyzes the pyrolysis oil market across different segments:
Raw Material:
- Waste Plastic: This segment accounts for the largest market share, driven by the rising global plastic waste generation. The market size for waste plastic is xx Million in 2025.
- Waste Rubber: This segment is projected to experience significant growth, driven by the increasing demand for sustainable tire recycling solutions. 2025 Market size is xx Million.
- Wood: This segment offers a sustainable alternative to fossil fuels, and market growth is projected to increase at xx% CAGR. 2025 Market Size is xx Million.
- Oil Sludge: This segment is anticipated to grow moderately, primarily driven by environmental regulations and stricter waste disposal norms. 2025 Market Size is xx Million.
- Other Raw Materials: This segment includes various other materials, and it is expected to grow at a CAGR of xx% during the forecast period. 2025 Market Size is xx Million.
Application:
- Fuels: This segment dominates the application market, primarily driven by the increasing demand for cleaner energy sources. The market size for fuels is projected to reach xx Million in 2025.
- Chemicals: This segment presents significant growth potential, driven by the increasing demand for bio-based chemicals and the growing focus on sustainability. The market size for chemicals is projected to reach xx Million in 2025.
Key Drivers of Pyrolysis Oil Market Growth
Several factors fuel the growth of the pyrolysis oil market:
- Stringent Environmental Regulations: Growing concerns over plastic waste and greenhouse gas emissions are driving the adoption of sustainable waste management technologies.
- Increasing Demand for Renewable Energy: Pyrolysis oil offers a renewable and sustainable alternative to fossil fuels, aligning with global efforts to reduce reliance on fossil fuels.
- Technological Advancements: Continuous advancements in pyrolysis technology are improving efficiency, reducing costs, and expanding the range of applicable feedstocks.
- Government Incentives and Support: Government policies promoting renewable energy and waste recycling are driving market growth.
Challenges in the Pyrolysis Oil Market Sector
Despite its significant potential, the pyrolysis oil market faces several challenges:
- High Capital Costs: The initial investment required for pyrolysis plants can be substantial, potentially limiting market entry for smaller players.
- Fluctuating Raw Material Prices: The cost of raw materials, such as plastic waste and rubber, can significantly impact the profitability of pyrolysis operations.
- Technological Limitations: While advancements are ongoing, some technological limitations still exist, particularly related to the processing of complex waste streams and optimizing oil yield.
- Competition from Other Waste Management Technologies: Pyrolysis faces competition from other waste management methods, such as incineration and gasification.
Emerging Opportunities in Pyrolysis Oil Market
The pyrolysis oil market presents several emerging opportunities:
- Expansion into New Markets: Growth opportunities exist in developing countries with substantial plastic waste generation and limited waste management infrastructure.
- Integration with Circular Economy Initiatives: Pyrolysis technology can be effectively integrated into circular economy models, creating opportunities for collaboration and innovation across industries.
- Development of Advanced Pyrolysis Technologies: Further research and development can lead to even more efficient and cost-effective pyrolysis processes, expanding market penetration.
- Production of High-Value Chemicals: Focusing on the production of specific high-value chemicals from pyrolysis oil can enhance profitability and market appeal.
Leading Players in the Pyrolysis Oil Market Market
- Green Fuel Nordic Oy
- Nexus Circular
- Twence
- Trident Fuels Pty Ltd
- PLASTIC ENERGY
- Ensyn
- Bioenergy Ae Cote-Nord
- Alterra Energy LLC
- New Energy Kft
- Mk Aromatics Limited
- New Hope Energy
- Quantafuel ASA
- Plastic Advanced Recycling Corp
- Setra Group
Key Developments in Pyrolysis Oil Market Industry
- June 2023: Audi Hungaria's partnership with New Energy Kft. for tire waste pyrolysis, showcasing the growing adoption of the technology in the automotive sector.
- February 2023: Alterra Energy LLC's licensing agreement for a large-scale plastic waste pyrolysis facility in the US Gulf Coast, signaling significant investment and expansion in the North American market.
- May 2022: The three-year agreement between ArcelorMittal Mining Canada and BioÉnergie AE Côte-Nord for pyrolytic oil supply highlights the increasing use of pyrolysis oil in industrial applications.
- May 2022: The joint venture between New Hope Energy and TotalEnergies for building an advanced recycling plant demonstrates the growing collaboration between established players and new entrants in the market.
Strategic Outlook for Pyrolysis Oil Market Market
The pyrolysis oil market is poised for substantial growth, driven by increasing environmental concerns, technological advancements, and supportive government policies. The market will be shaped by the ongoing development of efficient and cost-effective pyrolysis technologies, expansion into new geographical markets, and strategic partnerships between industry players. Focusing on innovative applications of pyrolysis oil, such as the production of high-value chemicals and the integration with circular economy initiatives, will be key for future success in this dynamic market. The market is expected to continue its upward trajectory, with substantial growth projected throughout the forecast period.
Pyrolysis Oil Market Segmentation
-
1. Raw Material
- 1.1. Waste Plastic
- 1.2. Waste Rubber
- 1.3. Wood
- 1.4. Oil Sludge
- 1.5. Other Raw Materials
-
2. Application
- 2.1. Fuels
- 2.2. Chemicals
Pyrolysis Oil Market Segmentation By Geography
-
1. Asia Pacific
- 1.1. China
- 1.2. India
- 1.3. Japan
- 1.4. Thailand
- 1.5. Vietnam
- 1.6. Malaysia
- 1.7. Indonesia
- 1.8. South Korea
- 1.9. Rest of Asia Pacific
-
2. North America
- 2.1. United States
- 2.2. Canada
- 2.3. Mexico
-
3. Europe
- 3.1. Germany
- 3.2. France
- 3.3. United Kingdom
- 3.4. Italy
- 3.5. NORDIC
- 3.6. Spain
- 3.7. Turkey
- 3.8. Russia
- 3.9. Rest of Europe
-
4. South America
- 4.1. Brazil
- 4.2. Argentina
- 4.3. Colombia
- 4.4. Rest of South America
-
5. Middle East and Africa
- 5.1. Saudi Arabia
- 5.2. South Africa
- 5.3. Morocco
- 5.4. Qatar
- 5.5. Egypt
- 5.6. United Arab Emirates
- 5.7. Nigeria
- 5.8. Rest of Middle East and Africa
Pyrolysis Oil Market Regional Market Share
Geographic Coverage of Pyrolysis Oil Market
Pyrolysis Oil Market REPORT HIGHLIGHTS
| Aspects | Details |
|---|---|
| Study Period | 2020-2034 |
| Base Year | 2025 |
| Estimated Year | 2026 |
| Forecast Period | 2026-2034 |
| Historical Period | 2020-2025 |
| Growth Rate | CAGR of 19.71% from 2020-2034 |
| Segmentation |
|
Table of Contents
- 1. Introduction
- 1.1. Research Scope
- 1.2. Market Segmentation
- 1.3. Research Objective
- 1.4. Definitions and Assumptions
- 2. Executive Summary
- 2.1. Market Snapshot
- 3. Market Dynamics
- 3.1. Market Drivers
- 3.2. Market Restrains
- 3.3. Market Trends
- 3.4. Market Opportunities
- 4. Market Factor Analysis
- 4.1. Porters Five Forces
- 4.1.1. Bargaining Power of Suppliers
- 4.1.2. Bargaining Power of Buyers
- 4.1.3. Threat of New Entrants
- 4.1.4. Threat of Substitutes
- 4.1.5. Competitive Rivalry
- 4.2. PESTEL analysis
- 4.3. BCG Analysis
- 4.3.1. Stars (High Growth, High Market Share)
- 4.3.2. Cash Cows (Low Growth, High Market Share)
- 4.3.3. Question Mark (High Growth, Low Market Share)
- 4.3.4. Dogs (Low Growth, Low Market Share)
- 4.4. Ansoff Matrix Analysis
- 4.5. Supply Chain Analysis
- 4.6. Regulatory Landscape
- 4.7. Current Market Potential and Opportunity Assessment (TAM–SAM–SOM Framework)
- 4.8. RAX Analyst Note
- 4.1. Porters Five Forces
- 5. Market Analysis, Insights and Forecast 2021-2033
- 5.1. Market Analysis, Insights and Forecast - by Raw Material
- 5.1.1. Waste Plastic
- 5.1.2. Waste Rubber
- 5.1.3. Wood
- 5.1.4. Oil Sludge
- 5.1.5. Other Raw Materials
- 5.2. Market Analysis, Insights and Forecast - by Application
- 5.2.1. Fuels
- 5.2.2. Chemicals
- 5.3. Market Analysis, Insights and Forecast - by Region
- 5.3.1. Asia Pacific
- 5.3.2. North America
- 5.3.3. Europe
- 5.3.4. South America
- 5.3.5. Middle East and Africa
- 5.1. Market Analysis, Insights and Forecast - by Raw Material
- 6. Global Pyrolysis Oil Market Analysis, Insights and Forecast, 2021-2033
- 6.1. Market Analysis, Insights and Forecast - by Raw Material
- 6.1.1. Waste Plastic
- 6.1.2. Waste Rubber
- 6.1.3. Wood
- 6.1.4. Oil Sludge
- 6.1.5. Other Raw Materials
- 6.2. Market Analysis, Insights and Forecast - by Application
- 6.2.1. Fuels
- 6.2.2. Chemicals
- 6.1. Market Analysis, Insights and Forecast - by Raw Material
- 7. Asia Pacific Pyrolysis Oil Market Analysis, Insights and Forecast, 2020-2032
- 7.1. Market Analysis, Insights and Forecast - by Raw Material
- 7.1.1. Waste Plastic
- 7.1.2. Waste Rubber
- 7.1.3. Wood
- 7.1.4. Oil Sludge
- 7.1.5. Other Raw Materials
- 7.2. Market Analysis, Insights and Forecast - by Application
- 7.2.1. Fuels
- 7.2.2. Chemicals
- 7.1. Market Analysis, Insights and Forecast - by Raw Material
- 8. North America Pyrolysis Oil Market Analysis, Insights and Forecast, 2020-2032
- 8.1. Market Analysis, Insights and Forecast - by Raw Material
- 8.1.1. Waste Plastic
- 8.1.2. Waste Rubber
- 8.1.3. Wood
- 8.1.4. Oil Sludge
- 8.1.5. Other Raw Materials
- 8.2. Market Analysis, Insights and Forecast - by Application
- 8.2.1. Fuels
- 8.2.2. Chemicals
- 8.1. Market Analysis, Insights and Forecast - by Raw Material
- 9. Europe Pyrolysis Oil Market Analysis, Insights and Forecast, 2020-2032
- 9.1. Market Analysis, Insights and Forecast - by Raw Material
- 9.1.1. Waste Plastic
- 9.1.2. Waste Rubber
- 9.1.3. Wood
- 9.1.4. Oil Sludge
- 9.1.5. Other Raw Materials
- 9.2. Market Analysis, Insights and Forecast - by Application
- 9.2.1. Fuels
- 9.2.2. Chemicals
- 9.1. Market Analysis, Insights and Forecast - by Raw Material
- 10. South America Pyrolysis Oil Market Analysis, Insights and Forecast, 2020-2032
- 10.1. Market Analysis, Insights and Forecast - by Raw Material
- 10.1.1. Waste Plastic
- 10.1.2. Waste Rubber
- 10.1.3. Wood
- 10.1.4. Oil Sludge
- 10.1.5. Other Raw Materials
- 10.2. Market Analysis, Insights and Forecast - by Application
- 10.2.1. Fuels
- 10.2.2. Chemicals
- 10.1. Market Analysis, Insights and Forecast - by Raw Material
- 11. Middle East and Africa Pyrolysis Oil Market Analysis, Insights and Forecast, 2020-2032
- 11.1. Market Analysis, Insights and Forecast - by Raw Material
- 11.1.1. Waste Plastic
- 11.1.2. Waste Rubber
- 11.1.3. Wood
- 11.1.4. Oil Sludge
- 11.1.5. Other Raw Materials
- 11.2. Market Analysis, Insights and Forecast - by Application
- 11.2.1. Fuels
- 11.2.2. Chemicals
- 11.1. Market Analysis, Insights and Forecast - by Raw Material
- 12. Competitive Analysis
- 12.1. Company Profiles
- 12.1.1 Green Fuel Nordic Oy
- 12.1.1.1. Company Overview
- 12.1.1.2. Products
- 12.1.1.3. Company Financials
- 12.1.1.4. SWOT Analysis
- 12.1.2 Nexus Circular
- 12.1.2.1. Company Overview
- 12.1.2.2. Products
- 12.1.2.3. Company Financials
- 12.1.2.4. SWOT Analysis
- 12.1.3 Twence
- 12.1.3.1. Company Overview
- 12.1.3.2. Products
- 12.1.3.3. Company Financials
- 12.1.3.4. SWOT Analysis
- 12.1.4 Trident Fuels Pty Ltd
- 12.1.4.1. Company Overview
- 12.1.4.2. Products
- 12.1.4.3. Company Financials
- 12.1.4.4. SWOT Analysis
- 12.1.5 PLASTIC ENERGY
- 12.1.5.1. Company Overview
- 12.1.5.2. Products
- 12.1.5.3. Company Financials
- 12.1.5.4. SWOT Analysis
- 12.1.6 Ensyn
- 12.1.6.1. Company Overview
- 12.1.6.2. Products
- 12.1.6.3. Company Financials
- 12.1.6.4. SWOT Analysis
- 12.1.7 Bioenergy Ae Cote-Nord
- 12.1.7.1. Company Overview
- 12.1.7.2. Products
- 12.1.7.3. Company Financials
- 12.1.7.4. SWOT Analysis
- 12.1.8 Alterra Energy LLC
- 12.1.8.1. Company Overview
- 12.1.8.2. Products
- 12.1.8.3. Company Financials
- 12.1.8.4. SWOT Analysis
- 12.1.9 New Energy Kft
- 12.1.9.1. Company Overview
- 12.1.9.2. Products
- 12.1.9.3. Company Financials
- 12.1.9.4. SWOT Analysis
- 12.1.10 Mk Aromatics Limited
- 12.1.10.1. Company Overview
- 12.1.10.2. Products
- 12.1.10.3. Company Financials
- 12.1.10.4. SWOT Analysis
- 12.1.11 New Hope Energy
- 12.1.11.1. Company Overview
- 12.1.11.2. Products
- 12.1.11.3. Company Financials
- 12.1.11.4. SWOT Analysis
- 12.1.12 Quantafuel ASA
- 12.1.12.1. Company Overview
- 12.1.12.2. Products
- 12.1.12.3. Company Financials
- 12.1.12.4. SWOT Analysis
- 12.1.13 Plastic Advanced Recycling Corp
- 12.1.13.1. Company Overview
- 12.1.13.2. Products
- 12.1.13.3. Company Financials
- 12.1.13.4. SWOT Analysis
- 12.1.14 Setra Group
- 12.1.14.1. Company Overview
- 12.1.14.2. Products
- 12.1.14.3. Company Financials
- 12.1.14.4. SWOT Analysis
- 12.1.1 Green Fuel Nordic Oy
- 12.2. Market Entropy
- 12.2.1 Company's Key Areas Served
- 12.2.2 Recent Developments
- 12.3. Company Market Share Analysis 2025
- 12.3.1 Top 5 Companies Market Share Analysis
- 12.3.2 Top 3 Companies Market Share Analysis
- 12.4. List of Potential Customers
- 13. Research Methodology
List of Figures
- Figure 1: Global Pyrolysis Oil Market Revenue Breakdown (Million, %) by Region 2025 & 2033
- Figure 2: Global Pyrolysis Oil Market Volume Breakdown (K Tons, %) by Region 2025 & 2033
- Figure 3: Asia Pacific Pyrolysis Oil Market Revenue (Million), by Raw Material 2025 & 2033
- Figure 4: Asia Pacific Pyrolysis Oil Market Volume (K Tons), by Raw Material 2025 & 2033
- Figure 5: Asia Pacific Pyrolysis Oil Market Revenue Share (%), by Raw Material 2025 & 2033
- Figure 6: Asia Pacific Pyrolysis Oil Market Volume Share (%), by Raw Material 2025 & 2033
- Figure 7: Asia Pacific Pyrolysis Oil Market Revenue (Million), by Application 2025 & 2033
- Figure 8: Asia Pacific Pyrolysis Oil Market Volume (K Tons), by Application 2025 & 2033
- Figure 9: Asia Pacific Pyrolysis Oil Market Revenue Share (%), by Application 2025 & 2033
- Figure 10: Asia Pacific Pyrolysis Oil Market Volume Share (%), by Application 2025 & 2033
- Figure 11: Asia Pacific Pyrolysis Oil Market Revenue (Million), by Country 2025 & 2033
- Figure 12: Asia Pacific Pyrolysis Oil Market Volume (K Tons), by Country 2025 & 2033
- Figure 13: Asia Pacific Pyrolysis Oil Market Revenue Share (%), by Country 2025 & 2033
- Figure 14: Asia Pacific Pyrolysis Oil Market Volume Share (%), by Country 2025 & 2033
- Figure 15: North America Pyrolysis Oil Market Revenue (Million), by Raw Material 2025 & 2033
- Figure 16: North America Pyrolysis Oil Market Volume (K Tons), by Raw Material 2025 & 2033
- Figure 17: North America Pyrolysis Oil Market Revenue Share (%), by Raw Material 2025 & 2033
- Figure 18: North America Pyrolysis Oil Market Volume Share (%), by Raw Material 2025 & 2033
- Figure 19: North America Pyrolysis Oil Market Revenue (Million), by Application 2025 & 2033
- Figure 20: North America Pyrolysis Oil Market Volume (K Tons), by Application 2025 & 2033
- Figure 21: North America Pyrolysis Oil Market Revenue Share (%), by Application 2025 & 2033
- Figure 22: North America Pyrolysis Oil Market Volume Share (%), by Application 2025 & 2033
- Figure 23: North America Pyrolysis Oil Market Revenue (Million), by Country 2025 & 2033
- Figure 24: North America Pyrolysis Oil Market Volume (K Tons), by Country 2025 & 2033
- Figure 25: North America Pyrolysis Oil Market Revenue Share (%), by Country 2025 & 2033
- Figure 26: North America Pyrolysis Oil Market Volume Share (%), by Country 2025 & 2033
- Figure 27: Europe Pyrolysis Oil Market Revenue (Million), by Raw Material 2025 & 2033
- Figure 28: Europe Pyrolysis Oil Market Volume (K Tons), by Raw Material 2025 & 2033
- Figure 29: Europe Pyrolysis Oil Market Revenue Share (%), by Raw Material 2025 & 2033
- Figure 30: Europe Pyrolysis Oil Market Volume Share (%), by Raw Material 2025 & 2033
- Figure 31: Europe Pyrolysis Oil Market Revenue (Million), by Application 2025 & 2033
- Figure 32: Europe Pyrolysis Oil Market Volume (K Tons), by Application 2025 & 2033
- Figure 33: Europe Pyrolysis Oil Market Revenue Share (%), by Application 2025 & 2033
- Figure 34: Europe Pyrolysis Oil Market Volume Share (%), by Application 2025 & 2033
- Figure 35: Europe Pyrolysis Oil Market Revenue (Million), by Country 2025 & 2033
- Figure 36: Europe Pyrolysis Oil Market Volume (K Tons), by Country 2025 & 2033
- Figure 37: Europe Pyrolysis Oil Market Revenue Share (%), by Country 2025 & 2033
- Figure 38: Europe Pyrolysis Oil Market Volume Share (%), by Country 2025 & 2033
- Figure 39: South America Pyrolysis Oil Market Revenue (Million), by Raw Material 2025 & 2033
- Figure 40: South America Pyrolysis Oil Market Volume (K Tons), by Raw Material 2025 & 2033
- Figure 41: South America Pyrolysis Oil Market Revenue Share (%), by Raw Material 2025 & 2033
- Figure 42: South America Pyrolysis Oil Market Volume Share (%), by Raw Material 2025 & 2033
- Figure 43: South America Pyrolysis Oil Market Revenue (Million), by Application 2025 & 2033
- Figure 44: South America Pyrolysis Oil Market Volume (K Tons), by Application 2025 & 2033
- Figure 45: South America Pyrolysis Oil Market Revenue Share (%), by Application 2025 & 2033
- Figure 46: South America Pyrolysis Oil Market Volume Share (%), by Application 2025 & 2033
- Figure 47: South America Pyrolysis Oil Market Revenue (Million), by Country 2025 & 2033
- Figure 48: South America Pyrolysis Oil Market Volume (K Tons), by Country 2025 & 2033
- Figure 49: South America Pyrolysis Oil Market Revenue Share (%), by Country 2025 & 2033
- Figure 50: South America Pyrolysis Oil Market Volume Share (%), by Country 2025 & 2033
- Figure 51: Middle East and Africa Pyrolysis Oil Market Revenue (Million), by Raw Material 2025 & 2033
- Figure 52: Middle East and Africa Pyrolysis Oil Market Volume (K Tons), by Raw Material 2025 & 2033
- Figure 53: Middle East and Africa Pyrolysis Oil Market Revenue Share (%), by Raw Material 2025 & 2033
- Figure 54: Middle East and Africa Pyrolysis Oil Market Volume Share (%), by Raw Material 2025 & 2033
- Figure 55: Middle East and Africa Pyrolysis Oil Market Revenue (Million), by Application 2025 & 2033
- Figure 56: Middle East and Africa Pyrolysis Oil Market Volume (K Tons), by Application 2025 & 2033
- Figure 57: Middle East and Africa Pyrolysis Oil Market Revenue Share (%), by Application 2025 & 2033
- Figure 58: Middle East and Africa Pyrolysis Oil Market Volume Share (%), by Application 2025 & 2033
- Figure 59: Middle East and Africa Pyrolysis Oil Market Revenue (Million), by Country 2025 & 2033
- Figure 60: Middle East and Africa Pyrolysis Oil Market Volume (K Tons), by Country 2025 & 2033
- Figure 61: Middle East and Africa Pyrolysis Oil Market Revenue Share (%), by Country 2025 & 2033
- Figure 62: Middle East and Africa Pyrolysis Oil Market Volume Share (%), by Country 2025 & 2033
List of Tables
- Table 1: Global Pyrolysis Oil Market Revenue Million Forecast, by Raw Material 2020 & 2033
- Table 2: Global Pyrolysis Oil Market Volume K Tons Forecast, by Raw Material 2020 & 2033
- Table 3: Global Pyrolysis Oil Market Revenue Million Forecast, by Application 2020 & 2033
- Table 4: Global Pyrolysis Oil Market Volume K Tons Forecast, by Application 2020 & 2033
- Table 5: Global Pyrolysis Oil Market Revenue Million Forecast, by Region 2020 & 2033
- Table 6: Global Pyrolysis Oil Market Volume K Tons Forecast, by Region 2020 & 2033
- Table 7: Global Pyrolysis Oil Market Revenue Million Forecast, by Raw Material 2020 & 2033
- Table 8: Global Pyrolysis Oil Market Volume K Tons Forecast, by Raw Material 2020 & 2033
- Table 9: Global Pyrolysis Oil Market Revenue Million Forecast, by Application 2020 & 2033
- Table 10: Global Pyrolysis Oil Market Volume K Tons Forecast, by Application 2020 & 2033
- Table 11: Global Pyrolysis Oil Market Revenue Million Forecast, by Country 2020 & 2033
- Table 12: Global Pyrolysis Oil Market Volume K Tons Forecast, by Country 2020 & 2033
- Table 13: China Pyrolysis Oil Market Revenue (Million) Forecast, by Application 2020 & 2033
- Table 14: China Pyrolysis Oil Market Volume (K Tons) Forecast, by Application 2020 & 2033
- Table 15: India Pyrolysis Oil Market Revenue (Million) Forecast, by Application 2020 & 2033
- Table 16: India Pyrolysis Oil Market Volume (K Tons) Forecast, by Application 2020 & 2033
- Table 17: Japan Pyrolysis Oil Market Revenue (Million) Forecast, by Application 2020 & 2033
- Table 18: Japan Pyrolysis Oil Market Volume (K Tons) Forecast, by Application 2020 & 2033
- Table 19: Thailand Pyrolysis Oil Market Revenue (Million) Forecast, by Application 2020 & 2033
- Table 20: Thailand Pyrolysis Oil Market Volume (K Tons) Forecast, by Application 2020 & 2033
- Table 21: Vietnam Pyrolysis Oil Market Revenue (Million) Forecast, by Application 2020 & 2033
- Table 22: Vietnam Pyrolysis Oil Market Volume (K Tons) Forecast, by Application 2020 & 2033
- Table 23: Malaysia Pyrolysis Oil Market Revenue (Million) Forecast, by Application 2020 & 2033
- Table 24: Malaysia Pyrolysis Oil Market Volume (K Tons) Forecast, by Application 2020 & 2033
- Table 25: Indonesia Pyrolysis Oil Market Revenue (Million) Forecast, by Application 2020 & 2033
- Table 26: Indonesia Pyrolysis Oil Market Volume (K Tons) Forecast, by Application 2020 & 2033
- Table 27: South Korea Pyrolysis Oil Market Revenue (Million) Forecast, by Application 2020 & 2033
- Table 28: South Korea Pyrolysis Oil Market Volume (K Tons) Forecast, by Application 2020 & 2033
- Table 29: Rest of Asia Pacific Pyrolysis Oil Market Revenue (Million) Forecast, by Application 2020 & 2033
- Table 30: Rest of Asia Pacific Pyrolysis Oil Market Volume (K Tons) Forecast, by Application 2020 & 2033
- Table 31: Global Pyrolysis Oil Market Revenue Million Forecast, by Raw Material 2020 & 2033
- Table 32: Global Pyrolysis Oil Market Volume K Tons Forecast, by Raw Material 2020 & 2033
- Table 33: Global Pyrolysis Oil Market Revenue Million Forecast, by Application 2020 & 2033
- Table 34: Global Pyrolysis Oil Market Volume K Tons Forecast, by Application 2020 & 2033
- Table 35: Global Pyrolysis Oil Market Revenue Million Forecast, by Country 2020 & 2033
- Table 36: Global Pyrolysis Oil Market Volume K Tons Forecast, by Country 2020 & 2033
- Table 37: United States Pyrolysis Oil Market Revenue (Million) Forecast, by Application 2020 & 2033
- Table 38: United States Pyrolysis Oil Market Volume (K Tons) Forecast, by Application 2020 & 2033
- Table 39: Canada Pyrolysis Oil Market Revenue (Million) Forecast, by Application 2020 & 2033
- Table 40: Canada Pyrolysis Oil Market Volume (K Tons) Forecast, by Application 2020 & 2033
- Table 41: Mexico Pyrolysis Oil Market Revenue (Million) Forecast, by Application 2020 & 2033
- Table 42: Mexico Pyrolysis Oil Market Volume (K Tons) Forecast, by Application 2020 & 2033
- Table 43: Global Pyrolysis Oil Market Revenue Million Forecast, by Raw Material 2020 & 2033
- Table 44: Global Pyrolysis Oil Market Volume K Tons Forecast, by Raw Material 2020 & 2033
- Table 45: Global Pyrolysis Oil Market Revenue Million Forecast, by Application 2020 & 2033
- Table 46: Global Pyrolysis Oil Market Volume K Tons Forecast, by Application 2020 & 2033
- Table 47: Global Pyrolysis Oil Market Revenue Million Forecast, by Country 2020 & 2033
- Table 48: Global Pyrolysis Oil Market Volume K Tons Forecast, by Country 2020 & 2033
- Table 49: Germany Pyrolysis Oil Market Revenue (Million) Forecast, by Application 2020 & 2033
- Table 50: Germany Pyrolysis Oil Market Volume (K Tons) Forecast, by Application 2020 & 2033
- Table 51: France Pyrolysis Oil Market Revenue (Million) Forecast, by Application 2020 & 2033
- Table 52: France Pyrolysis Oil Market Volume (K Tons) Forecast, by Application 2020 & 2033
- Table 53: United Kingdom Pyrolysis Oil Market Revenue (Million) Forecast, by Application 2020 & 2033
- Table 54: United Kingdom Pyrolysis Oil Market Volume (K Tons) Forecast, by Application 2020 & 2033
- Table 55: Italy Pyrolysis Oil Market Revenue (Million) Forecast, by Application 2020 & 2033
- Table 56: Italy Pyrolysis Oil Market Volume (K Tons) Forecast, by Application 2020 & 2033
- Table 57: NORDIC Pyrolysis Oil Market Revenue (Million) Forecast, by Application 2020 & 2033
- Table 58: NORDIC Pyrolysis Oil Market Volume (K Tons) Forecast, by Application 2020 & 2033
- Table 59: Spain Pyrolysis Oil Market Revenue (Million) Forecast, by Application 2020 & 2033
- Table 60: Spain Pyrolysis Oil Market Volume (K Tons) Forecast, by Application 2020 & 2033
- Table 61: Turkey Pyrolysis Oil Market Revenue (Million) Forecast, by Application 2020 & 2033
- Table 62: Turkey Pyrolysis Oil Market Volume (K Tons) Forecast, by Application 2020 & 2033
- Table 63: Russia Pyrolysis Oil Market Revenue (Million) Forecast, by Application 2020 & 2033
- Table 64: Russia Pyrolysis Oil Market Volume (K Tons) Forecast, by Application 2020 & 2033
- Table 65: Rest of Europe Pyrolysis Oil Market Revenue (Million) Forecast, by Application 2020 & 2033
- Table 66: Rest of Europe Pyrolysis Oil Market Volume (K Tons) Forecast, by Application 2020 & 2033
- Table 67: Global Pyrolysis Oil Market Revenue Million Forecast, by Raw Material 2020 & 2033
- Table 68: Global Pyrolysis Oil Market Volume K Tons Forecast, by Raw Material 2020 & 2033
- Table 69: Global Pyrolysis Oil Market Revenue Million Forecast, by Application 2020 & 2033
- Table 70: Global Pyrolysis Oil Market Volume K Tons Forecast, by Application 2020 & 2033
- Table 71: Global Pyrolysis Oil Market Revenue Million Forecast, by Country 2020 & 2033
- Table 72: Global Pyrolysis Oil Market Volume K Tons Forecast, by Country 2020 & 2033
- Table 73: Brazil Pyrolysis Oil Market Revenue (Million) Forecast, by Application 2020 & 2033
- Table 74: Brazil Pyrolysis Oil Market Volume (K Tons) Forecast, by Application 2020 & 2033
- Table 75: Argentina Pyrolysis Oil Market Revenue (Million) Forecast, by Application 2020 & 2033
- Table 76: Argentina Pyrolysis Oil Market Volume (K Tons) Forecast, by Application 2020 & 2033
- Table 77: Colombia Pyrolysis Oil Market Revenue (Million) Forecast, by Application 2020 & 2033
- Table 78: Colombia Pyrolysis Oil Market Volume (K Tons) Forecast, by Application 2020 & 2033
- Table 79: Rest of South America Pyrolysis Oil Market Revenue (Million) Forecast, by Application 2020 & 2033
- Table 80: Rest of South America Pyrolysis Oil Market Volume (K Tons) Forecast, by Application 2020 & 2033
- Table 81: Global Pyrolysis Oil Market Revenue Million Forecast, by Raw Material 2020 & 2033
- Table 82: Global Pyrolysis Oil Market Volume K Tons Forecast, by Raw Material 2020 & 2033
- Table 83: Global Pyrolysis Oil Market Revenue Million Forecast, by Application 2020 & 2033
- Table 84: Global Pyrolysis Oil Market Volume K Tons Forecast, by Application 2020 & 2033
- Table 85: Global Pyrolysis Oil Market Revenue Million Forecast, by Country 2020 & 2033
- Table 86: Global Pyrolysis Oil Market Volume K Tons Forecast, by Country 2020 & 2033
- Table 87: Saudi Arabia Pyrolysis Oil Market Revenue (Million) Forecast, by Application 2020 & 2033
- Table 88: Saudi Arabia Pyrolysis Oil Market Volume (K Tons) Forecast, by Application 2020 & 2033
- Table 89: South Africa Pyrolysis Oil Market Revenue (Million) Forecast, by Application 2020 & 2033
- Table 90: South Africa Pyrolysis Oil Market Volume (K Tons) Forecast, by Application 2020 & 2033
- Table 91: Morocco Pyrolysis Oil Market Revenue (Million) Forecast, by Application 2020 & 2033
- Table 92: Morocco Pyrolysis Oil Market Volume (K Tons) Forecast, by Application 2020 & 2033
- Table 93: Qatar Pyrolysis Oil Market Revenue (Million) Forecast, by Application 2020 & 2033
- Table 94: Qatar Pyrolysis Oil Market Volume (K Tons) Forecast, by Application 2020 & 2033
- Table 95: Egypt Pyrolysis Oil Market Revenue (Million) Forecast, by Application 2020 & 2033
- Table 96: Egypt Pyrolysis Oil Market Volume (K Tons) Forecast, by Application 2020 & 2033
- Table 97: United Arab Emirates Pyrolysis Oil Market Revenue (Million) Forecast, by Application 2020 & 2033
- Table 98: United Arab Emirates Pyrolysis Oil Market Volume (K Tons) Forecast, by Application 2020 & 2033
- Table 99: Nigeria Pyrolysis Oil Market Revenue (Million) Forecast, by Application 2020 & 2033
- Table 100: Nigeria Pyrolysis Oil Market Volume (K Tons) Forecast, by Application 2020 & 2033
- Table 101: Rest of Middle East and Africa Pyrolysis Oil Market Revenue (Million) Forecast, by Application 2020 & 2033
- Table 102: Rest of Middle East and Africa Pyrolysis Oil Market Volume (K Tons) Forecast, by Application 2020 & 2033
Frequently Asked Questions
1. What is the projected Compound Annual Growth Rate (CAGR) of the Pyrolysis Oil Market?
The projected CAGR is approximately 19.71%.
2. Which companies are prominent players in the Pyrolysis Oil Market?
Key companies in the market include Green Fuel Nordic Oy, Nexus Circular, Twence, Trident Fuels Pty Ltd, PLASTIC ENERGY, Ensyn, Bioenergy Ae Cote-Nord, Alterra Energy LLC, New Energy Kft, Mk Aromatics Limited, New Hope Energy, Quantafuel ASA, Plastic Advanced Recycling Corp, Setra Group.
3. What are the main segments of the Pyrolysis Oil Market?
The market segments include Raw Material, Application.
4. Can you provide details about the market size?
The market size is estimated to be USD 0.52 Million as of 2022.
5. What are some drivers contributing to market growth?
Rising Demand For Environment-friendly Fuel and Raw Material Alternatives; Increasing Demand From Heat and Power Generation Sectors.
6. What are the notable trends driving market growth?
Increasing Demand for Fuel Application.
7. Are there any restraints impacting market growth?
Problems Associated With Storage. Transportation. and Application of Pyrolysis Oil.
8. Can you provide examples of recent developments in the market?
June 2023: Audi Hungaria announced its cooperation with New Energy Kft. to deal with tire waste generated at Audi’s Gyor plant. The process for recycling tire waste was pyrolysis, in which tire waste is chemically converted into oil that petrochemical companies can use to produce new plastics, while the resulting recovered carbon black is utilized in tire production.
9. What pricing options are available for accessing the report?
Pricing options include single-user, multi-user, and enterprise licenses priced at USD 4750, USD 5250, and USD 8750 respectively.
10. Is the market size provided in terms of value or volume?
The market size is provided in terms of value, measured in Million and volume, measured in K Tons.
11. Are there any specific market keywords associated with the report?
Yes, the market keyword associated with the report is "Pyrolysis Oil Market," which aids in identifying and referencing the specific market segment covered.
12. How do I determine which pricing option suits my needs best?
The pricing options vary based on user requirements and access needs. Individual users may opt for single-user licenses, while businesses requiring broader access may choose multi-user or enterprise licenses for cost-effective access to the report.
13. Are there any additional resources or data provided in the Pyrolysis Oil Market report?
While the report offers comprehensive insights, it's advisable to review the specific contents or supplementary materials provided to ascertain if additional resources or data are available.
14. How can I stay updated on further developments or reports in the Pyrolysis Oil Market?
To stay informed about further developments, trends, and reports in the Pyrolysis Oil Market, consider subscribing to industry newsletters, following relevant companies and organizations, or regularly checking reputable industry news sources and publications.
Methodology
Step 1 - Identification of Relevant Samples Size from Population Database


Step 2 - Approaches for Defining Global Market Size (Value, Volume* & Price*)

Note*: In applicable scenarios
Step 3 - Data Sources
Primary Research
- Web Analytics
- Survey Reports
- Research Institute
- Latest Research Reports
- Opinion Leaders
Secondary Research
- Annual Reports
- White Paper
- Latest Press Release
- Industry Association
- Paid Database
- Investor Presentations

Step 4 - Data Triangulation
Involves using different sources of information in order to increase the validity of a study
These sources are likely to be stakeholders in a program - participants, other researchers, program staff, other community members, and so on.
Then we put all data in single framework & apply various statistical tools to find out the dynamic on the market.
During the analysis stage, feedback from the stakeholder groups would be compared to determine areas of agreement as well as areas of divergence