
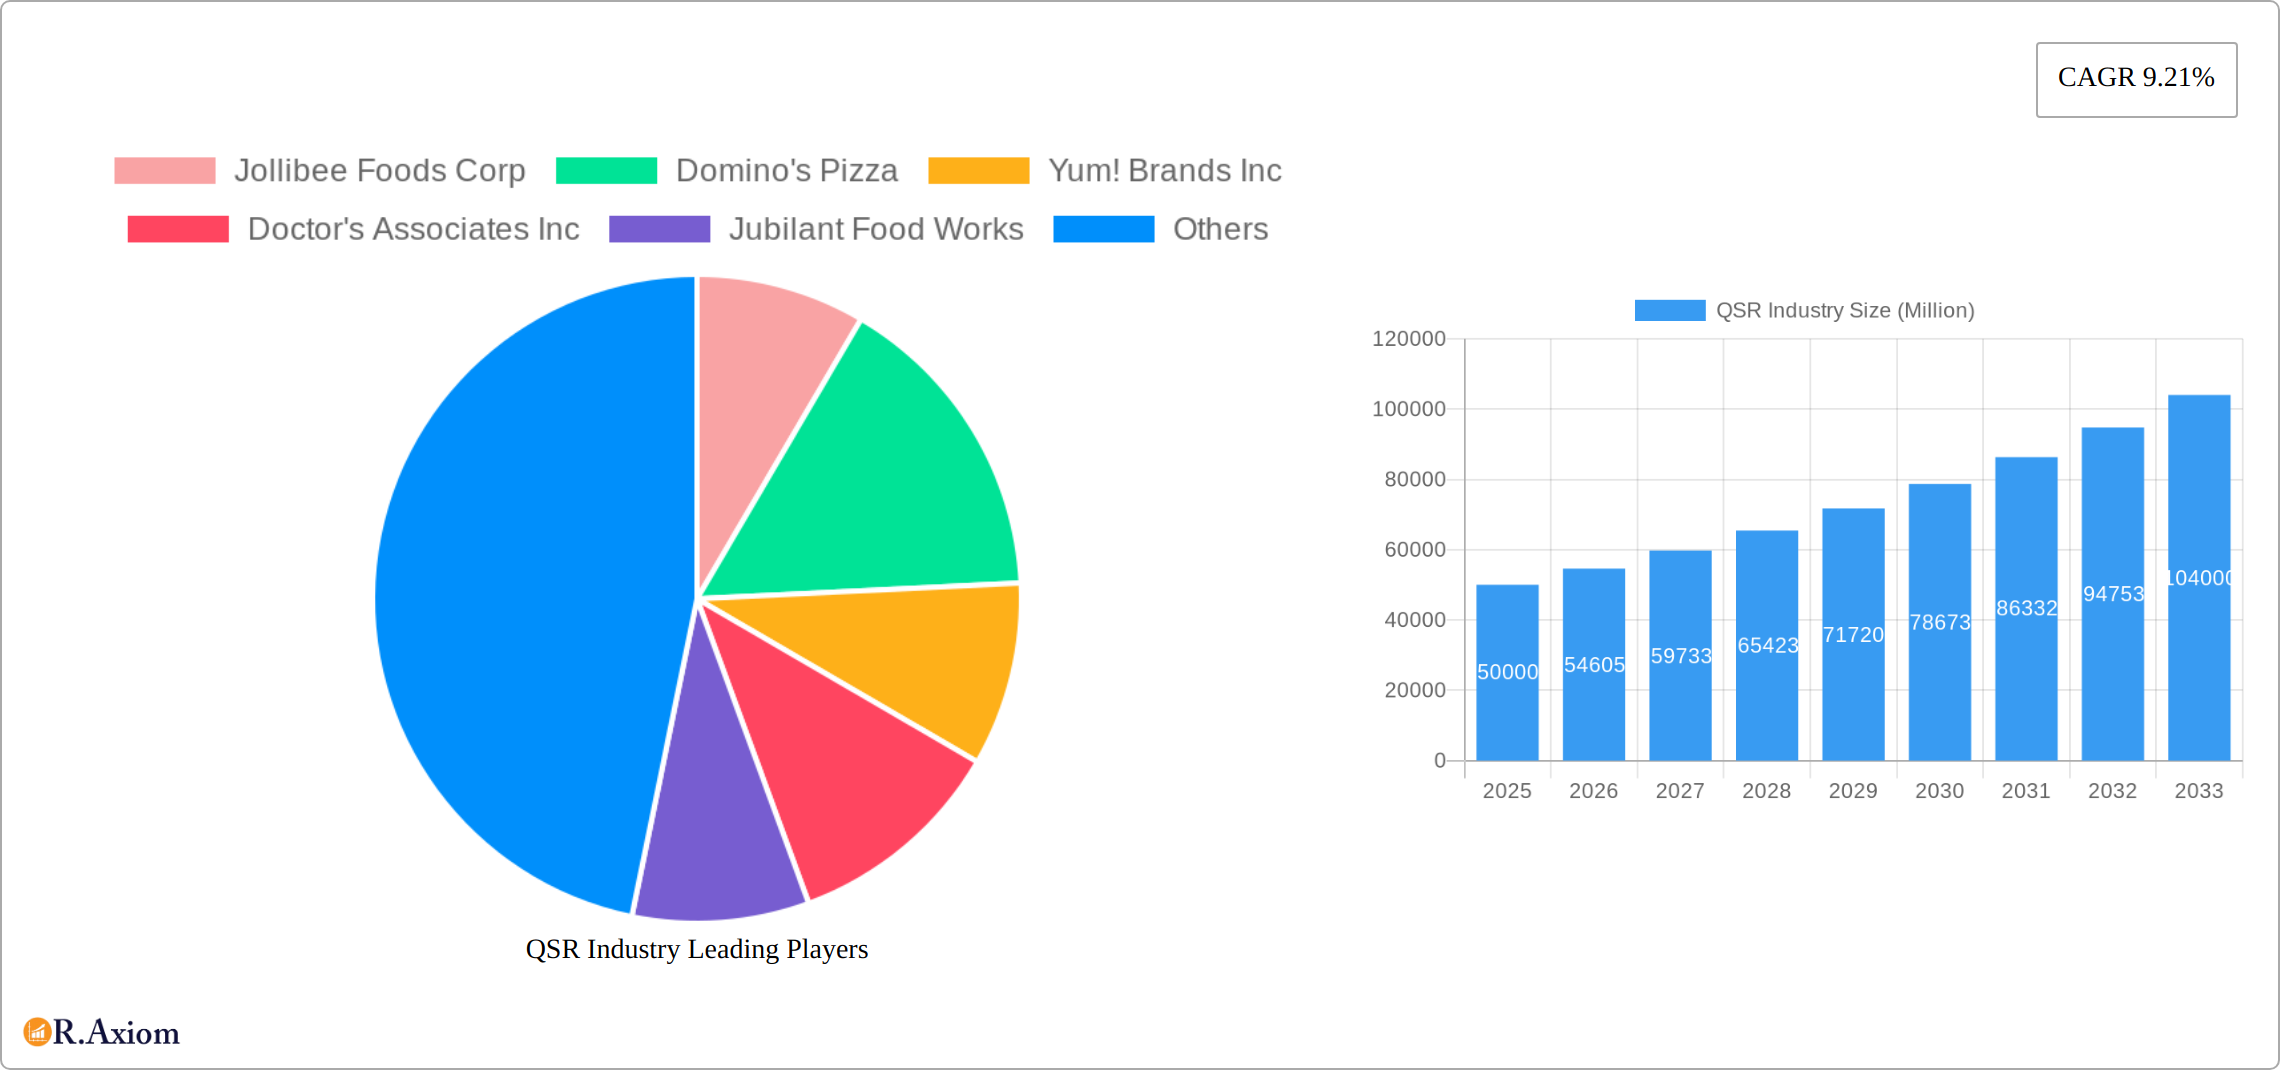
Key Insights
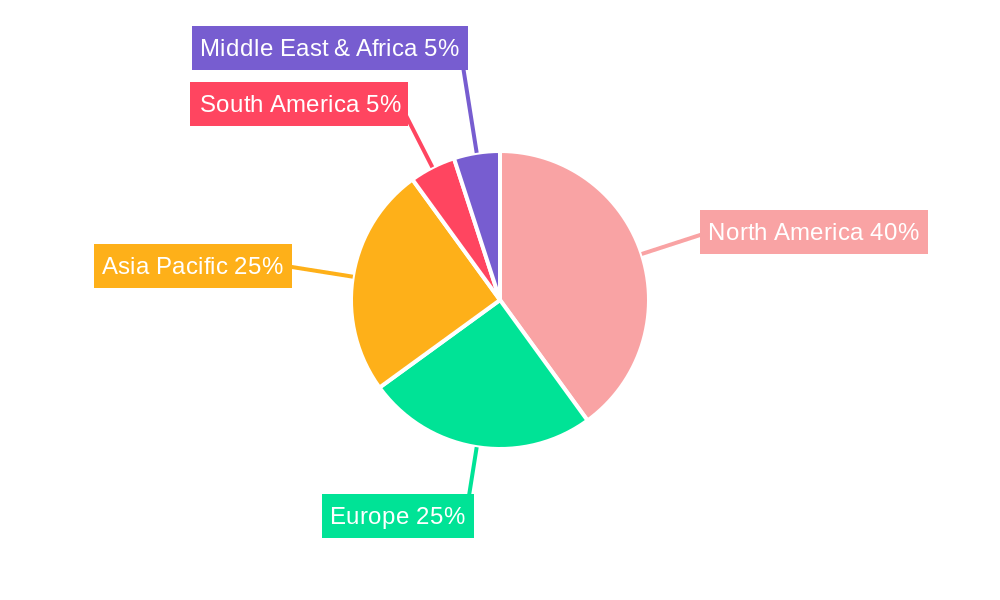
The Quick Service Restaurant (QSR) industry, valued at approximately $XX million in 2025, is experiencing robust growth, projected to expand at a Compound Annual Growth Rate (CAGR) of 9.21% from 2025 to 2033. This expansion is fueled by several key drivers. The rising prevalence of busy lifestyles and increasing disposable incomes are significantly contributing to higher demand for convenient and affordable food options. Furthermore, technological advancements, such as mobile ordering and delivery apps, are streamlining operations and enhancing customer experience, thus boosting industry growth. The increasing popularity of diverse cuisines, including the expansion of burger, pizza, and Asian-inspired QSR chains, cater to evolving consumer preferences and further fuel market expansion. However, the industry faces challenges like increasing operating costs, intense competition, and fluctuations in raw material prices, which could potentially restrain growth. The market is segmented by cuisine type (bakeries, burgers, ice cream, meat-based cuisines, pizza, other QSR cuisines) and outlet structure (independent and chained outlets). Chained outlets, with their established brand recognition and economies of scale, currently dominate the market. Geographically, North America and Asia Pacific represent significant market shares, driven by high consumer spending and a large population base respectively, while other regions like Europe and South America demonstrate steady, albeit slower growth.
The competitive landscape is characterized by both established multinational giants like McDonald's, Yum! Brands, and Domino's Pizza, and regional players. These companies are constantly innovating with menu offerings, loyalty programs, and marketing strategies to maintain a competitive edge. The future success of QSR businesses hinges on their ability to adapt to evolving consumer demands, leverage technological advancements, and maintain operational efficiency in the face of rising costs. The industry is predicted to witness a shift towards healthier and sustainable food options, personalized experiences, and technologically advanced ordering and delivery systems in the coming years. The ongoing expansion into new markets and strategic acquisitions will further shape the industry's landscape over the forecast period, leading to both opportunities and challenges for existing and emerging players.
QSR Industry: A Comprehensive Market Report (2019-2033)
This in-depth report provides a comprehensive analysis of the Quick Service Restaurant (QSR) industry, offering invaluable insights for stakeholders, investors, and industry professionals. The report covers the period from 2019 to 2033, with a focus on the estimated year 2025 and a forecast period spanning 2025-2033. The study encompasses key players such as Jollibee Foods Corp, Domino's Pizza, Yum! Brands Inc, Doctor's Associates Inc, Jubilant Food Works, The Wendy's Company, Starbucks Corporation, Little Ceaser Enterprises Inc, Duskin Co Ltd, Yoshinoya Holdings Co Ltd, McDonald's Corporation, and Restaurant Brands International, examining various segments across cuisine types and outlet structures. Millions are used as the value unit throughout the report.
QSR Industry Market Concentration & Innovation
This section analyzes the level of market concentration within the QSR industry, identifying dominant players and their respective market shares. We explore the key innovation drivers shaping the industry, including technological advancements, evolving consumer preferences, and regulatory changes. The impact of mergers and acquisitions (M&A) activities, including deal values and their influence on market dynamics, is also examined. The regulatory landscape and its effect on market growth are evaluated, along with an examination of product substitutes and their impact on market share. End-user trends influencing consumption patterns and future market demand are analyzed.
- Market Share Analysis: McDonald's and Yum! Brands currently hold significant market share, estimated at xx% and xx%, respectively, in 2025. Other key players like Jollibee Foods Corp and Restaurant Brands International contribute substantially.
- M&A Activity: The total value of M&A deals in the QSR industry during the historical period (2019-2024) reached approximately $xx Million, with a significant increase observed in the last two years.
- Innovation Drivers: Technological advancements in automation, digital ordering, and delivery services are significant innovation drivers, along with the emergence of personalized meal customization options and the focus on plant-based and healthier options.
- Regulatory Frameworks: Regulations related to food safety, labor laws, and environmental sustainability significantly influence industry operations and costs.
QSR Industry Industry Trends & Insights
This section delves into the overarching trends and insights shaping the QSR industry. It covers market growth drivers such as increasing disposable incomes, urbanization, and changing consumer lifestyles. We explore how technological disruptions, including the rise of online ordering platforms and delivery services, are transforming the industry landscape. The changing consumer preferences towards healthier options, personalized experiences, and convenience are explored in detail. The competitive dynamics among key players are analyzed, assessing strategies like branding, pricing, and menu innovation.
- Market Growth: The QSR market experienced a CAGR of xx% during 2019-2024 and is projected to grow at a CAGR of xx% from 2025 to 2033, reaching a market size of $xx Million by 2033.
- Technological Disruptions: The adoption of AI-powered systems, big data analytics, and mobile ordering apps are enhancing operational efficiency and improving customer experiences.
- Consumer Preferences: Consumer demand for healthier menu options, sustainable packaging, and personalized experiences is driving innovation within the industry. The preference for home delivery and convenience continues to grow.
- Competitive Dynamics: Intense competition necessitates companies to focus on efficient operations, brand building, loyalty programs, and effective marketing strategies to maintain market share.

Dominant Markets & Segments in QSR Industry
This section pinpoints the leading regions, countries, and segments within the QSR industry, identifying their key drivers of dominance. This detailed analysis covers Cuisine (Bakeries, Burger, Ice Cream, Meat-Based Cuisines, Pizza, Other QSR Cuisine) and Structure (Independent Outlets, Chained Outlets).
Dominant Segments:
- Cuisine: The Burger segment holds a significant market share, driven by its widespread appeal and established brand recognition. The Pizza segment also maintains a strong position, with ongoing innovation in flavors and delivery services.
- Structure: Chained outlets dominate the market due to their economies of scale, brand recognition, and efficient operations. Independent outlets still maintain a niche presence but face greater challenges in competing with established chains.
Key Drivers of Dominance:
- Economic Policies: Government policies influencing disposable income, taxation, and food safety regulations significantly impact market dynamics in various regions.
- Infrastructure: Adequate transportation infrastructure and a robust digital network are essential for efficient delivery services and overall operational success.
- Consumer Preferences: Varying preferences for specific cuisines and dining experiences across different regions lead to varying segment dominance.
QSR Industry Product Developments
The quick-service restaurant (QSR) industry is a dynamic landscape of continuous product innovation, driven by ever-evolving consumer preferences and rapid technological advancements. This evolution is evident in the proliferation of new menu items featuring healthier ingredients, a surge in plant-based options catering to dietary preferences and ethical concerns, and an increasing focus on personalized customization to enhance the customer experience. Beyond the food itself, technological innovations are revolutionizing operations, leading to improved order accuracy, significantly faster service times, and a more seamless customer journey through sophisticated mobile apps and intuitive digital ordering platforms. These advancements are not merely desirable; they are crucial for maintaining a competitive edge in this fiercely competitive market. Furthermore, a growing emphasis on sustainability is driving the development of eco-friendly packaging options and the optimization of supply chains to minimize environmental impact and improve efficiency.
Report Scope & Segmentation Analysis
This report provides a detailed segmentation analysis of the QSR industry based on cuisine type and outlet structure.
Cuisine:
- Bakeries: This segment is projected to experience xx% growth, driven by increasing demand for convenience and on-the-go snacking.
- Burger: This is a large and established segment with a growth projection of xx%, driven by ongoing innovation and brand loyalty.
- Ice Cream: The ice cream segment is expected to grow at xx%, fueled by demand for indulgent treats and seasonal variations.
- Meat-Based Cuisines: This segment is projected to grow at xx%, but may be influenced by growing interest in plant-based alternatives.
- Pizza: The pizza segment is projected to show xx% growth, mainly due to home delivery and innovative pizza variations.
- Other QSR Cuisine: This segment, encompassing diverse cuisines, is expected to grow at xx%, driven by expanding consumer palate and culinary exploration.
Structure:
- Independent Outlets: This segment faces increased competition and is expected to grow at xx%.
- Chained Outlets: This segment dominates the market and is expected to grow at xx%, benefiting from economies of scale and brand recognition.
Key Drivers of QSR Industry Growth
The robust growth of the QSR industry is fueled by a confluence of significant factors. The ongoing trend of urbanization, coupled with increasingly busy lifestyles, has created a massive demand for quick and convenient meal options. Rising disposable incomes in many parts of the world empower consumers to allocate a larger portion of their budget to dining out, further stimulating market growth. Technological advancements, such as the widespread adoption of online ordering and delivery platforms, have significantly enhanced customer convenience, accelerating this growth trajectory. Moreover, proactive government initiatives focused on promoting food safety and hygiene standards contribute to a more stable and trustworthy industry environment, fostering consumer confidence and encouraging expansion.
Challenges in the QSR Industry Sector
Despite its robust growth, the QSR industry faces a complex web of challenges. Fluctuating raw material prices, coupled with the ever-present risk of supply chain disruptions, can significantly impact profitability and operational stability. The stringent food safety regulations and increasingly complex labor laws necessitate substantial investments in compliance efforts, adding to operational costs. Intense competition within the sector demands continuous innovation in products, services, and marketing strategies to attract and retain customers in a crowded marketplace. Finally, the rising consumer awareness of health and sustainability issues is placing significant pressure on QSR companies to adopt ethical and sustainable practices throughout their entire operations, from sourcing ingredients to managing waste.
Emerging Opportunities in QSR Industry
The QSR industry presents exciting emerging opportunities. Expanding into new and underdeveloped markets offers considerable growth potential. The increasing adoption of technology for personalized marketing, optimized operations, and enhanced customer experiences offers further growth opportunities. The rising consumer preference for healthier and sustainable options provides a pathway for businesses to capitalize on this trend through offering plant-based options and eco-friendly packaging. The development of innovative business models, such as ghost kitchens and cloud kitchens, could also improve efficiency and reach a broader customer base.
Leading Players in the QSR Industry Market
- Jollibee Foods Corp
- Domino's Pizza
- Yum! Brands Inc
- Doctor's Associates Inc
- Jubilant Food Works
- The Wendy's Company
- Starbucks Corporation
- Little Ceaser Enterprises Inc
- Duskin Co Ltd
- Yoshinoya Holdings Co Ltd
- McDonald's Corporation
- Restaurant Brands International
Key Developments in QSR Industry Industry
- January 2023: McDonald's launched a new plant-based burger in several markets.
- March 2022: Yum! Brands announced a significant investment in digital ordering technology.
- June 2021: Domino's Pizza partnered with a delivery service to expand its reach.
- October 2020: A major QSR chain acquired a smaller competitor, resulting in increased market share. (Further details on M&A activity are available within the full report).
Strategic Outlook for QSR Industry Market
The QSR industry is poised for continued growth, driven by ongoing technological advancements, evolving consumer preferences, and expansion into new markets. Companies that successfully adapt to the changing landscape, embrace technological innovations, and focus on providing personalized and sustainable options are expected to thrive. The market’s future potential is strong, with opportunities for further expansion and innovation across various segments. The strategic focus should be on enhancing customer experience, ensuring operational efficiency, and adhering to sustainable practices.
QSR Industry Segmentation
-
1. Cuisine
- 1.1. Bakeries
- 1.2. Burger
- 1.3. Ice Cream
- 1.4. Meat Based Cuisines
- 1.5. Pizza
- 1.6. Other QSR Cuisine
-
2. Structure
- 2.1. Independent Outlets
- 2.2. Chained Outlets
QSR Industry Segmentation By Geography
-
1. North America
- 1.1. United States
- 1.2. Canada
- 1.3. Mexico
- 1.4. Rest of North America
-
2. Europe
- 2.1. United Kingdom
- 2.2. Germany
- 2.3. Spain
- 2.4. France
- 2.5. Italy
- 2.6. Russia
- 2.7. Rest of Europe
-
3. Asia Pacific
- 3.1. China
- 3.2. Japan
- 3.3. India
- 3.4. Australia
- 3.5. Rest of Asia Pacific
-
4. South America
- 4.1. Brazil
- 4.2. Argentina
- 4.3. Rest of South America
- 5. Middle East
-
6. United Arab Emirates
- 6.1. South Africa
- 6.2. Rest of Middle East
QSR Industry REPORT HIGHLIGHTS
| Aspects | Details |
|---|---|
| Study Period | 2019-2033 |
| Base Year | 2024 |
| Estimated Year | 2025 |
| Forecast Period | 2025-2033 |
| Historical Period | 2019-2024 |
| Growth Rate | CAGR of 9.21% from 2019-2033 |
| Segmentation |
|
Table of Contents
- 1. Introduction
- 1.1. Research Scope
- 1.2. Market Segmentation
- 1.3. Research Methodology
- 1.4. Definitions and Assumptions
- 2. Executive Summary
- 2.1. Introduction
- 3. Market Dynamics
- 3.1. Introduction
- 3.2. Market Drivers
- 3.2.1. Growing Presence of International Fast-Food Restaurants; Restaurant Digitization and AI Are Transforming the QSR Industry
- 3.3. Market Restrains
- 3.3.1. Consumer Inclination Toward Ready Meals
- 3.4. Market Trends
- 3.4.1. Growing Presence of International Fast-Food Restaurants
- 4. Market Factor Analysis
- 4.1. Porters Five Forces
- 4.2. Supply/Value Chain
- 4.3. PESTEL analysis
- 4.4. Market Entropy
- 4.5. Patent/Trademark Analysis
- 5. Global QSR Industry Analysis, Insights and Forecast, 2019-2031
- 5.1. Market Analysis, Insights and Forecast - by Cuisine
- 5.1.1. Bakeries
- 5.1.2. Burger
- 5.1.3. Ice Cream
- 5.1.4. Meat Based Cuisines
- 5.1.5. Pizza
- 5.1.6. Other QSR Cuisine
- 5.2. Market Analysis, Insights and Forecast - by Structure
- 5.2.1. Independent Outlets
- 5.2.2. Chained Outlets
- 5.3. Market Analysis, Insights and Forecast - by Region
- 5.3.1. North America
- 5.3.2. Europe
- 5.3.3. Asia Pacific
- 5.3.4. South America
- 5.3.5. Middle East
- 5.3.6. United Arab Emirates
- 5.1. Market Analysis, Insights and Forecast - by Cuisine
- 6. North America QSR Industry Analysis, Insights and Forecast, 2019-2031
- 6.1. Market Analysis, Insights and Forecast - by Cuisine
- 6.1.1. Bakeries
- 6.1.2. Burger
- 6.1.3. Ice Cream
- 6.1.4. Meat Based Cuisines
- 6.1.5. Pizza
- 6.1.6. Other QSR Cuisine
- 6.2. Market Analysis, Insights and Forecast - by Structure
- 6.2.1. Independent Outlets
- 6.2.2. Chained Outlets
- 6.1. Market Analysis, Insights and Forecast - by Cuisine
- 7. Europe QSR Industry Analysis, Insights and Forecast, 2019-2031
- 7.1. Market Analysis, Insights and Forecast - by Cuisine
- 7.1.1. Bakeries
- 7.1.2. Burger
- 7.1.3. Ice Cream
- 7.1.4. Meat Based Cuisines
- 7.1.5. Pizza
- 7.1.6. Other QSR Cuisine
- 7.2. Market Analysis, Insights and Forecast - by Structure
- 7.2.1. Independent Outlets
- 7.2.2. Chained Outlets
- 7.1. Market Analysis, Insights and Forecast - by Cuisine
- 8. Asia Pacific QSR Industry Analysis, Insights and Forecast, 2019-2031
- 8.1. Market Analysis, Insights and Forecast - by Cuisine
- 8.1.1. Bakeries
- 8.1.2. Burger
- 8.1.3. Ice Cream
- 8.1.4. Meat Based Cuisines
- 8.1.5. Pizza
- 8.1.6. Other QSR Cuisine
- 8.2. Market Analysis, Insights and Forecast - by Structure
- 8.2.1. Independent Outlets
- 8.2.2. Chained Outlets
- 8.1. Market Analysis, Insights and Forecast - by Cuisine
- 9. South America QSR Industry Analysis, Insights and Forecast, 2019-2031
- 9.1. Market Analysis, Insights and Forecast - by Cuisine
- 9.1.1. Bakeries
- 9.1.2. Burger
- 9.1.3. Ice Cream
- 9.1.4. Meat Based Cuisines
- 9.1.5. Pizza
- 9.1.6. Other QSR Cuisine
- 9.2. Market Analysis, Insights and Forecast - by Structure
- 9.2.1. Independent Outlets
- 9.2.2. Chained Outlets
- 9.1. Market Analysis, Insights and Forecast - by Cuisine
- 10. Middle East QSR Industry Analysis, Insights and Forecast, 2019-2031
- 10.1. Market Analysis, Insights and Forecast - by Cuisine
- 10.1.1. Bakeries
- 10.1.2. Burger
- 10.1.3. Ice Cream
- 10.1.4. Meat Based Cuisines
- 10.1.5. Pizza
- 10.1.6. Other QSR Cuisine
- 10.2. Market Analysis, Insights and Forecast - by Structure
- 10.2.1. Independent Outlets
- 10.2.2. Chained Outlets
- 10.1. Market Analysis, Insights and Forecast - by Cuisine
- 11. United Arab Emirates QSR Industry Analysis, Insights and Forecast, 2019-2031
- 11.1. Market Analysis, Insights and Forecast - by Cuisine
- 11.1.1. Bakeries
- 11.1.2. Burger
- 11.1.3. Ice Cream
- 11.1.4. Meat Based Cuisines
- 11.1.5. Pizza
- 11.1.6. Other QSR Cuisine
- 11.2. Market Analysis, Insights and Forecast - by Structure
- 11.2.1. Independent Outlets
- 11.2.2. Chained Outlets
- 11.1. Market Analysis, Insights and Forecast - by Cuisine
- 12. North America QSR Industry Analysis, Insights and Forecast, 2019-2031
- 12.1. Market Analysis, Insights and Forecast - By Country/Sub-region
- 12.1.1 United States
- 12.1.2 Canada
- 12.1.3 Mexico
- 12.1.4 Rest of North America
- 13. Europe QSR Industry Analysis, Insights and Forecast, 2019-2031
- 13.1. Market Analysis, Insights and Forecast - By Country/Sub-region
- 13.1.1 United Kingdom
- 13.1.2 Germany
- 13.1.3 Spain
- 13.1.4 France
- 13.1.5 Italy
- 13.1.6 Russia
- 13.1.7 Rest of Europe
- 14. Asia Pacific QSR Industry Analysis, Insights and Forecast, 2019-2031
- 14.1. Market Analysis, Insights and Forecast - By Country/Sub-region
- 14.1.1 China
- 14.1.2 Japan
- 14.1.3 India
- 14.1.4 Australia
- 14.1.5 Rest of Asia Pacific
- 15. South America QSR Industry Analysis, Insights and Forecast, 2019-2031
- 15.1. Market Analysis, Insights and Forecast - By Country/Sub-region
- 15.1.1 Brazil
- 15.1.2 Argentina
- 15.1.3 Rest of South America
- 16. Middle East & Africa QSR Industry Analysis, Insights and Forecast, 2019-2031
- 16.1. Market Analysis, Insights and Forecast - By Country/Sub-region
- 16.1.1 UAE
- 16.1.2 South Africa
- 16.1.3 Saudi Arabia
- 16.1.4 Rest of MEA
- 17. Competitive Analysis
- 17.1. Global Market Share Analysis 2024
- 17.2. Company Profiles
- 17.2.1 Jollibee Foods Corp
- 17.2.1.1. Overview
- 17.2.1.2. Products
- 17.2.1.3. SWOT Analysis
- 17.2.1.4. Recent Developments
- 17.2.1.5. Financials (Based on Availability)
- 17.2.2 Domino's Pizza
- 17.2.2.1. Overview
- 17.2.2.2. Products
- 17.2.2.3. SWOT Analysis
- 17.2.2.4. Recent Developments
- 17.2.2.5. Financials (Based on Availability)
- 17.2.3 Yum! Brands Inc
- 17.2.3.1. Overview
- 17.2.3.2. Products
- 17.2.3.3. SWOT Analysis
- 17.2.3.4. Recent Developments
- 17.2.3.5. Financials (Based on Availability)
- 17.2.4 Doctor's Associates Inc
- 17.2.4.1. Overview
- 17.2.4.2. Products
- 17.2.4.3. SWOT Analysis
- 17.2.4.4. Recent Developments
- 17.2.4.5. Financials (Based on Availability)
- 17.2.5 Jubilant Food Works
- 17.2.5.1. Overview
- 17.2.5.2. Products
- 17.2.5.3. SWOT Analysis
- 17.2.5.4. Recent Developments
- 17.2.5.5. Financials (Based on Availability)
- 17.2.6 The Wendy's Company
- 17.2.6.1. Overview
- 17.2.6.2. Products
- 17.2.6.3. SWOT Analysis
- 17.2.6.4. Recent Developments
- 17.2.6.5. Financials (Based on Availability)
- 17.2.7 Starbucks Corporation*List Not Exhaustive
- 17.2.7.1. Overview
- 17.2.7.2. Products
- 17.2.7.3. SWOT Analysis
- 17.2.7.4. Recent Developments
- 17.2.7.5. Financials (Based on Availability)
- 17.2.8 Little Ceaser Enterprises Inc
- 17.2.8.1. Overview
- 17.2.8.2. Products
- 17.2.8.3. SWOT Analysis
- 17.2.8.4. Recent Developments
- 17.2.8.5. Financials (Based on Availability)
- 17.2.9 Duskin Co Ltd
- 17.2.9.1. Overview
- 17.2.9.2. Products
- 17.2.9.3. SWOT Analysis
- 17.2.9.4. Recent Developments
- 17.2.9.5. Financials (Based on Availability)
- 17.2.10 Yoshinoya Holdings Co Ltd
- 17.2.10.1. Overview
- 17.2.10.2. Products
- 17.2.10.3. SWOT Analysis
- 17.2.10.4. Recent Developments
- 17.2.10.5. Financials (Based on Availability)
- 17.2.11 McDonald's Corporation
- 17.2.11.1. Overview
- 17.2.11.2. Products
- 17.2.11.3. SWOT Analysis
- 17.2.11.4. Recent Developments
- 17.2.11.5. Financials (Based on Availability)
- 17.2.12 Restaurant Brands International
- 17.2.12.1. Overview
- 17.2.12.2. Products
- 17.2.12.3. SWOT Analysis
- 17.2.12.4. Recent Developments
- 17.2.12.5. Financials (Based on Availability)
- 17.2.1 Jollibee Foods Corp
List of Figures
- Figure 1: Global QSR Industry Revenue Breakdown (Million, %) by Region 2024 & 2032
- Figure 2: North America QSR Industry Revenue (Million), by Country 2024 & 2032
- Figure 3: North America QSR Industry Revenue Share (%), by Country 2024 & 2032
- Figure 4: Europe QSR Industry Revenue (Million), by Country 2024 & 2032
- Figure 5: Europe QSR Industry Revenue Share (%), by Country 2024 & 2032
- Figure 6: Asia Pacific QSR Industry Revenue (Million), by Country 2024 & 2032
- Figure 7: Asia Pacific QSR Industry Revenue Share (%), by Country 2024 & 2032
- Figure 8: South America QSR Industry Revenue (Million), by Country 2024 & 2032
- Figure 9: South America QSR Industry Revenue Share (%), by Country 2024 & 2032
- Figure 10: Middle East & Africa QSR Industry Revenue (Million), by Country 2024 & 2032
- Figure 11: Middle East & Africa QSR Industry Revenue Share (%), by Country 2024 & 2032
- Figure 12: North America QSR Industry Revenue (Million), by Cuisine 2024 & 2032
- Figure 13: North America QSR Industry Revenue Share (%), by Cuisine 2024 & 2032
- Figure 14: North America QSR Industry Revenue (Million), by Structure 2024 & 2032
- Figure 15: North America QSR Industry Revenue Share (%), by Structure 2024 & 2032
- Figure 16: North America QSR Industry Revenue (Million), by Country 2024 & 2032
- Figure 17: North America QSR Industry Revenue Share (%), by Country 2024 & 2032
- Figure 18: Europe QSR Industry Revenue (Million), by Cuisine 2024 & 2032
- Figure 19: Europe QSR Industry Revenue Share (%), by Cuisine 2024 & 2032
- Figure 20: Europe QSR Industry Revenue (Million), by Structure 2024 & 2032
- Figure 21: Europe QSR Industry Revenue Share (%), by Structure 2024 & 2032
- Figure 22: Europe QSR Industry Revenue (Million), by Country 2024 & 2032
- Figure 23: Europe QSR Industry Revenue Share (%), by Country 2024 & 2032
- Figure 24: Asia Pacific QSR Industry Revenue (Million), by Cuisine 2024 & 2032
- Figure 25: Asia Pacific QSR Industry Revenue Share (%), by Cuisine 2024 & 2032
- Figure 26: Asia Pacific QSR Industry Revenue (Million), by Structure 2024 & 2032
- Figure 27: Asia Pacific QSR Industry Revenue Share (%), by Structure 2024 & 2032
- Figure 28: Asia Pacific QSR Industry Revenue (Million), by Country 2024 & 2032
- Figure 29: Asia Pacific QSR Industry Revenue Share (%), by Country 2024 & 2032
- Figure 30: South America QSR Industry Revenue (Million), by Cuisine 2024 & 2032
- Figure 31: South America QSR Industry Revenue Share (%), by Cuisine 2024 & 2032
- Figure 32: South America QSR Industry Revenue (Million), by Structure 2024 & 2032
- Figure 33: South America QSR Industry Revenue Share (%), by Structure 2024 & 2032
- Figure 34: South America QSR Industry Revenue (Million), by Country 2024 & 2032
- Figure 35: South America QSR Industry Revenue Share (%), by Country 2024 & 2032
- Figure 36: Middle East QSR Industry Revenue (Million), by Cuisine 2024 & 2032
- Figure 37: Middle East QSR Industry Revenue Share (%), by Cuisine 2024 & 2032
- Figure 38: Middle East QSR Industry Revenue (Million), by Structure 2024 & 2032
- Figure 39: Middle East QSR Industry Revenue Share (%), by Structure 2024 & 2032
- Figure 40: Middle East QSR Industry Revenue (Million), by Country 2024 & 2032
- Figure 41: Middle East QSR Industry Revenue Share (%), by Country 2024 & 2032
- Figure 42: United Arab Emirates QSR Industry Revenue (Million), by Cuisine 2024 & 2032
- Figure 43: United Arab Emirates QSR Industry Revenue Share (%), by Cuisine 2024 & 2032
- Figure 44: United Arab Emirates QSR Industry Revenue (Million), by Structure 2024 & 2032
- Figure 45: United Arab Emirates QSR Industry Revenue Share (%), by Structure 2024 & 2032
- Figure 46: United Arab Emirates QSR Industry Revenue (Million), by Country 2024 & 2032
- Figure 47: United Arab Emirates QSR Industry Revenue Share (%), by Country 2024 & 2032
List of Tables
- Table 1: Global QSR Industry Revenue Million Forecast, by Region 2019 & 2032
- Table 2: Global QSR Industry Revenue Million Forecast, by Cuisine 2019 & 2032
- Table 3: Global QSR Industry Revenue Million Forecast, by Structure 2019 & 2032
- Table 4: Global QSR Industry Revenue Million Forecast, by Region 2019 & 2032
- Table 5: Global QSR Industry Revenue Million Forecast, by Country 2019 & 2032
- Table 6: United States QSR Industry Revenue (Million) Forecast, by Application 2019 & 2032
- Table 7: Canada QSR Industry Revenue (Million) Forecast, by Application 2019 & 2032
- Table 8: Mexico QSR Industry Revenue (Million) Forecast, by Application 2019 & 2032
- Table 9: Rest of North America QSR Industry Revenue (Million) Forecast, by Application 2019 & 2032
- Table 10: Global QSR Industry Revenue Million Forecast, by Country 2019 & 2032
- Table 11: United Kingdom QSR Industry Revenue (Million) Forecast, by Application 2019 & 2032
- Table 12: Germany QSR Industry Revenue (Million) Forecast, by Application 2019 & 2032
- Table 13: Spain QSR Industry Revenue (Million) Forecast, by Application 2019 & 2032
- Table 14: France QSR Industry Revenue (Million) Forecast, by Application 2019 & 2032
- Table 15: Italy QSR Industry Revenue (Million) Forecast, by Application 2019 & 2032
- Table 16: Russia QSR Industry Revenue (Million) Forecast, by Application 2019 & 2032
- Table 17: Rest of Europe QSR Industry Revenue (Million) Forecast, by Application 2019 & 2032
- Table 18: Global QSR Industry Revenue Million Forecast, by Country 2019 & 2032
- Table 19: China QSR Industry Revenue (Million) Forecast, by Application 2019 & 2032
- Table 20: Japan QSR Industry Revenue (Million) Forecast, by Application 2019 & 2032
- Table 21: India QSR Industry Revenue (Million) Forecast, by Application 2019 & 2032
- Table 22: Australia QSR Industry Revenue (Million) Forecast, by Application 2019 & 2032
- Table 23: Rest of Asia Pacific QSR Industry Revenue (Million) Forecast, by Application 2019 & 2032
- Table 24: Global QSR Industry Revenue Million Forecast, by Country 2019 & 2032
- Table 25: Brazil QSR Industry Revenue (Million) Forecast, by Application 2019 & 2032
- Table 26: Argentina QSR Industry Revenue (Million) Forecast, by Application 2019 & 2032
- Table 27: Rest of South America QSR Industry Revenue (Million) Forecast, by Application 2019 & 2032
- Table 28: Global QSR Industry Revenue Million Forecast, by Country 2019 & 2032
- Table 29: UAE QSR Industry Revenue (Million) Forecast, by Application 2019 & 2032
- Table 30: South Africa QSR Industry Revenue (Million) Forecast, by Application 2019 & 2032
- Table 31: Saudi Arabia QSR Industry Revenue (Million) Forecast, by Application 2019 & 2032
- Table 32: Rest of MEA QSR Industry Revenue (Million) Forecast, by Application 2019 & 2032
- Table 33: Global QSR Industry Revenue Million Forecast, by Cuisine 2019 & 2032
- Table 34: Global QSR Industry Revenue Million Forecast, by Structure 2019 & 2032
- Table 35: Global QSR Industry Revenue Million Forecast, by Country 2019 & 2032
- Table 36: United States QSR Industry Revenue (Million) Forecast, by Application 2019 & 2032
- Table 37: Canada QSR Industry Revenue (Million) Forecast, by Application 2019 & 2032
- Table 38: Mexico QSR Industry Revenue (Million) Forecast, by Application 2019 & 2032
- Table 39: Rest of North America QSR Industry Revenue (Million) Forecast, by Application 2019 & 2032
- Table 40: Global QSR Industry Revenue Million Forecast, by Cuisine 2019 & 2032
- Table 41: Global QSR Industry Revenue Million Forecast, by Structure 2019 & 2032
- Table 42: Global QSR Industry Revenue Million Forecast, by Country 2019 & 2032
- Table 43: United Kingdom QSR Industry Revenue (Million) Forecast, by Application 2019 & 2032
- Table 44: Germany QSR Industry Revenue (Million) Forecast, by Application 2019 & 2032
- Table 45: Spain QSR Industry Revenue (Million) Forecast, by Application 2019 & 2032
- Table 46: France QSR Industry Revenue (Million) Forecast, by Application 2019 & 2032
- Table 47: Italy QSR Industry Revenue (Million) Forecast, by Application 2019 & 2032
- Table 48: Russia QSR Industry Revenue (Million) Forecast, by Application 2019 & 2032
- Table 49: Rest of Europe QSR Industry Revenue (Million) Forecast, by Application 2019 & 2032
- Table 50: Global QSR Industry Revenue Million Forecast, by Cuisine 2019 & 2032
- Table 51: Global QSR Industry Revenue Million Forecast, by Structure 2019 & 2032
- Table 52: Global QSR Industry Revenue Million Forecast, by Country 2019 & 2032
- Table 53: China QSR Industry Revenue (Million) Forecast, by Application 2019 & 2032
- Table 54: Japan QSR Industry Revenue (Million) Forecast, by Application 2019 & 2032
- Table 55: India QSR Industry Revenue (Million) Forecast, by Application 2019 & 2032
- Table 56: Australia QSR Industry Revenue (Million) Forecast, by Application 2019 & 2032
- Table 57: Rest of Asia Pacific QSR Industry Revenue (Million) Forecast, by Application 2019 & 2032
- Table 58: Global QSR Industry Revenue Million Forecast, by Cuisine 2019 & 2032
- Table 59: Global QSR Industry Revenue Million Forecast, by Structure 2019 & 2032
- Table 60: Global QSR Industry Revenue Million Forecast, by Country 2019 & 2032
- Table 61: Brazil QSR Industry Revenue (Million) Forecast, by Application 2019 & 2032
- Table 62: Argentina QSR Industry Revenue (Million) Forecast, by Application 2019 & 2032
- Table 63: Rest of South America QSR Industry Revenue (Million) Forecast, by Application 2019 & 2032
- Table 64: Global QSR Industry Revenue Million Forecast, by Cuisine 2019 & 2032
- Table 65: Global QSR Industry Revenue Million Forecast, by Structure 2019 & 2032
- Table 66: Global QSR Industry Revenue Million Forecast, by Country 2019 & 2032
- Table 67: Global QSR Industry Revenue Million Forecast, by Cuisine 2019 & 2032
- Table 68: Global QSR Industry Revenue Million Forecast, by Structure 2019 & 2032
- Table 69: Global QSR Industry Revenue Million Forecast, by Country 2019 & 2032
- Table 70: South Africa QSR Industry Revenue (Million) Forecast, by Application 2019 & 2032
- Table 71: Rest of Middle East QSR Industry Revenue (Million) Forecast, by Application 2019 & 2032
Frequently Asked Questions
1. What is the projected Compound Annual Growth Rate (CAGR) of the QSR Industry?
The projected CAGR is approximately 9.21%.
2. Which companies are prominent players in the QSR Industry?
Key companies in the market include Jollibee Foods Corp, Domino's Pizza, Yum! Brands Inc, Doctor's Associates Inc, Jubilant Food Works, The Wendy's Company, Starbucks Corporation*List Not Exhaustive, Little Ceaser Enterprises Inc, Duskin Co Ltd, Yoshinoya Holdings Co Ltd, McDonald's Corporation, Restaurant Brands International.
3. What are the main segments of the QSR Industry?
The market segments include Cuisine, Structure.
4. Can you provide details about the market size?
The market size is estimated to be USD XX Million as of 2022.
5. What are some drivers contributing to market growth?
Growing Presence of International Fast-Food Restaurants; Restaurant Digitization and AI Are Transforming the QSR Industry.
6. What are the notable trends driving market growth?
Growing Presence of International Fast-Food Restaurants.
7. Are there any restraints impacting market growth?
Consumer Inclination Toward Ready Meals.
8. Can you provide examples of recent developments in the market?
N/A
9. What pricing options are available for accessing the report?
Pricing options include single-user, multi-user, and enterprise licenses priced at USD 4750, USD 5250, and USD 8750 respectively.
10. Is the market size provided in terms of value or volume?
The market size is provided in terms of value, measured in Million.
11. Are there any specific market keywords associated with the report?
Yes, the market keyword associated with the report is "QSR Industry," which aids in identifying and referencing the specific market segment covered.
12. How do I determine which pricing option suits my needs best?
The pricing options vary based on user requirements and access needs. Individual users may opt for single-user licenses, while businesses requiring broader access may choose multi-user or enterprise licenses for cost-effective access to the report.
13. Are there any additional resources or data provided in the QSR Industry report?
While the report offers comprehensive insights, it's advisable to review the specific contents or supplementary materials provided to ascertain if additional resources or data are available.
14. How can I stay updated on further developments or reports in the QSR Industry?
To stay informed about further developments, trends, and reports in the QSR Industry, consider subscribing to industry newsletters, following relevant companies and organizations, or regularly checking reputable industry news sources and publications.
Methodology
Step 1 - Identification of Relevant Samples Size from Population Database


Step 2 - Approaches for Defining Global Market Size (Value, Volume* & Price*)

Note*: In applicable scenarios
Step 3 - Data Sources
Primary Research
- Web Analytics
- Survey Reports
- Research Institute
- Latest Research Reports
- Opinion Leaders
Secondary Research
- Annual Reports
- White Paper
- Latest Press Release
- Industry Association
- Paid Database
- Investor Presentations

Step 4 - Data Triangulation
Involves using different sources of information in order to increase the validity of a study
These sources are likely to be stakeholders in a program - participants, other researchers, program staff, other community members, and so on.
Then we put all data in single framework & apply various statistical tools to find out the dynamic on the market.
During the analysis stage, feedback from the stakeholder groups would be compared to determine areas of agreement as well as areas of divergence


