
Key Insights
The recovered paper industry, characterized by a 2.70% CAGR, presents a dynamic market landscape driven by increasing environmental awareness, stringent regulations on waste management, and the growing demand for sustainable packaging solutions. The industry's segmentation, encompassing printing and writing paper, newsprint, tissue, containerboard, and other types, reflects diverse applications and varying recycling rates. Key players like International Paper, Smurfit Kappa, and Nine Dragons Paper are driving innovation and expansion, particularly in regions with robust recycling infrastructure and supportive government policies. North America and Europe, currently holding significant market shares, are expected to maintain their prominence due to established recycling programs and high paper consumption. However, the Asia-Pacific region, fueled by rapid industrialization and urbanization in countries like China and India, is poised for substantial growth, representing a significant opportunity for industry expansion and investment. The market faces challenges including fluctuating paper prices, inconsistent waste collection systems in certain regions, and the need for advanced sorting and processing technologies to ensure high-quality recycled fiber.
Growth within the recovered paper market will be influenced by several factors, including the increasing adoption of sustainable practices across various industries, technological advancements in paper recycling processes, and government initiatives promoting circular economy models. Fluctuations in global commodity prices, however, pose a risk to profitability. The market's regional diversity offers both opportunities and challenges. While established markets in North America and Europe provide stability, emerging markets in Asia-Pacific and other regions present lucrative growth potential, albeit with infrastructure and logistical complexities. Future market development will be contingent on overcoming these challenges through strategic partnerships, technological innovation, and investment in efficient and scalable recycling solutions. Companies that can successfully navigate these dynamics and capitalize on emerging opportunities are likely to be best positioned for long-term success within this growing industry.

Recovered Paper Industry: Market Analysis & Growth Forecast (2019-2033)
This comprehensive report provides an in-depth analysis of the global recovered paper industry, offering valuable insights for stakeholders, investors, and industry professionals. The study covers the period from 2019 to 2033, with 2025 serving as the base and estimated year. The report meticulously examines market dynamics, competitive landscapes, and future growth prospects, incorporating key performance indicators (KPIs) and predictive modeling to provide actionable intelligence.
Recovered Paper Industry Market Concentration & Innovation
This section analyzes the competitive landscape of the recovered paper industry, evaluating market concentration, innovation drivers, regulatory influences, and market dynamics. The report assesses the market share of major players such as International Paper, Smurfit Kappa Group plc, Nine Dragons Paper (Holdings) Limited, Stora Enso Oyj, and DS Smith Plc, providing a granular view of their competitive strategies. Furthermore, the analysis includes an examination of mergers and acquisitions (M&A) activities within the industry, quantifying deal values in Millions (e.g., a total M&A deal value of $XX Million was recorded between 2019 and 2024). The influence of regulatory frameworks on innovation and market access is also explored, alongside an evaluation of substitute products and evolving end-user trends. The report highlights key innovation drivers, such as advancements in recycling technologies and the increasing demand for sustainable packaging solutions.
- Market Share Analysis: Detailed breakdown of market share for leading players (e.g., International Paper holds XX% market share in 2025).
- M&A Activity: Analysis of major M&A deals and their impact on market consolidation (e.g., XX number of deals totaling $XX Million in value during the historical period).
- Innovation Drivers: Assessment of technological advancements and their influence on market growth (e.g., advancements in pulping technologies).
- Regulatory Landscape: Analysis of environmental regulations and their impact on the industry's growth trajectory.
Recovered Paper Industry Industry Trends & Insights
This section delves into the key trends shaping the recovered paper industry, encompassing market growth drivers, technological disruptions, shifting consumer preferences, and competitive dynamics. The report projects a Compound Annual Growth Rate (CAGR) of XX% for the forecast period (2025-2033), driven by factors such as increasing environmental awareness, stringent regulations promoting recycling, and rising demand for sustainable packaging. Technological advancements in paper recycling processes, leading to higher efficiency and reduced costs, are also driving market growth. The changing consumer preferences towards eco-friendly products further bolster the industry's prospects. The report examines the competitive dynamics of the industry, highlighting the strategies adopted by major players to maintain their market positions. Market penetration of recycled paper in various applications is projected to reach XX% by 2033.
Dominant Markets & Segments in Recovered Paper Industry
This section identifies the leading geographical regions and product segments within the recovered paper industry. The analysis focuses on market size and growth for each segment – Printing and Writing Paper, Newsprint, Tissue, Containerboard, and Other Types – highlighting the dominant segment(s). Containerboard is expected to remain the dominant segment, driven by the continuous growth of the packaging industry. The leading region is expected to be [Region Name], owing to factors such as robust economic growth, favorable government policies, and well-established recycling infrastructure.
- Containerboard: Key drivers include the booming e-commerce sector and increasing demand for sustainable packaging.
- Printing and Writing Paper: Drivers include the continued demand from the printing and publishing industries, albeit facing challenges from digitalization.
- Newsprint: Growth is projected to remain relatively stagnant due to decreasing newspaper circulation.
- Tissue: Growth is driven by increasing hygiene awareness and rising disposable incomes.
- Other Types: This segment shows potential growth due to innovative applications and specialized uses.
Recovered Paper Industry Product Developments
This section analyzes recent product innovations and applications within the recovered paper industry. Significant advancements in de-inking technologies and pulp production processes are leading to higher-quality recycled paper, expanding its applications. The development of innovative and sustainable packaging solutions using recycled paper is a key trend. These advancements are driving the industry's competitiveness and enabling it to meet the growing demand for environmentally friendly products. The development of new recycled paper grades tailored to specific end-use applications further enhances the industry’s potential.
Report Scope & Segmentation Analysis
This report segments the recovered paper market by type: Printing and Writing Paper, Newsprint, Tissue, Containerboard, and Other Types. Each segment’s growth trajectory, market size (in Millions), and competitive dynamics are analyzed in detail. For example, the Containerboard segment is expected to witness significant growth, driven by the rising demand for corrugated boxes. The report also provides detailed regional breakdowns, offering a comprehensive view of the global recovered paper market.
Key Drivers of Recovered Paper Industry Growth
The growth of the recovered paper industry is primarily driven by increasing environmental awareness and stringent government regulations promoting recycling. The rise of the circular economy concept and the increasing demand for sustainable packaging solutions also significantly contribute. Furthermore, technological advancements in recycling processes, resulting in higher efficiency and reduced costs, fuel the industry's expansion.
Challenges in the Recovered Paper Industry Sector
The recovered paper industry faces several challenges, including fluctuating raw material prices, inconsistent supply of recovered paper, and competition from alternative packaging materials. Stringent environmental regulations can also present challenges, demanding substantial investment in compliance. Supply chain disruptions and price volatility of recycled fiber impact profitability.
Emerging Opportunities in Recovered Paper Industry
Emerging opportunities lie in the development of innovative recycled paper products, catering to niche markets and specific applications. Expanding into new geographical regions with growing demand for recycled materials presents significant potential. Technological advancements enabling the recycling of complex paper streams and the development of high-quality recycled fiber for specialized applications offer further opportunities.
Leading Players in the Recovered Paper Industry Market
- International Paper
- Tay Paper Recycling Pte Ltd
- Smurfit Kappa Group plc
- Nine Dragons Paper (Holdings) Limited
- Stora Enso Oyj
- S A Industrias Celulosa Aragonesa (SAICA)
- Visy Industrie
- DS Smith Plc
Key Developments in Recovered Paper Industry Industry
- 2022 Q3: International Paper announces a significant investment in a new recycling facility.
- 2023 Q1: Smurfit Kappa Group plc acquires a smaller competitor, expanding its market share.
- 2024 Q2: New regulations on packaging waste are introduced in [Region Name], impacting the industry. (Further specific developments with dates and impacts will be added to the final report.)
Strategic Outlook for Recovered Paper Industry Market
The recovered paper industry is poised for significant growth, driven by the increasing demand for sustainable materials and stringent environmental regulations. The focus on innovation, including the development of new recycling technologies and high-quality recycled paper products, will be crucial for sustained growth. Expansion into new markets and strategic partnerships will further enhance market position. The industry's long-term prospects remain positive, as consumer demand for environmentally responsible products continues to rise.
Recovered Paper Industry Segmentation
-
1. Type
- 1.1. Printing and Writing Paper
- 1.2. Newsprint
- 1.3. Tissue
- 1.4. Containerboard
- 1.5. Other Types
Recovered Paper Industry Segmentation By Geography
- 1. North America
- 2. Europe
- 3. Asia Pacific
- 4. Latin America
- 5. Middle East and Africa

Recovered Paper Industry REPORT HIGHLIGHTS
| Aspects | Details |
|---|---|
| Study Period | 2019-2033 |
| Base Year | 2024 |
| Estimated Year | 2025 |
| Forecast Period | 2025-2033 |
| Historical Period | 2019-2024 |
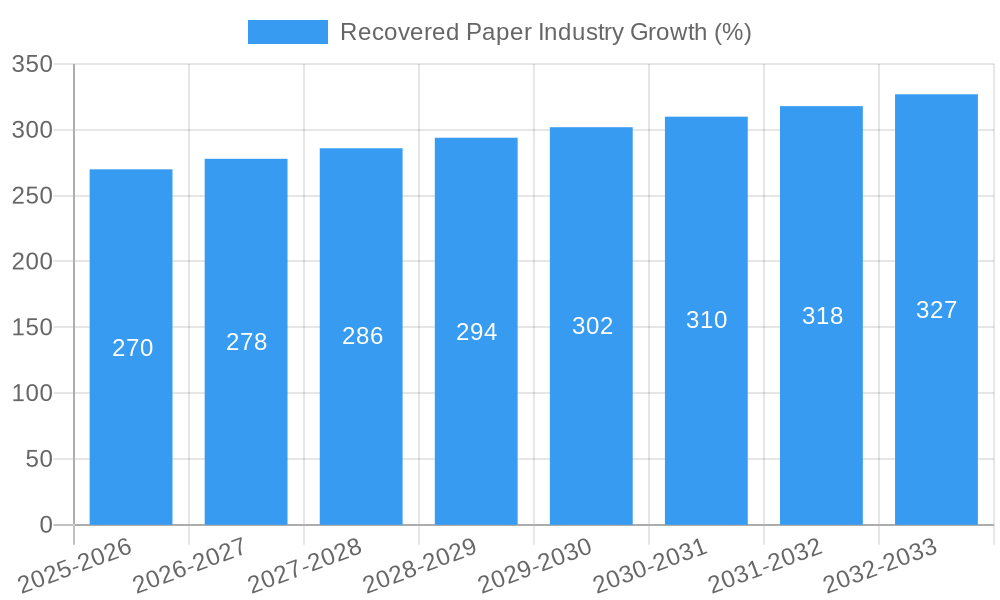
| Growth Rate | CAGR of 2.70% from 2019-2033 |
| Segmentation |
|
Table of Contents
- 1. Introduction
- 1.1. Research Scope
- 1.2. Market Segmentation
- 1.3. Research Methodology
- 1.4. Definitions and Assumptions
- 2. Executive Summary
- 2.1. Introduction
- 3. Market Dynamics
- 3.1. Introduction
- 3.2. Market Drivers
- 3.2.1. Growth in E-commerce Sales in China; Rising Demand from the Food-service Sector; Growing Consumer Awareness on Paper Packaging; Recycling Initiatives Involving Closed-loop Systems to Aid Market Adoption of Paper Packaging-based Materials
- 3.3. Market Restrains
- 3.3.1 Recycling
- 3.3.2 Raw Material Supply Chain Management
- 3.3.3 and Challenges in the Paper Packaging Industry; Effects of Deforestation on Paper Packaging; Increasing Raw Material Costs and Outsourcing
- 3.4. Market Trends
- 3.4.1. Containerboard to Dominate the Market
- 4. Market Factor Analysis
- 4.1. Porters Five Forces
- 4.2. Supply/Value Chain
- 4.3. PESTEL analysis
- 4.4. Market Entropy
- 4.5. Patent/Trademark Analysis
- 5. Global Recovered Paper Industry Analysis, Insights and Forecast, 2019-2031
- 5.1. Market Analysis, Insights and Forecast - by Type
- 5.1.1. Printing and Writing Paper
- 5.1.2. Newsprint
- 5.1.3. Tissue
- 5.1.4. Containerboard
- 5.1.5. Other Types
- 5.2. Market Analysis, Insights and Forecast - by Region
- 5.2.1. North America
- 5.2.2. Europe
- 5.2.3. Asia Pacific
- 5.2.4. Latin America
- 5.2.5. Middle East and Africa
- 5.1. Market Analysis, Insights and Forecast - by Type
- 6. North America Recovered Paper Industry Analysis, Insights and Forecast, 2019-2031
- 6.1. Market Analysis, Insights and Forecast - by Type
- 6.1.1. Printing and Writing Paper
- 6.1.2. Newsprint
- 6.1.3. Tissue
- 6.1.4. Containerboard
- 6.1.5. Other Types
- 6.1. Market Analysis, Insights and Forecast - by Type
- 7. Europe Recovered Paper Industry Analysis, Insights and Forecast, 2019-2031
- 7.1. Market Analysis, Insights and Forecast - by Type
- 7.1.1. Printing and Writing Paper
- 7.1.2. Newsprint
- 7.1.3. Tissue
- 7.1.4. Containerboard
- 7.1.5. Other Types
- 7.1. Market Analysis, Insights and Forecast - by Type
- 8. Asia Pacific Recovered Paper Industry Analysis, Insights and Forecast, 2019-2031
- 8.1. Market Analysis, Insights and Forecast - by Type
- 8.1.1. Printing and Writing Paper
- 8.1.2. Newsprint
- 8.1.3. Tissue
- 8.1.4. Containerboard
- 8.1.5. Other Types
- 8.1. Market Analysis, Insights and Forecast - by Type
- 9. Latin America Recovered Paper Industry Analysis, Insights and Forecast, 2019-2031
- 9.1. Market Analysis, Insights and Forecast - by Type
- 9.1.1. Printing and Writing Paper
- 9.1.2. Newsprint
- 9.1.3. Tissue
- 9.1.4. Containerboard
- 9.1.5. Other Types
- 9.1. Market Analysis, Insights and Forecast - by Type
- 10. Middle East and Africa Recovered Paper Industry Analysis, Insights and Forecast, 2019-2031
- 10.1. Market Analysis, Insights and Forecast - by Type
- 10.1.1. Printing and Writing Paper
- 10.1.2. Newsprint
- 10.1.3. Tissue
- 10.1.4. Containerboard
- 10.1.5. Other Types
- 10.1. Market Analysis, Insights and Forecast - by Type
- 11. North America Recovered Paper Industry Analysis, Insights and Forecast, 2019-2031
- 11.1. Market Analysis, Insights and Forecast - By Country/Sub-region
- 11.1.1 United States
- 11.1.2 Canada
- 11.1.3 Mexico
- 12. Europe Recovered Paper Industry Analysis, Insights and Forecast, 2019-2031
- 12.1. Market Analysis, Insights and Forecast - By Country/Sub-region
- 12.1.1 Germany
- 12.1.2 United Kingdom
- 12.1.3 France
- 12.1.4 Spain
- 12.1.5 Italy
- 12.1.6 Spain
- 12.1.7 Belgium
- 12.1.8 Netherland
- 12.1.9 Nordics
- 12.1.10 Rest of Europe
- 13. Asia Pacific Recovered Paper Industry Analysis, Insights and Forecast, 2019-2031
- 13.1. Market Analysis, Insights and Forecast - By Country/Sub-region
- 13.1.1 China
- 13.1.2 Japan
- 13.1.3 India
- 13.1.4 South Korea
- 13.1.5 Southeast Asia
- 13.1.6 Australia
- 13.1.7 Indonesia
- 13.1.8 Phillipes
- 13.1.9 Singapore
- 13.1.10 Thailandc
- 13.1.11 Rest of Asia Pacific
- 14. South America Recovered Paper Industry Analysis, Insights and Forecast, 2019-2031
- 14.1. Market Analysis, Insights and Forecast - By Country/Sub-region
- 14.1.1 Brazil
- 14.1.2 Argentina
- 14.1.3 Peru
- 14.1.4 Chile
- 14.1.5 Colombia
- 14.1.6 Ecuador
- 14.1.7 Venezuela
- 14.1.8 Rest of South America
- 15. North America Recovered Paper Industry Analysis, Insights and Forecast, 2019-2031
- 15.1. Market Analysis, Insights and Forecast - By Country/Sub-region
- 15.1.1 United States
- 15.1.2 Canada
- 15.1.3 Mexico
- 16. MEA Recovered Paper Industry Analysis, Insights and Forecast, 2019-2031
- 16.1. Market Analysis, Insights and Forecast - By Country/Sub-region
- 16.1.1 United Arab Emirates
- 16.1.2 Saudi Arabia
- 16.1.3 South Africa
- 16.1.4 Rest of Middle East and Africa
- 17. Competitive Analysis
- 17.1. Global Market Share Analysis 2024
- 17.2. Company Profiles
- 17.2.1 International Paper
- 17.2.1.1. Overview
- 17.2.1.2. Products
- 17.2.1.3. SWOT Analysis
- 17.2.1.4. Recent Developments
- 17.2.1.5. Financials (Based on Availability)
- 17.2.2 Tay Paper Recycling Pte Ltd
- 17.2.2.1. Overview
- 17.2.2.2. Products
- 17.2.2.3. SWOT Analysis
- 17.2.2.4. Recent Developments
- 17.2.2.5. Financials (Based on Availability)
- 17.2.3 Smurfit Kappa Group plc
- 17.2.3.1. Overview
- 17.2.3.2. Products
- 17.2.3.3. SWOT Analysis
- 17.2.3.4. Recent Developments
- 17.2.3.5. Financials (Based on Availability)
- 17.2.4 Nine Dragons Paper (Holdings) Limited
- 17.2.4.1. Overview
- 17.2.4.2. Products
- 17.2.4.3. SWOT Analysis
- 17.2.4.4. Recent Developments
- 17.2.4.5. Financials (Based on Availability)
- 17.2.5 Stora Enso Oyj
- 17.2.5.1. Overview
- 17.2.5.2. Products
- 17.2.5.3. SWOT Analysis
- 17.2.5.4. Recent Developments
- 17.2.5.5. Financials (Based on Availability)
- 17.2.6 S A Industrias Celulosa Aragonesa (SAICA)
- 17.2.6.1. Overview
- 17.2.6.2. Products
- 17.2.6.3. SWOT Analysis
- 17.2.6.4. Recent Developments
- 17.2.6.5. Financials (Based on Availability)
- 17.2.7 Visy Industrie
- 17.2.7.1. Overview
- 17.2.7.2. Products
- 17.2.7.3. SWOT Analysis
- 17.2.7.4. Recent Developments
- 17.2.7.5. Financials (Based on Availability)
- 17.2.8 DS Smith Plc
- 17.2.8.1. Overview
- 17.2.8.2. Products
- 17.2.8.3. SWOT Analysis
- 17.2.8.4. Recent Developments
- 17.2.8.5. Financials (Based on Availability)
- 17.2.1 International Paper
List of Figures
- Figure 1: Global Recovered Paper Industry Revenue Breakdown (Million, %) by Region 2024 & 2032
- Figure 2: North America Recovered Paper Industry Revenue (Million), by Country 2024 & 2032
- Figure 3: North America Recovered Paper Industry Revenue Share (%), by Country 2024 & 2032
- Figure 4: Europe Recovered Paper Industry Revenue (Million), by Country 2024 & 2032
- Figure 5: Europe Recovered Paper Industry Revenue Share (%), by Country 2024 & 2032
- Figure 6: Asia Pacific Recovered Paper Industry Revenue (Million), by Country 2024 & 2032
- Figure 7: Asia Pacific Recovered Paper Industry Revenue Share (%), by Country 2024 & 2032
- Figure 8: South America Recovered Paper Industry Revenue (Million), by Country 2024 & 2032
- Figure 9: South America Recovered Paper Industry Revenue Share (%), by Country 2024 & 2032
- Figure 10: North America Recovered Paper Industry Revenue (Million), by Country 2024 & 2032
- Figure 11: North America Recovered Paper Industry Revenue Share (%), by Country 2024 & 2032
- Figure 12: MEA Recovered Paper Industry Revenue (Million), by Country 2024 & 2032
- Figure 13: MEA Recovered Paper Industry Revenue Share (%), by Country 2024 & 2032
- Figure 14: North America Recovered Paper Industry Revenue (Million), by Type 2024 & 2032
- Figure 15: North America Recovered Paper Industry Revenue Share (%), by Type 2024 & 2032
- Figure 16: North America Recovered Paper Industry Revenue (Million), by Country 2024 & 2032
- Figure 17: North America Recovered Paper Industry Revenue Share (%), by Country 2024 & 2032
- Figure 18: Europe Recovered Paper Industry Revenue (Million), by Type 2024 & 2032
- Figure 19: Europe Recovered Paper Industry Revenue Share (%), by Type 2024 & 2032
- Figure 20: Europe Recovered Paper Industry Revenue (Million), by Country 2024 & 2032
- Figure 21: Europe Recovered Paper Industry Revenue Share (%), by Country 2024 & 2032
- Figure 22: Asia Pacific Recovered Paper Industry Revenue (Million), by Type 2024 & 2032
- Figure 23: Asia Pacific Recovered Paper Industry Revenue Share (%), by Type 2024 & 2032
- Figure 24: Asia Pacific Recovered Paper Industry Revenue (Million), by Country 2024 & 2032
- Figure 25: Asia Pacific Recovered Paper Industry Revenue Share (%), by Country 2024 & 2032
- Figure 26: Latin America Recovered Paper Industry Revenue (Million), by Type 2024 & 2032
- Figure 27: Latin America Recovered Paper Industry Revenue Share (%), by Type 2024 & 2032
- Figure 28: Latin America Recovered Paper Industry Revenue (Million), by Country 2024 & 2032
- Figure 29: Latin America Recovered Paper Industry Revenue Share (%), by Country 2024 & 2032
- Figure 30: Middle East and Africa Recovered Paper Industry Revenue (Million), by Type 2024 & 2032
- Figure 31: Middle East and Africa Recovered Paper Industry Revenue Share (%), by Type 2024 & 2032
- Figure 32: Middle East and Africa Recovered Paper Industry Revenue (Million), by Country 2024 & 2032
- Figure 33: Middle East and Africa Recovered Paper Industry Revenue Share (%), by Country 2024 & 2032
List of Tables
- Table 1: Global Recovered Paper Industry Revenue Million Forecast, by Region 2019 & 2032
- Table 2: Global Recovered Paper Industry Revenue Million Forecast, by Type 2019 & 2032
- Table 3: Global Recovered Paper Industry Revenue Million Forecast, by Region 2019 & 2032
- Table 4: Global Recovered Paper Industry Revenue Million Forecast, by Country 2019 & 2032
- Table 5: United States Recovered Paper Industry Revenue (Million) Forecast, by Application 2019 & 2032
- Table 6: Canada Recovered Paper Industry Revenue (Million) Forecast, by Application 2019 & 2032
- Table 7: Mexico Recovered Paper Industry Revenue (Million) Forecast, by Application 2019 & 2032
- Table 8: Global Recovered Paper Industry Revenue Million Forecast, by Country 2019 & 2032
- Table 9: Germany Recovered Paper Industry Revenue (Million) Forecast, by Application 2019 & 2032
- Table 10: United Kingdom Recovered Paper Industry Revenue (Million) Forecast, by Application 2019 & 2032
- Table 11: France Recovered Paper Industry Revenue (Million) Forecast, by Application 2019 & 2032
- Table 12: Spain Recovered Paper Industry Revenue (Million) Forecast, by Application 2019 & 2032
- Table 13: Italy Recovered Paper Industry Revenue (Million) Forecast, by Application 2019 & 2032
- Table 14: Spain Recovered Paper Industry Revenue (Million) Forecast, by Application 2019 & 2032
- Table 15: Belgium Recovered Paper Industry Revenue (Million) Forecast, by Application 2019 & 2032
- Table 16: Netherland Recovered Paper Industry Revenue (Million) Forecast, by Application 2019 & 2032
- Table 17: Nordics Recovered Paper Industry Revenue (Million) Forecast, by Application 2019 & 2032
- Table 18: Rest of Europe Recovered Paper Industry Revenue (Million) Forecast, by Application 2019 & 2032
- Table 19: Global Recovered Paper Industry Revenue Million Forecast, by Country 2019 & 2032
- Table 20: China Recovered Paper Industry Revenue (Million) Forecast, by Application 2019 & 2032
- Table 21: Japan Recovered Paper Industry Revenue (Million) Forecast, by Application 2019 & 2032
- Table 22: India Recovered Paper Industry Revenue (Million) Forecast, by Application 2019 & 2032
- Table 23: South Korea Recovered Paper Industry Revenue (Million) Forecast, by Application 2019 & 2032
- Table 24: Southeast Asia Recovered Paper Industry Revenue (Million) Forecast, by Application 2019 & 2032
- Table 25: Australia Recovered Paper Industry Revenue (Million) Forecast, by Application 2019 & 2032
- Table 26: Indonesia Recovered Paper Industry Revenue (Million) Forecast, by Application 2019 & 2032
- Table 27: Phillipes Recovered Paper Industry Revenue (Million) Forecast, by Application 2019 & 2032
- Table 28: Singapore Recovered Paper Industry Revenue (Million) Forecast, by Application 2019 & 2032
- Table 29: Thailandc Recovered Paper Industry Revenue (Million) Forecast, by Application 2019 & 2032
- Table 30: Rest of Asia Pacific Recovered Paper Industry Revenue (Million) Forecast, by Application 2019 & 2032
- Table 31: Global Recovered Paper Industry Revenue Million Forecast, by Country 2019 & 2032
- Table 32: Brazil Recovered Paper Industry Revenue (Million) Forecast, by Application 2019 & 2032
- Table 33: Argentina Recovered Paper Industry Revenue (Million) Forecast, by Application 2019 & 2032
- Table 34: Peru Recovered Paper Industry Revenue (Million) Forecast, by Application 2019 & 2032
- Table 35: Chile Recovered Paper Industry Revenue (Million) Forecast, by Application 2019 & 2032
- Table 36: Colombia Recovered Paper Industry Revenue (Million) Forecast, by Application 2019 & 2032
- Table 37: Ecuador Recovered Paper Industry Revenue (Million) Forecast, by Application 2019 & 2032
- Table 38: Venezuela Recovered Paper Industry Revenue (Million) Forecast, by Application 2019 & 2032
- Table 39: Rest of South America Recovered Paper Industry Revenue (Million) Forecast, by Application 2019 & 2032
- Table 40: Global Recovered Paper Industry Revenue Million Forecast, by Country 2019 & 2032
- Table 41: United States Recovered Paper Industry Revenue (Million) Forecast, by Application 2019 & 2032
- Table 42: Canada Recovered Paper Industry Revenue (Million) Forecast, by Application 2019 & 2032
- Table 43: Mexico Recovered Paper Industry Revenue (Million) Forecast, by Application 2019 & 2032
- Table 44: Global Recovered Paper Industry Revenue Million Forecast, by Country 2019 & 2032
- Table 45: United Arab Emirates Recovered Paper Industry Revenue (Million) Forecast, by Application 2019 & 2032
- Table 46: Saudi Arabia Recovered Paper Industry Revenue (Million) Forecast, by Application 2019 & 2032
- Table 47: South Africa Recovered Paper Industry Revenue (Million) Forecast, by Application 2019 & 2032
- Table 48: Rest of Middle East and Africa Recovered Paper Industry Revenue (Million) Forecast, by Application 2019 & 2032
- Table 49: Global Recovered Paper Industry Revenue Million Forecast, by Type 2019 & 2032
- Table 50: Global Recovered Paper Industry Revenue Million Forecast, by Country 2019 & 2032
- Table 51: Global Recovered Paper Industry Revenue Million Forecast, by Type 2019 & 2032
- Table 52: Global Recovered Paper Industry Revenue Million Forecast, by Country 2019 & 2032
- Table 53: Global Recovered Paper Industry Revenue Million Forecast, by Type 2019 & 2032
- Table 54: Global Recovered Paper Industry Revenue Million Forecast, by Country 2019 & 2032
- Table 55: Global Recovered Paper Industry Revenue Million Forecast, by Type 2019 & 2032
- Table 56: Global Recovered Paper Industry Revenue Million Forecast, by Country 2019 & 2032
- Table 57: Global Recovered Paper Industry Revenue Million Forecast, by Type 2019 & 2032
- Table 58: Global Recovered Paper Industry Revenue Million Forecast, by Country 2019 & 2032
Frequently Asked Questions
1. What is the projected Compound Annual Growth Rate (CAGR) of the Recovered Paper Industry?
The projected CAGR is approximately 2.70%.
2. Which companies are prominent players in the Recovered Paper Industry?
Key companies in the market include International Paper, Tay Paper Recycling Pte Ltd, Smurfit Kappa Group plc, Nine Dragons Paper (Holdings) Limited, Stora Enso Oyj, S A Industrias Celulosa Aragonesa (SAICA), Visy Industrie, DS Smith Plc.
3. What are the main segments of the Recovered Paper Industry?
The market segments include Type.
4. Can you provide details about the market size?
The market size is estimated to be USD XX Million as of 2022.
5. What are some drivers contributing to market growth?
Growth in E-commerce Sales in China; Rising Demand from the Food-service Sector; Growing Consumer Awareness on Paper Packaging; Recycling Initiatives Involving Closed-loop Systems to Aid Market Adoption of Paper Packaging-based Materials.
6. What are the notable trends driving market growth?
Containerboard to Dominate the Market.
7. Are there any restraints impacting market growth?
Recycling. Raw Material Supply Chain Management. and Challenges in the Paper Packaging Industry; Effects of Deforestation on Paper Packaging; Increasing Raw Material Costs and Outsourcing.
8. Can you provide examples of recent developments in the market?
N/A
9. What pricing options are available for accessing the report?
Pricing options include single-user, multi-user, and enterprise licenses priced at USD 4750, USD 5250, and USD 8750 respectively.
10. Is the market size provided in terms of value or volume?
The market size is provided in terms of value, measured in Million.
11. Are there any specific market keywords associated with the report?
Yes, the market keyword associated with the report is "Recovered Paper Industry," which aids in identifying and referencing the specific market segment covered.
12. How do I determine which pricing option suits my needs best?
The pricing options vary based on user requirements and access needs. Individual users may opt for single-user licenses, while businesses requiring broader access may choose multi-user or enterprise licenses for cost-effective access to the report.
13. Are there any additional resources or data provided in the Recovered Paper Industry report?
While the report offers comprehensive insights, it's advisable to review the specific contents or supplementary materials provided to ascertain if additional resources or data are available.
14. How can I stay updated on further developments or reports in the Recovered Paper Industry?
To stay informed about further developments, trends, and reports in the Recovered Paper Industry, consider subscribing to industry newsletters, following relevant companies and organizations, or regularly checking reputable industry news sources and publications.
Methodology
Step 1 - Identification of Relevant Samples Size from Population Database


Step 2 - Approaches for Defining Global Market Size (Value, Volume* & Price*)

Note*: In applicable scenarios
Step 3 - Data Sources
Primary Research
- Web Analytics
- Survey Reports
- Research Institute
- Latest Research Reports
- Opinion Leaders
Secondary Research
- Annual Reports
- White Paper
- Latest Press Release
- Industry Association
- Paid Database
- Investor Presentations

Step 4 - Data Triangulation
Involves using different sources of information in order to increase the validity of a study
These sources are likely to be stakeholders in a program - participants, other researchers, program staff, other community members, and so on.
Then we put all data in single framework & apply various statistical tools to find out the dynamic on the market.
During the analysis stage, feedback from the stakeholder groups would be compared to determine areas of agreement as well as areas of divergence


