


Key Insights
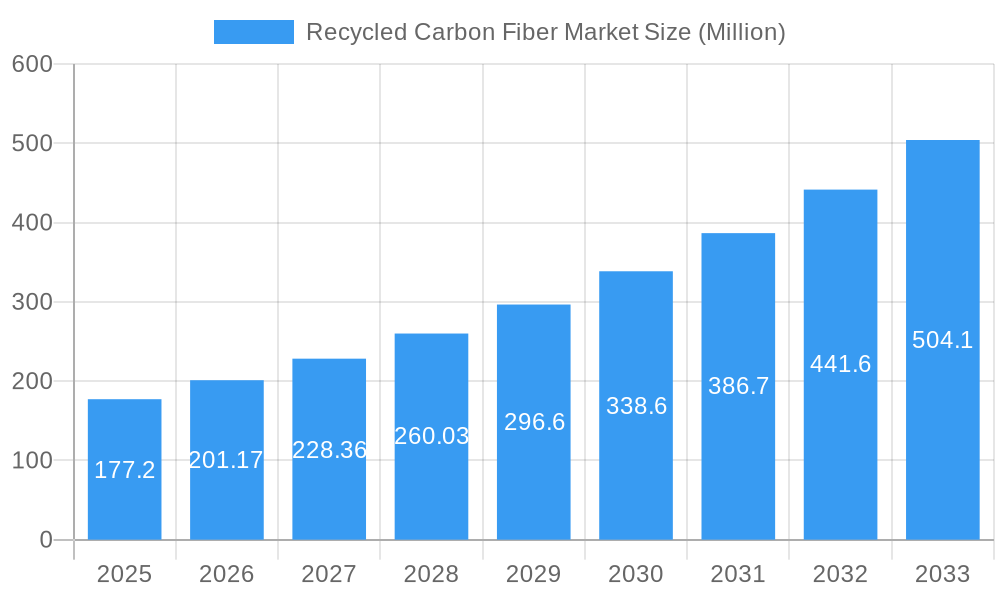
The recycled carbon fiber market is experiencing robust growth, projected to reach a value of $177.20 million in 2025 and exhibiting a Compound Annual Growth Rate (CAGR) of 13.65% from 2025 to 2033. This expansion is fueled by several key drivers. Increasing environmental concerns and regulations regarding plastic waste are pushing manufacturers towards sustainable alternatives, making recycled carbon fiber an attractive option. The automotive industry, a significant consumer of carbon fiber, is adopting recycled materials to reduce its environmental footprint and lower production costs. The aerospace and defense sectors, demanding high-performance materials with reduced weight, are also showing increased interest in this sustainable solution. Furthermore, growing demand from the wind energy and sporting goods industries further contributes to market expansion. The market is segmented by fiber type (chopped and milled), source material (automotive, aerospace, and other scraps), and end-user industry, each segment experiencing varied growth rates depending on the specific application and material availability. The North American region currently holds a significant market share, driven by strong automotive and aerospace sectors, but the Asia-Pacific region is poised for rapid growth due to increasing manufacturing and renewable energy investments.

Recycled Carbon Fiber Market Market Size (In Million)

Competition within the recycled carbon fiber market is intensifying with established players such as Toray Industries and Mitsubishi Chemical Holdings Corporation alongside emerging companies like Vartega Inc and Gen 2 Carbon Limited. These companies are focusing on technological advancements to improve the quality and consistency of recycled carbon fiber, making it more competitive with virgin materials. While challenges such as the variability of recycled feedstock and the need for efficient sorting and processing technologies remain, ongoing research and development efforts are addressing these issues. The overall market outlook remains positive, with continued growth driven by increased environmental awareness, stringent environmental regulations, and the inherent performance advantages of carbon fiber in diverse applications. This trajectory suggests significant opportunities for market participants to capitalize on the growing demand for sustainable and high-performance materials.
Recycled Carbon Fiber Market Company Market Share
Recycled Carbon Fiber Market: A Comprehensive Report (2019-2033)
This in-depth report provides a comprehensive analysis of the Recycled Carbon Fiber market, offering invaluable insights for industry stakeholders, investors, and strategic decision-makers. Covering the period from 2019 to 2033, with a focus on 2025, this report meticulously examines market trends, segment performance, competitive dynamics, and future growth potential. The study incorporates detailed analysis of market concentration, innovation, dominant segments, product developments, and key challenges, alongside an examination of emerging opportunities and leading players. This report is designed for immediate use and requires no further modification.
Recycled Carbon Fiber Market Concentration & Innovation
The Recycled Carbon Fiber market exhibits a moderately concentrated landscape, with several key players vying for market share. While precise market share figures for each company are proprietary, the market is characterized by both established players like Toray Industries Inc and Mitsubishi Chemical Holdings Corporation, and emerging innovators such as Vartega Inc and Gen 2 Carbon Limited. The report analyzes the competitive intensity, utilizing metrics like market share estimations and M&A deal values (estimated at xx Million for the period 2019-2024). Innovation is a key driver, with companies continuously improving recycling technologies to enhance the quality and cost-effectiveness of recycled carbon fiber. Regulatory frameworks focused on sustainability are also pushing innovation and adoption. The existence of product substitutes, primarily virgin carbon fiber, presents a challenge, but the increasing focus on environmental sustainability is creating a favorable environment for recycled carbon fiber. End-user trends, particularly in the automotive and aerospace sectors, indicate a growing preference for sustainable materials, further fueling market growth. M&A activities are expected to increase as larger players seek to consolidate their position and acquire innovative technologies.
- Key Players: Toray Industries Inc, Mitsubishi Chemical Holdings Corporation, Vartega Inc, Gen 2 Carbon Limited, Sigmatex, Carbon Conversions, Procotex, Shocker Composites LLC, Alpha Recyclage Composites, Carbon Fiber Remanufacturing, Carbon Fiber Recycling, Karborek RCF (List not exhaustive).
- Innovation Drivers: Sustainability regulations, advancements in recycling technologies, growing demand for sustainable materials in key end-use sectors.
- M&A Activity: Estimated at xx Million in deal value (2019-2024), with projections of increased activity in the forecast period.
Recycled Carbon Fiber Market Industry Trends & Insights
The Recycled Carbon Fiber market is experiencing robust growth, driven by increasing demand for sustainable materials and advancements in recycling technologies. The market’s Compound Annual Growth Rate (CAGR) is estimated at xx% during the forecast period (2025-2033). Technological disruptions, particularly in chemical recycling processes, are enhancing the quality and properties of recycled carbon fiber, making it increasingly competitive with virgin carbon fiber. Consumer preferences are shifting towards eco-friendly products, benefiting recycled carbon fiber’s market penetration. Competitive dynamics are characterized by a mix of established players and emerging innovators, fostering innovation and price competitiveness. Market penetration is expected to increase significantly in the forecast period, driven by growing awareness of environmental concerns and the development of high-performance recycled carbon fiber products.
Dominant Markets & Segments in Recycled Carbon Fiber Market
The Automotive segment currently holds the largest market share in the Recycled Carbon Fiber market, driven by the increasing adoption of lightweight materials to improve fuel efficiency and reduce emissions. The Aerospace and Defense sector is also showing significant growth potential due to stringent regulatory requirements and a focus on reducing the environmental footprint of aerospace manufacturing.
- Dominant Region: North America is currently the leading region, with Europe and Asia-Pacific showing strong growth potential.
- Dominant Type: Chopped Recycled Carbon Fiber currently holds a larger market share than Milled Recycled Carbon Fiber.
- Dominant Source: Automotive Scrap is the primary source of recycled carbon fiber.
- Key Drivers (Automotive Segment): Stringent emission regulations, increasing demand for lightweight vehicles, and the growing adoption of recycled materials.
- Key Drivers (Aerospace & Defense Segment): Regulations promoting sustainability, high demand for lightweight and durable materials, and cost reduction efforts.
- Detailed Dominance Analysis: The dominance of the Automotive segment is linked to high vehicle production volumes and the relatively high content of carbon fiber in some vehicle components. The Aerospace and Defense segment demonstrates strong growth potential due to specific weight requirements and life cycle cost considerations.
Recycled Carbon Fiber Market Product Developments
Recent advancements in recycling technologies have led to the development of high-quality recycled carbon fiber that meets the performance requirements of demanding applications. These innovations have broadened the applications of recycled carbon fiber, expanding beyond its traditional use in automotive and aerospace applications into other sectors such as sporting goods and wind energy. This improved quality and expanded application range have fostered significant competitive advantages for manufacturers who invest in advanced recycling technologies. The market is witnessing a transition towards more sustainable and economically viable recycling methods.
Report Scope & Segmentation Analysis
This report segments the Recycled Carbon Fiber market based on type (Chopped Recycled Carbon Fiber, Milled Recycled Carbon Fiber), source (Automotive Scrap, Aerospace Scrap, Other Sources), and end-user industry (Automotive, Aerospace and Defense, Wind Energy, Sporting Goods, Other End-user Industries). Each segment's growth projections, market sizes, and competitive dynamics are thoroughly analyzed. The report provides detailed market size estimations (in Million) for each segment across the historical, base, and forecast periods. The competitive dynamics within each segment are shaped by the interplay of established players and emerging innovators.
Key Drivers of Recycled Carbon Fiber Market Growth
The Recycled Carbon Fiber market's growth is primarily driven by increasing environmental concerns, leading to stricter regulations on waste disposal and the promotion of sustainable materials. The automotive and aerospace industries are key drivers, seeking lighter and more sustainable materials. Advancements in recycling technologies are enhancing the quality and reducing the cost of recycled carbon fiber, making it more competitive with virgin carbon fiber. Government incentives and subsidies are further encouraging the adoption of recycled carbon fiber.
Challenges in the Recycled Carbon Fiber Market Sector
Challenges facing the Recycled Carbon Fiber market include the relatively high cost of recycling compared to using virgin carbon fiber, inconsistencies in the quality of recycled material, and a lack of standardized quality control measures across the industry. Supply chain complexities and the need for efficient collection and sorting of carbon fiber scrap also pose significant hurdles. Competitive pressures from virgin carbon fiber manufacturers and the need to scale up recycling capacity represent further obstacles to widespread adoption. The fluctuating prices of raw materials also impact market growth.
Emerging Opportunities in Recycled Carbon Fiber Market
Emerging opportunities exist in expanding applications of recycled carbon fiber into new sectors such as construction and infrastructure. Advancements in recycling technologies, especially chemical recycling, offer potential for higher-quality recycled fiber. Developing partnerships and collaborations within the industry can enhance innovation and efficiency. Furthermore, growing consumer awareness of sustainable materials presents significant market opportunities.
Leading Players in the Recycled Carbon Fiber Market
- Sigmatex
- Carbon Conversions
- Procotex
- Shocker Composites LLC
- Toray Industries Inc
- Alpha Recyclage Composites
- Carbon Fiber Remanufacturing
- Carbon Fiber Recycling
- Mitsubishi Chemical Holdings Corporation
- Gen 2 Carbon Limited
- Vartega Inc
- Karborek RCF (List not exhaustive)
Key Developments in Recycled Carbon Fiber Market Industry
- August 2022: Vartega announced the expansion of its 50,000-square-foot manufacturing facility with a planned capacity of 2,000 metric tons per year, representing a tenfold increase in production capacity. This significantly expands the market supply and strengthens Vartega’s market position.
- May 2022: Gen 2 Carbon Limited established a strategic alliance with Deakin University to promote carbon fiber recycling in Australia. This collaboration enhances recycling technology and expands the company's market reach.
Strategic Outlook for Recycled Carbon Fiber Market
The Recycled Carbon Fiber market exhibits significant growth potential driven by increasing environmental awareness, technological advancements, and supportive government policies. Future market growth will depend on continued innovation in recycling technologies, improved cost-effectiveness, and expansion into new applications and markets. Strategic partnerships and collaborations are key to accelerating market development and realizing the full potential of recycled carbon fiber as a sustainable alternative to virgin carbon fiber. The increasing demand for sustainable and high-performance materials across various industries is poised to drive considerable market expansion in the coming years.
Recycled Carbon Fiber Market Segmentation
-
1. Type
- 1.1. Chopped Recycled Carbon Fiber
- 1.2. Milled Recycled Carbon Fiber
-
2. Source
- 2.1. Automotive Scrap
- 2.2. Aerospace Scrap
- 2.3. Other Sources
-
3. End-user Industry
- 3.1. Automotive
- 3.2. Aerospace and Defense
- 3.3. Wind Energy
- 3.4. Sporting Goods
- 3.5. Other End-user Industries
Recycled Carbon Fiber Market Segmentation By Geography
-
1. Asia Pacific
- 1.1. China
- 1.2. India
- 1.3. Japan
- 1.4. South Korea
- 1.5. Rest of Asia Pacific
-
2. North America
- 2.1. United States
- 2.2. Canada
- 2.3. Mexico
-
3. Europe
- 3.1. Germany
- 3.2. United Kingdom
- 3.3. Italy
- 3.4. France
- 3.5. Rest of Europe
-
4. Rest of the World
- 4.1. South America
- 4.2. Middle East and Africa

Recycled Carbon Fiber Market Regional Market Share
Geographic Coverage of Recycled Carbon Fiber Market
Recycled Carbon Fiber Market REPORT HIGHLIGHTS
| Aspects | Details |
|---|---|
| Study Period | 2020-2034 |
| Base Year | 2025 |
| Estimated Year | 2026 |
| Forecast Period | 2026-2034 |
| Historical Period | 2020-2025 |
| Growth Rate | CAGR of 13.65% from 2020-2034 |
| Segmentation |
|
Table of Contents
- 1. Introduction
- 1.1. Research Scope
- 1.2. Market Segmentation
- 1.3. Research Methodology
- 1.4. Definitions and Assumptions
- 2. Executive Summary
- 2.1. Introduction
- 3. Market Dynamics
- 3.1. Introduction
- 3.2. Market Drivers
- 3.2.1. Rising Demand For Lightweight Vehicles; Growing Carbon Fiber Scrap Recycling and its Reuse in the Wind Energy Sector; Cost Effectiveness of Recycled Carbon Fiber
- 3.3. Market Restrains
- 3.3.1. Availability of Various Substitutes; Supply Chain Security for Recycled Carbon Fiber
- 3.4. Market Trends
- 3.4.1. Increasing Usage in the Aerospace and Defense Industry
- 4. Market Factor Analysis
- 4.1. Porters Five Forces
- 4.2. Supply/Value Chain
- 4.3. PESTEL analysis
- 4.4. Market Entropy
- 4.5. Patent/Trademark Analysis
- 5. Global Recycled Carbon Fiber Market Analysis, Insights and Forecast, 2020-2032
- 5.1. Market Analysis, Insights and Forecast - by Type
- 5.1.1. Chopped Recycled Carbon Fiber
- 5.1.2. Milled Recycled Carbon Fiber
- 5.2. Market Analysis, Insights and Forecast - by Source
- 5.2.1. Automotive Scrap
- 5.2.2. Aerospace Scrap
- 5.2.3. Other Sources
- 5.3. Market Analysis, Insights and Forecast - by End-user Industry
- 5.3.1. Automotive
- 5.3.2. Aerospace and Defense
- 5.3.3. Wind Energy
- 5.3.4. Sporting Goods
- 5.3.5. Other End-user Industries
- 5.4. Market Analysis, Insights and Forecast - by Region
- 5.4.1. Asia Pacific
- 5.4.2. North America
- 5.4.3. Europe
- 5.4.4. Rest of the World
- 5.1. Market Analysis, Insights and Forecast - by Type
- 6. Asia Pacific Recycled Carbon Fiber Market Analysis, Insights and Forecast, 2020-2032
- 6.1. Market Analysis, Insights and Forecast - by Type
- 6.1.1. Chopped Recycled Carbon Fiber
- 6.1.2. Milled Recycled Carbon Fiber
- 6.2. Market Analysis, Insights and Forecast - by Source
- 6.2.1. Automotive Scrap
- 6.2.2. Aerospace Scrap
- 6.2.3. Other Sources
- 6.3. Market Analysis, Insights and Forecast - by End-user Industry
- 6.3.1. Automotive
- 6.3.2. Aerospace and Defense
- 6.3.3. Wind Energy
- 6.3.4. Sporting Goods
- 6.3.5. Other End-user Industries
- 6.1. Market Analysis, Insights and Forecast - by Type
- 7. North America Recycled Carbon Fiber Market Analysis, Insights and Forecast, 2020-2032
- 7.1. Market Analysis, Insights and Forecast - by Type
- 7.1.1. Chopped Recycled Carbon Fiber
- 7.1.2. Milled Recycled Carbon Fiber
- 7.2. Market Analysis, Insights and Forecast - by Source
- 7.2.1. Automotive Scrap
- 7.2.2. Aerospace Scrap
- 7.2.3. Other Sources
- 7.3. Market Analysis, Insights and Forecast - by End-user Industry
- 7.3.1. Automotive
- 7.3.2. Aerospace and Defense
- 7.3.3. Wind Energy
- 7.3.4. Sporting Goods
- 7.3.5. Other End-user Industries
- 7.1. Market Analysis, Insights and Forecast - by Type
- 8. Europe Recycled Carbon Fiber Market Analysis, Insights and Forecast, 2020-2032
- 8.1. Market Analysis, Insights and Forecast - by Type
- 8.1.1. Chopped Recycled Carbon Fiber
- 8.1.2. Milled Recycled Carbon Fiber
- 8.2. Market Analysis, Insights and Forecast - by Source
- 8.2.1. Automotive Scrap
- 8.2.2. Aerospace Scrap
- 8.2.3. Other Sources
- 8.3. Market Analysis, Insights and Forecast - by End-user Industry
- 8.3.1. Automotive
- 8.3.2. Aerospace and Defense
- 8.3.3. Wind Energy
- 8.3.4. Sporting Goods
- 8.3.5. Other End-user Industries
- 8.1. Market Analysis, Insights and Forecast - by Type
- 9. Rest of the World Recycled Carbon Fiber Market Analysis, Insights and Forecast, 2020-2032
- 9.1. Market Analysis, Insights and Forecast - by Type
- 9.1.1. Chopped Recycled Carbon Fiber
- 9.1.2. Milled Recycled Carbon Fiber
- 9.2. Market Analysis, Insights and Forecast - by Source
- 9.2.1. Automotive Scrap
- 9.2.2. Aerospace Scrap
- 9.2.3. Other Sources
- 9.3. Market Analysis, Insights and Forecast - by End-user Industry
- 9.3.1. Automotive
- 9.3.2. Aerospace and Defense
- 9.3.3. Wind Energy
- 9.3.4. Sporting Goods
- 9.3.5. Other End-user Industries
- 9.1. Market Analysis, Insights and Forecast - by Type
- 10. Competitive Analysis
- 10.1. Global Market Share Analysis 2025
- 10.2. Company Profiles
- 10.2.1 Sigmatex
- 10.2.1.1. Overview
- 10.2.1.2. Products
- 10.2.1.3. SWOT Analysis
- 10.2.1.4. Recent Developments
- 10.2.1.5. Financials (Based on Availability)
- 10.2.2 Carbon Conversions
- 10.2.2.1. Overview
- 10.2.2.2. Products
- 10.2.2.3. SWOT Analysis
- 10.2.2.4. Recent Developments
- 10.2.2.5. Financials (Based on Availability)
- 10.2.3 Procotex
- 10.2.3.1. Overview
- 10.2.3.2. Products
- 10.2.3.3. SWOT Analysis
- 10.2.3.4. Recent Developments
- 10.2.3.5. Financials (Based on Availability)
- 10.2.4 Shocker Composites LLC
- 10.2.4.1. Overview
- 10.2.4.2. Products
- 10.2.4.3. SWOT Analysis
- 10.2.4.4. Recent Developments
- 10.2.4.5. Financials (Based on Availability)
- 10.2.5 Toray Industries Inc
- 10.2.5.1. Overview
- 10.2.5.2. Products
- 10.2.5.3. SWOT Analysis
- 10.2.5.4. Recent Developments
- 10.2.5.5. Financials (Based on Availability)
- 10.2.6 Alpha Recyclage Composites
- 10.2.6.1. Overview
- 10.2.6.2. Products
- 10.2.6.3. SWOT Analysis
- 10.2.6.4. Recent Developments
- 10.2.6.5. Financials (Based on Availability)
- 10.2.7 Carbon Fiber Remanufacturing
- 10.2.7.1. Overview
- 10.2.7.2. Products
- 10.2.7.3. SWOT Analysis
- 10.2.7.4. Recent Developments
- 10.2.7.5. Financials (Based on Availability)
- 10.2.8 Carbon Fiber Recycling
- 10.2.8.1. Overview
- 10.2.8.2. Products
- 10.2.8.3. SWOT Analysis
- 10.2.8.4. Recent Developments
- 10.2.8.5. Financials (Based on Availability)
- 10.2.9 Mitsubishi Chemical Holdings Corporation
- 10.2.9.1. Overview
- 10.2.9.2. Products
- 10.2.9.3. SWOT Analysis
- 10.2.9.4. Recent Developments
- 10.2.9.5. Financials (Based on Availability)
- 10.2.10 Gen 2 Carbon Limited
- 10.2.10.1. Overview
- 10.2.10.2. Products
- 10.2.10.3. SWOT Analysis
- 10.2.10.4. Recent Developments
- 10.2.10.5. Financials (Based on Availability)
- 10.2.11 Vartega Inc *List Not Exhaustive
- 10.2.11.1. Overview
- 10.2.11.2. Products
- 10.2.11.3. SWOT Analysis
- 10.2.11.4. Recent Developments
- 10.2.11.5. Financials (Based on Availability)
- 10.2.12 Karborek RCF
- 10.2.12.1. Overview
- 10.2.12.2. Products
- 10.2.12.3. SWOT Analysis
- 10.2.12.4. Recent Developments
- 10.2.12.5. Financials (Based on Availability)
- 10.2.1 Sigmatex
List of Figures
- Figure 1: Global Recycled Carbon Fiber Market Revenue Breakdown (Million, %) by Region 2025 & 2033
- Figure 2: Global Recycled Carbon Fiber Market Volume Breakdown (K Tons, %) by Region 2025 & 2033
- Figure 3: Asia Pacific Recycled Carbon Fiber Market Revenue (Million), by Type 2025 & 2033
- Figure 4: Asia Pacific Recycled Carbon Fiber Market Volume (K Tons), by Type 2025 & 2033
- Figure 5: Asia Pacific Recycled Carbon Fiber Market Revenue Share (%), by Type 2025 & 2033
- Figure 6: Asia Pacific Recycled Carbon Fiber Market Volume Share (%), by Type 2025 & 2033
- Figure 7: Asia Pacific Recycled Carbon Fiber Market Revenue (Million), by Source 2025 & 2033
- Figure 8: Asia Pacific Recycled Carbon Fiber Market Volume (K Tons), by Source 2025 & 2033
- Figure 9: Asia Pacific Recycled Carbon Fiber Market Revenue Share (%), by Source 2025 & 2033
- Figure 10: Asia Pacific Recycled Carbon Fiber Market Volume Share (%), by Source 2025 & 2033
- Figure 11: Asia Pacific Recycled Carbon Fiber Market Revenue (Million), by End-user Industry 2025 & 2033
- Figure 12: Asia Pacific Recycled Carbon Fiber Market Volume (K Tons), by End-user Industry 2025 & 2033
- Figure 13: Asia Pacific Recycled Carbon Fiber Market Revenue Share (%), by End-user Industry 2025 & 2033
- Figure 14: Asia Pacific Recycled Carbon Fiber Market Volume Share (%), by End-user Industry 2025 & 2033
- Figure 15: Asia Pacific Recycled Carbon Fiber Market Revenue (Million), by Country 2025 & 2033
- Figure 16: Asia Pacific Recycled Carbon Fiber Market Volume (K Tons), by Country 2025 & 2033
- Figure 17: Asia Pacific Recycled Carbon Fiber Market Revenue Share (%), by Country 2025 & 2033
- Figure 18: Asia Pacific Recycled Carbon Fiber Market Volume Share (%), by Country 2025 & 2033
- Figure 19: North America Recycled Carbon Fiber Market Revenue (Million), by Type 2025 & 2033
- Figure 20: North America Recycled Carbon Fiber Market Volume (K Tons), by Type 2025 & 2033
- Figure 21: North America Recycled Carbon Fiber Market Revenue Share (%), by Type 2025 & 2033
- Figure 22: North America Recycled Carbon Fiber Market Volume Share (%), by Type 2025 & 2033
- Figure 23: North America Recycled Carbon Fiber Market Revenue (Million), by Source 2025 & 2033
- Figure 24: North America Recycled Carbon Fiber Market Volume (K Tons), by Source 2025 & 2033
- Figure 25: North America Recycled Carbon Fiber Market Revenue Share (%), by Source 2025 & 2033
- Figure 26: North America Recycled Carbon Fiber Market Volume Share (%), by Source 2025 & 2033
- Figure 27: North America Recycled Carbon Fiber Market Revenue (Million), by End-user Industry 2025 & 2033
- Figure 28: North America Recycled Carbon Fiber Market Volume (K Tons), by End-user Industry 2025 & 2033
- Figure 29: North America Recycled Carbon Fiber Market Revenue Share (%), by End-user Industry 2025 & 2033
- Figure 30: North America Recycled Carbon Fiber Market Volume Share (%), by End-user Industry 2025 & 2033
- Figure 31: North America Recycled Carbon Fiber Market Revenue (Million), by Country 2025 & 2033
- Figure 32: North America Recycled Carbon Fiber Market Volume (K Tons), by Country 2025 & 2033
- Figure 33: North America Recycled Carbon Fiber Market Revenue Share (%), by Country 2025 & 2033
- Figure 34: North America Recycled Carbon Fiber Market Volume Share (%), by Country 2025 & 2033
- Figure 35: Europe Recycled Carbon Fiber Market Revenue (Million), by Type 2025 & 2033
- Figure 36: Europe Recycled Carbon Fiber Market Volume (K Tons), by Type 2025 & 2033
- Figure 37: Europe Recycled Carbon Fiber Market Revenue Share (%), by Type 2025 & 2033
- Figure 38: Europe Recycled Carbon Fiber Market Volume Share (%), by Type 2025 & 2033
- Figure 39: Europe Recycled Carbon Fiber Market Revenue (Million), by Source 2025 & 2033
- Figure 40: Europe Recycled Carbon Fiber Market Volume (K Tons), by Source 2025 & 2033
- Figure 41: Europe Recycled Carbon Fiber Market Revenue Share (%), by Source 2025 & 2033
- Figure 42: Europe Recycled Carbon Fiber Market Volume Share (%), by Source 2025 & 2033
- Figure 43: Europe Recycled Carbon Fiber Market Revenue (Million), by End-user Industry 2025 & 2033
- Figure 44: Europe Recycled Carbon Fiber Market Volume (K Tons), by End-user Industry 2025 & 2033
- Figure 45: Europe Recycled Carbon Fiber Market Revenue Share (%), by End-user Industry 2025 & 2033
- Figure 46: Europe Recycled Carbon Fiber Market Volume Share (%), by End-user Industry 2025 & 2033
- Figure 47: Europe Recycled Carbon Fiber Market Revenue (Million), by Country 2025 & 2033
- Figure 48: Europe Recycled Carbon Fiber Market Volume (K Tons), by Country 2025 & 2033
- Figure 49: Europe Recycled Carbon Fiber Market Revenue Share (%), by Country 2025 & 2033
- Figure 50: Europe Recycled Carbon Fiber Market Volume Share (%), by Country 2025 & 2033
- Figure 51: Rest of the World Recycled Carbon Fiber Market Revenue (Million), by Type 2025 & 2033
- Figure 52: Rest of the World Recycled Carbon Fiber Market Volume (K Tons), by Type 2025 & 2033
- Figure 53: Rest of the World Recycled Carbon Fiber Market Revenue Share (%), by Type 2025 & 2033
- Figure 54: Rest of the World Recycled Carbon Fiber Market Volume Share (%), by Type 2025 & 2033
- Figure 55: Rest of the World Recycled Carbon Fiber Market Revenue (Million), by Source 2025 & 2033
- Figure 56: Rest of the World Recycled Carbon Fiber Market Volume (K Tons), by Source 2025 & 2033
- Figure 57: Rest of the World Recycled Carbon Fiber Market Revenue Share (%), by Source 2025 & 2033
- Figure 58: Rest of the World Recycled Carbon Fiber Market Volume Share (%), by Source 2025 & 2033
- Figure 59: Rest of the World Recycled Carbon Fiber Market Revenue (Million), by End-user Industry 2025 & 2033
- Figure 60: Rest of the World Recycled Carbon Fiber Market Volume (K Tons), by End-user Industry 2025 & 2033
- Figure 61: Rest of the World Recycled Carbon Fiber Market Revenue Share (%), by End-user Industry 2025 & 2033
- Figure 62: Rest of the World Recycled Carbon Fiber Market Volume Share (%), by End-user Industry 2025 & 2033
- Figure 63: Rest of the World Recycled Carbon Fiber Market Revenue (Million), by Country 2025 & 2033
- Figure 64: Rest of the World Recycled Carbon Fiber Market Volume (K Tons), by Country 2025 & 2033
- Figure 65: Rest of the World Recycled Carbon Fiber Market Revenue Share (%), by Country 2025 & 2033
- Figure 66: Rest of the World Recycled Carbon Fiber Market Volume Share (%), by Country 2025 & 2033
List of Tables
- Table 1: Global Recycled Carbon Fiber Market Revenue Million Forecast, by Type 2020 & 2033
- Table 2: Global Recycled Carbon Fiber Market Volume K Tons Forecast, by Type 2020 & 2033
- Table 3: Global Recycled Carbon Fiber Market Revenue Million Forecast, by Source 2020 & 2033
- Table 4: Global Recycled Carbon Fiber Market Volume K Tons Forecast, by Source 2020 & 2033
- Table 5: Global Recycled Carbon Fiber Market Revenue Million Forecast, by End-user Industry 2020 & 2033
- Table 6: Global Recycled Carbon Fiber Market Volume K Tons Forecast, by End-user Industry 2020 & 2033
- Table 7: Global Recycled Carbon Fiber Market Revenue Million Forecast, by Region 2020 & 2033
- Table 8: Global Recycled Carbon Fiber Market Volume K Tons Forecast, by Region 2020 & 2033
- Table 9: Global Recycled Carbon Fiber Market Revenue Million Forecast, by Type 2020 & 2033
- Table 10: Global Recycled Carbon Fiber Market Volume K Tons Forecast, by Type 2020 & 2033
- Table 11: Global Recycled Carbon Fiber Market Revenue Million Forecast, by Source 2020 & 2033
- Table 12: Global Recycled Carbon Fiber Market Volume K Tons Forecast, by Source 2020 & 2033
- Table 13: Global Recycled Carbon Fiber Market Revenue Million Forecast, by End-user Industry 2020 & 2033
- Table 14: Global Recycled Carbon Fiber Market Volume K Tons Forecast, by End-user Industry 2020 & 2033
- Table 15: Global Recycled Carbon Fiber Market Revenue Million Forecast, by Country 2020 & 2033
- Table 16: Global Recycled Carbon Fiber Market Volume K Tons Forecast, by Country 2020 & 2033
- Table 17: China Recycled Carbon Fiber Market Revenue (Million) Forecast, by Application 2020 & 2033
- Table 18: China Recycled Carbon Fiber Market Volume (K Tons) Forecast, by Application 2020 & 2033
- Table 19: India Recycled Carbon Fiber Market Revenue (Million) Forecast, by Application 2020 & 2033
- Table 20: India Recycled Carbon Fiber Market Volume (K Tons) Forecast, by Application 2020 & 2033
- Table 21: Japan Recycled Carbon Fiber Market Revenue (Million) Forecast, by Application 2020 & 2033
- Table 22: Japan Recycled Carbon Fiber Market Volume (K Tons) Forecast, by Application 2020 & 2033
- Table 23: South Korea Recycled Carbon Fiber Market Revenue (Million) Forecast, by Application 2020 & 2033
- Table 24: South Korea Recycled Carbon Fiber Market Volume (K Tons) Forecast, by Application 2020 & 2033
- Table 25: Rest of Asia Pacific Recycled Carbon Fiber Market Revenue (Million) Forecast, by Application 2020 & 2033
- Table 26: Rest of Asia Pacific Recycled Carbon Fiber Market Volume (K Tons) Forecast, by Application 2020 & 2033
- Table 27: Global Recycled Carbon Fiber Market Revenue Million Forecast, by Type 2020 & 2033
- Table 28: Global Recycled Carbon Fiber Market Volume K Tons Forecast, by Type 2020 & 2033
- Table 29: Global Recycled Carbon Fiber Market Revenue Million Forecast, by Source 2020 & 2033
- Table 30: Global Recycled Carbon Fiber Market Volume K Tons Forecast, by Source 2020 & 2033
- Table 31: Global Recycled Carbon Fiber Market Revenue Million Forecast, by End-user Industry 2020 & 2033
- Table 32: Global Recycled Carbon Fiber Market Volume K Tons Forecast, by End-user Industry 2020 & 2033
- Table 33: Global Recycled Carbon Fiber Market Revenue Million Forecast, by Country 2020 & 2033
- Table 34: Global Recycled Carbon Fiber Market Volume K Tons Forecast, by Country 2020 & 2033
- Table 35: United States Recycled Carbon Fiber Market Revenue (Million) Forecast, by Application 2020 & 2033
- Table 36: United States Recycled Carbon Fiber Market Volume (K Tons) Forecast, by Application 2020 & 2033
- Table 37: Canada Recycled Carbon Fiber Market Revenue (Million) Forecast, by Application 2020 & 2033
- Table 38: Canada Recycled Carbon Fiber Market Volume (K Tons) Forecast, by Application 2020 & 2033
- Table 39: Mexico Recycled Carbon Fiber Market Revenue (Million) Forecast, by Application 2020 & 2033
- Table 40: Mexico Recycled Carbon Fiber Market Volume (K Tons) Forecast, by Application 2020 & 2033
- Table 41: Global Recycled Carbon Fiber Market Revenue Million Forecast, by Type 2020 & 2033
- Table 42: Global Recycled Carbon Fiber Market Volume K Tons Forecast, by Type 2020 & 2033
- Table 43: Global Recycled Carbon Fiber Market Revenue Million Forecast, by Source 2020 & 2033
- Table 44: Global Recycled Carbon Fiber Market Volume K Tons Forecast, by Source 2020 & 2033
- Table 45: Global Recycled Carbon Fiber Market Revenue Million Forecast, by End-user Industry 2020 & 2033
- Table 46: Global Recycled Carbon Fiber Market Volume K Tons Forecast, by End-user Industry 2020 & 2033
- Table 47: Global Recycled Carbon Fiber Market Revenue Million Forecast, by Country 2020 & 2033
- Table 48: Global Recycled Carbon Fiber Market Volume K Tons Forecast, by Country 2020 & 2033
- Table 49: Germany Recycled Carbon Fiber Market Revenue (Million) Forecast, by Application 2020 & 2033
- Table 50: Germany Recycled Carbon Fiber Market Volume (K Tons) Forecast, by Application 2020 & 2033
- Table 51: United Kingdom Recycled Carbon Fiber Market Revenue (Million) Forecast, by Application 2020 & 2033
- Table 52: United Kingdom Recycled Carbon Fiber Market Volume (K Tons) Forecast, by Application 2020 & 2033
- Table 53: Italy Recycled Carbon Fiber Market Revenue (Million) Forecast, by Application 2020 & 2033
- Table 54: Italy Recycled Carbon Fiber Market Volume (K Tons) Forecast, by Application 2020 & 2033
- Table 55: France Recycled Carbon Fiber Market Revenue (Million) Forecast, by Application 2020 & 2033
- Table 56: France Recycled Carbon Fiber Market Volume (K Tons) Forecast, by Application 2020 & 2033
- Table 57: Rest of Europe Recycled Carbon Fiber Market Revenue (Million) Forecast, by Application 2020 & 2033
- Table 58: Rest of Europe Recycled Carbon Fiber Market Volume (K Tons) Forecast, by Application 2020 & 2033
- Table 59: Global Recycled Carbon Fiber Market Revenue Million Forecast, by Type 2020 & 2033
- Table 60: Global Recycled Carbon Fiber Market Volume K Tons Forecast, by Type 2020 & 2033
- Table 61: Global Recycled Carbon Fiber Market Revenue Million Forecast, by Source 2020 & 2033
- Table 62: Global Recycled Carbon Fiber Market Volume K Tons Forecast, by Source 2020 & 2033
- Table 63: Global Recycled Carbon Fiber Market Revenue Million Forecast, by End-user Industry 2020 & 2033
- Table 64: Global Recycled Carbon Fiber Market Volume K Tons Forecast, by End-user Industry 2020 & 2033
- Table 65: Global Recycled Carbon Fiber Market Revenue Million Forecast, by Country 2020 & 2033
- Table 66: Global Recycled Carbon Fiber Market Volume K Tons Forecast, by Country 2020 & 2033
- Table 67: South America Recycled Carbon Fiber Market Revenue (Million) Forecast, by Application 2020 & 2033
- Table 68: South America Recycled Carbon Fiber Market Volume (K Tons) Forecast, by Application 2020 & 2033
- Table 69: Middle East and Africa Recycled Carbon Fiber Market Revenue (Million) Forecast, by Application 2020 & 2033
- Table 70: Middle East and Africa Recycled Carbon Fiber Market Volume (K Tons) Forecast, by Application 2020 & 2033
Frequently Asked Questions
1. What is the projected Compound Annual Growth Rate (CAGR) of the Recycled Carbon Fiber Market?
The projected CAGR is approximately 13.65%.
2. Which companies are prominent players in the Recycled Carbon Fiber Market?
Key companies in the market include Sigmatex, Carbon Conversions, Procotex, Shocker Composites LLC, Toray Industries Inc, Alpha Recyclage Composites, Carbon Fiber Remanufacturing, Carbon Fiber Recycling, Mitsubishi Chemical Holdings Corporation, Gen 2 Carbon Limited, Vartega Inc *List Not Exhaustive, Karborek RCF.
3. What are the main segments of the Recycled Carbon Fiber Market?
The market segments include Type, Source, End-user Industry.
4. Can you provide details about the market size?
The market size is estimated to be USD 177.20 Million as of 2022.
5. What are some drivers contributing to market growth?
Rising Demand For Lightweight Vehicles; Growing Carbon Fiber Scrap Recycling and its Reuse in the Wind Energy Sector; Cost Effectiveness of Recycled Carbon Fiber.
6. What are the notable trends driving market growth?
Increasing Usage in the Aerospace and Defense Industry.
7. Are there any restraints impacting market growth?
Availability of Various Substitutes; Supply Chain Security for Recycled Carbon Fiber.
8. Can you provide examples of recent developments in the market?
August 2022: Vartega announced the expansion of its 50,000-square-foot manufacturing facility with a planned capacity of 2,000 metric tons per year. The company has expanded its production capacity ten times more than the previous capacity.
9. What pricing options are available for accessing the report?
Pricing options include single-user, multi-user, and enterprise licenses priced at USD 4750, USD 5250, and USD 8750 respectively.
10. Is the market size provided in terms of value or volume?
The market size is provided in terms of value, measured in Million and volume, measured in K Tons.
11. Are there any specific market keywords associated with the report?
Yes, the market keyword associated with the report is "Recycled Carbon Fiber Market," which aids in identifying and referencing the specific market segment covered.
12. How do I determine which pricing option suits my needs best?
The pricing options vary based on user requirements and access needs. Individual users may opt for single-user licenses, while businesses requiring broader access may choose multi-user or enterprise licenses for cost-effective access to the report.
13. Are there any additional resources or data provided in the Recycled Carbon Fiber Market report?
While the report offers comprehensive insights, it's advisable to review the specific contents or supplementary materials provided to ascertain if additional resources or data are available.
14. How can I stay updated on further developments or reports in the Recycled Carbon Fiber Market?
To stay informed about further developments, trends, and reports in the Recycled Carbon Fiber Market, consider subscribing to industry newsletters, following relevant companies and organizations, or regularly checking reputable industry news sources and publications.
Methodology
Step 1 - Identification of Relevant Samples Size from Population Database


Step 2 - Approaches for Defining Global Market Size (Value, Volume* & Price*)

Note*: In applicable scenarios
Step 3 - Data Sources
Primary Research
- Web Analytics
- Survey Reports
- Research Institute
- Latest Research Reports
- Opinion Leaders
Secondary Research
- Annual Reports
- White Paper
- Latest Press Release
- Industry Association
- Paid Database
- Investor Presentations

Step 4 - Data Triangulation
Involves using different sources of information in order to increase the validity of a study
These sources are likely to be stakeholders in a program - participants, other researchers, program staff, other community members, and so on.
Then we put all data in single framework & apply various statistical tools to find out the dynamic on the market.
During the analysis stage, feedback from the stakeholder groups would be compared to determine areas of agreement as well as areas of divergence