
Key Insights
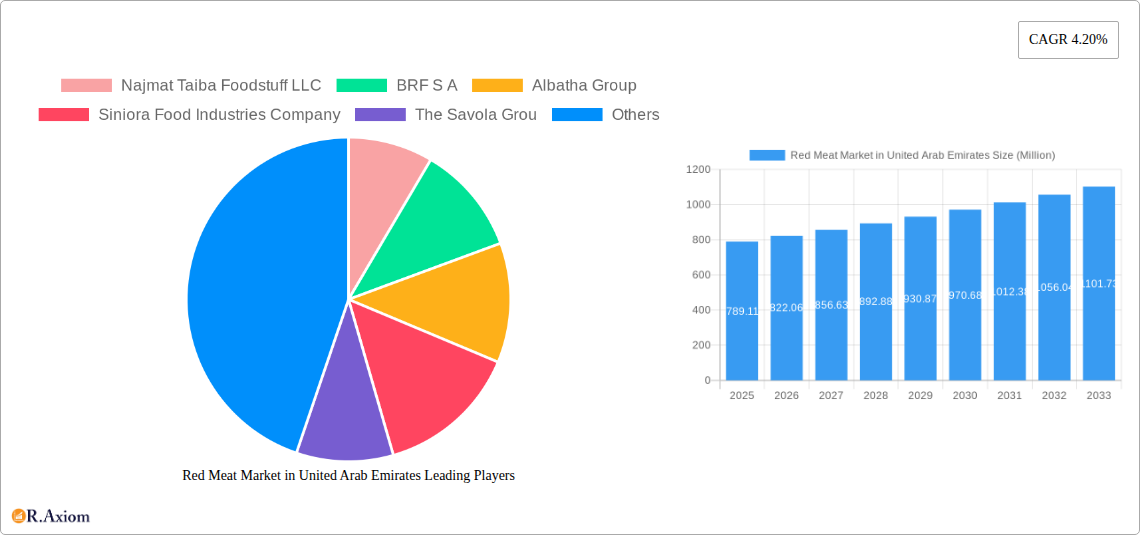
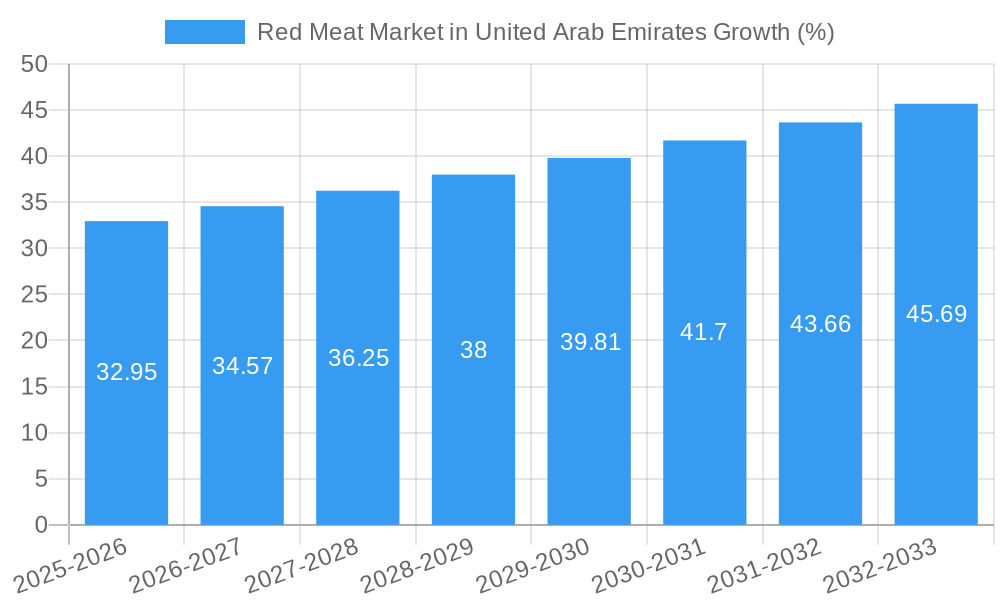
The United Arab Emirates (UAE) red meat market, valued at approximately $789.11 million in 2025, is projected to experience steady growth with a Compound Annual Growth Rate (CAGR) of 4.20% from 2025 to 2033. This growth is fueled by several key factors. The UAE's burgeoning population, characterized by a significant expatriate community with diverse dietary preferences, creates a consistently high demand for red meat. Furthermore, rising disposable incomes and a preference for convenience contribute to the increased consumption of processed and readily available red meat products. The robust food service sector, including restaurants and hotels catering to both local and tourist populations, also significantly bolsters market demand. While potential restraints such as fluctuating global meat prices and concerns about health and sustainability could impact growth, the UAE's strong economic fundamentals and strategic investments in its food security infrastructure are expected to mitigate these challenges. The market is segmented by distribution channel (off-trade dominating, followed by on-trade), type (beef holding the largest share, followed by mutton and other meats), and form (fresh/chilled most popular, followed by frozen and processed). Major players like Najmat Taiba Foodstuff LLC, BRF S.A., and Albatha Group compete in this dynamic market, focusing on product diversification and supply chain optimization to capture increasing market share.
The distribution channels within the UAE red meat market showcase a clear preference for off-trade channels (supermarkets, hypermarkets etc.), reflecting consumer convenience and preference for self-service options. The product type segment demonstrates a strong preference for beef, likely driven by cultural preferences and culinary traditions. However, increasing health awareness might see a gradual shift towards leaner alternatives within the mutton and other meat categories. Within the form segment, fresh/chilled products dominate, suggesting a consumer preference for high-quality, fresh options. However, the processed and frozen segments are also anticipated to experience significant growth due to increasing convenience factors, particularly among younger demographics. The geographic distribution within the UAE itself will likely concentrate in major urban centers with higher population densities, and successful market players will be those that effectively meet the diverse demands of these segments.
Red Meat Market in United Arab Emirates: A Comprehensive Report (2019-2033)
This comprehensive report provides a detailed analysis of the Red Meat Market in the United Arab Emirates, covering the period 2019-2033. It offers invaluable insights into market dynamics, competitive landscape, and future growth potential, enabling stakeholders to make informed strategic decisions. The report leverages extensive data analysis and incorporates key industry developments to provide a holistic view of the market. The total market size is estimated at xx Million in 2025, with a projected CAGR of xx% during the forecast period (2025-2033).
Red Meat Market in United Arab Emirates Market Concentration & Innovation
The UAE red meat market exhibits a moderately concentrated structure, with a few major players holding significant market share. Najmat Taiba Foodstuff LLC, Albatha Group, and Siniora Food Industries Company are among the key players, collectively accounting for an estimated xx% of the market in 2024. However, the market also accommodates numerous smaller players, particularly in the fresh/chilled segment. Innovation is driven by consumer demand for high-quality, convenient, and ethically sourced products. This has led to advancements in processing techniques, packaging, and product diversification, including value-added offerings like marinated meats and ready-to-cook options. The regulatory framework focuses on food safety and hygiene standards, impacting product development and distribution. Substitute products like poultry and plant-based alternatives pose a competitive threat, albeit with limited market penetration currently. End-user trends favor convenience and health-consciousness, influencing packaging and product formats. M&A activities remain relatively low in the past few years but are expected to increase as companies seek to expand their market share and product portfolio. While specific M&A deal values are unavailable, several minor acquisitions have been reported in the historical period; the projected value for the forecast period is xx Million.
Red Meat Market in United Arab Emirates Industry Trends & Insights
The UAE red meat market is experiencing steady growth, driven by factors such as a rising population, increasing disposable incomes, and changing consumer preferences. The market witnessed a CAGR of xx% during the historical period (2019-2024), exceeding the growth of other protein sources. Technological disruptions, such as advancements in cold chain logistics and improved processing technologies, are enhancing product quality and shelf life. Consumer preferences are shifting towards healthier and more convenient options, leading to increased demand for lean cuts, value-added products, and ready-to-cook meals. The competitive landscape is characterized by both local and international players, leading to intense competition based on price, quality, and branding. Market penetration of processed meat products is high, whilst the penetration of organic and sustainably sourced red meat remains relatively low with an estimated xx% in 2024.
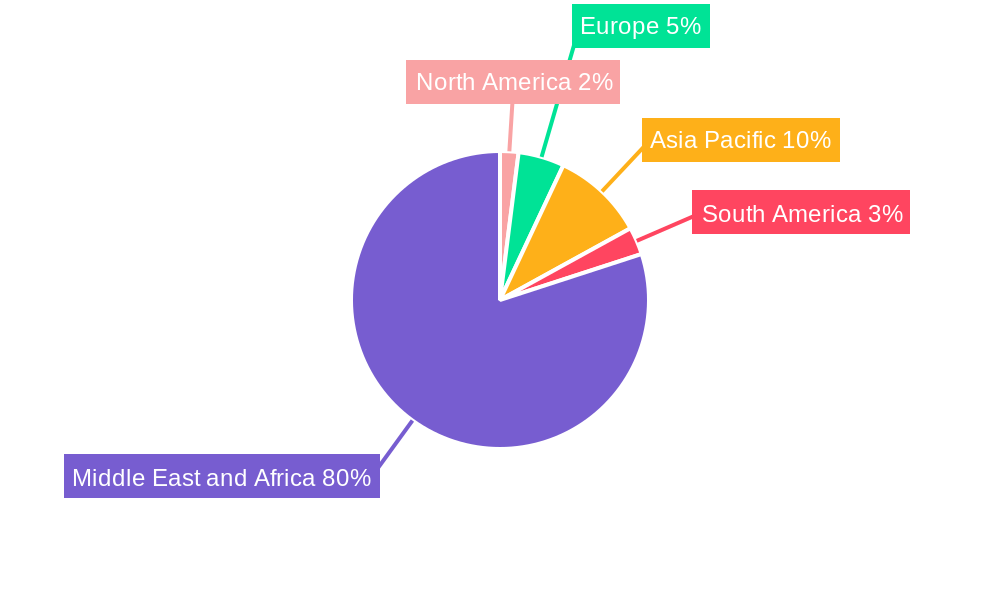
Dominant Markets & Segments in Red Meat Market in United Arab Emirates
- Dominant Distribution Channel: The off-trade channel (supermarkets, hypermarkets, butchers) accounts for the largest market share, driven by increased retail penetration and convenience.
- Dominant Meat Type: Beef holds the largest market share, reflecting strong consumer preference and cultural factors.
- Dominant Form: Fresh/chilled meat dominates due to its preference for freshness and superior taste.
The dominance of these segments is attributed to several key drivers:
- Economic Policies: Government initiatives aimed at promoting food security and diversification influence market growth.
- Infrastructure: Well-developed cold chain infrastructure supports the distribution and availability of fresh/chilled meat products.
- Consumer Preferences: A strong preference for fresh, high-quality beef drives market demand.
The off-trade channel benefits from increasing retail penetration and consumer preference for convenient shopping, while beef's popularity is rooted in culinary traditions and cultural preferences. The prevalence of fresh/chilled meat reflects the consumer demand for quality and perceived freshness.
Red Meat Market in United Arab Emirates Product Developments
Recent product innovations focus on enhancing convenience, quality, and health attributes. Value-added products such as marinated meats and ready-to-cook options are gaining popularity. Technological advancements in processing, packaging, and cold chain logistics are improving shelf life and enhancing product appeal. These innovations cater to the evolving consumer preferences for convenient and healthier meat options, increasing their market fit.
Report Scope & Segmentation Analysis
This report segments the UAE red meat market across several key parameters:
Distribution Channel: Off-Trade (supermarkets, hypermarkets, butchers) and On-Trade (restaurants, hotels). The off-trade segment is projected to grow at a CAGR of xx% during the forecast period.
Meat Type: Beef, Mutton, and Other Meat (lamb, goat). The beef segment holds the largest share and is expected to continue its dominance.
Form: Canned, Fresh/Chilled, Frozen, and Processed. The fresh/chilled segment holds the largest share and is driven by consumer preference.
Each segment exhibits distinct growth trajectories and competitive dynamics, shaped by consumer preferences, technological advancements, and regulatory changes.
Key Drivers of Red Meat Market in United Arab Emirates Growth
Several factors drive the growth of the UAE red meat market: a growing population and rising disposable incomes fuel demand; evolving consumer preferences toward convenience and health-conscious options are shaping product innovation; and government initiatives supporting food security and sustainable agriculture enhance production and supply.
Challenges in the Red Meat Market in United Arab Emirates Sector
The UAE red meat market faces challenges such as fluctuating global prices, potential supply chain disruptions, and competition from poultry and alternative protein sources. Regulatory compliance and food safety standards also pose a challenge to operators. The impact of these challenges is estimated to impact the market growth by xx% cumulatively during the forecast period.
Emerging Opportunities in Red Meat Market in United Arab Emirates
Growing demand for organic and sustainably sourced red meat presents significant opportunities. Furthermore, the increasing adoption of innovative packaging and processing technologies opens up avenues for improved product quality and shelf life. There is also potential growth in the development of value-added products, such as ready-to-cook meals. Moreover, opportunities exist in exploring alternative distribution channels such as online retail and direct-to-consumer models.
Leading Players in the Red Meat Market in United Arab Emirates Market
- Najmat Taiba Foodstuff LLC
- BRF S A
- Albatha Group
- Siniora Food Industries Company
- The Savola Group
- JBS SA
- Tanmiah Food Company
- Freshly Frozen Foods Factory LLC
Key Developments in Red Meat Market in United Arab Emirates Industry
- July 2022: Tanmiah Food Company and Tyson Foods entered a strategic partnership to expand meat production capacity, signifying increased investment in the Middle East's protein market.
- February 2023: Tanmiah Food Company and Tyson Foods renewed their partnership, highlighting their commitment to growth opportunities in the region.
- December 2021: Tanmiah Food Company's diversification into the quick-service restaurant sector through a partnership with Popeyes underscores the industry's evolving value chain.
Strategic Outlook for Red Meat Market in United Arab Emirates Market
The UAE red meat market is poised for continued growth, driven by robust demand and ongoing investments in infrastructure and technology. Opportunities abound in value-added products, sustainable sourcing, and innovative distribution models. Companies that adapt to changing consumer preferences and embrace sustainable practices are best positioned to succeed in this dynamic market.
Red Meat Market in United Arab Emirates Segmentation
-
1. Type
- 1.1. Beef
- 1.2. Mutton
- 1.3. Other Meat
-
2. Form
- 2.1. Canned
- 2.2. Fresh / Chilled
- 2.3. Frozen
- 2.4. Processed
-
3. Distribution Channel
-
3.1. Off-Trade
- 3.1.1. Convenience Stores
- 3.1.2. Online Channel
- 3.1.3. Supermarkets and Hypermarkets
- 3.1.4. Others
- 3.2. On-Trade
-
3.1. Off-Trade
Red Meat Market in United Arab Emirates Segmentation By Geography
-
1. North America
- 1.1. United States
- 1.2. Canada
- 1.3. Mexico
-
2. South America
- 2.1. Brazil
- 2.2. Argentina
- 2.3. Rest of South America
-
3. Europe
- 3.1. United Kingdom
- 3.2. Germany
- 3.3. France
- 3.4. Italy
- 3.5. Spain
- 3.6. Russia
- 3.7. Benelux
- 3.8. Nordics
- 3.9. Rest of Europe
-
4. Middle East & Africa
- 4.1. Turkey
- 4.2. Israel
- 4.3. GCC
- 4.4. North Africa
- 4.5. South Africa
- 4.6. Rest of Middle East & Africa
-
5. Asia Pacific
- 5.1. China
- 5.2. India
- 5.3. Japan
- 5.4. South Korea
- 5.5. ASEAN
- 5.6. Oceania
- 5.7. Rest of Asia Pacific
Red Meat Market in United Arab Emirates REPORT HIGHLIGHTS
| Aspects | Details |
|---|---|
| Study Period | 2019-2033 |
| Base Year | 2024 |
| Estimated Year | 2025 |
| Forecast Period | 2025-2033 |
| Historical Period | 2019-2024 |
| Growth Rate | CAGR of 4.20% from 2019-2033 |
| Segmentation |
|
Table of Contents
- 1. Introduction
- 1.1. Research Scope
- 1.2. Market Segmentation
- 1.3. Research Methodology
- 1.4. Definitions and Assumptions
- 2. Executive Summary
- 2.1. Introduction
- 3. Market Dynamics
- 3.1. Introduction
- 3.2. Market Drivers
- 3.2.1. Escalating Demand for Processed Poultry Products; Favorable Government Initiatives to Boost Production
- 3.3. Market Restrains
- 3.3.1. Rising Vegan Trend among Young Consumers; Deeper Penetration of Red Meat Across Saudi Arabia
- 3.4. Market Trends
- 3.4.1. OTHER KEY INDUSTRY TRENDS COVERED IN THE REPORT
- 4. Market Factor Analysis
- 4.1. Porters Five Forces
- 4.2. Supply/Value Chain
- 4.3. PESTEL analysis
- 4.4. Market Entropy
- 4.5. Patent/Trademark Analysis
- 5. Global Red Meat Market in United Arab Emirates Analysis, Insights and Forecast, 2019-2031
- 5.1. Market Analysis, Insights and Forecast - by Type
- 5.1.1. Beef
- 5.1.2. Mutton
- 5.1.3. Other Meat
- 5.2. Market Analysis, Insights and Forecast - by Form
- 5.2.1. Canned
- 5.2.2. Fresh / Chilled
- 5.2.3. Frozen
- 5.2.4. Processed
- 5.3. Market Analysis, Insights and Forecast - by Distribution Channel
- 5.3.1. Off-Trade
- 5.3.1.1. Convenience Stores
- 5.3.1.2. Online Channel
- 5.3.1.3. Supermarkets and Hypermarkets
- 5.3.1.4. Others
- 5.3.2. On-Trade
- 5.3.1. Off-Trade
- 5.4. Market Analysis, Insights and Forecast - by Region
- 5.4.1. North America
- 5.4.2. South America
- 5.4.3. Europe
- 5.4.4. Middle East & Africa
- 5.4.5. Asia Pacific
- 5.1. Market Analysis, Insights and Forecast - by Type
- 6. North America Red Meat Market in United Arab Emirates Analysis, Insights and Forecast, 2019-2031
- 6.1. Market Analysis, Insights and Forecast - by Type
- 6.1.1. Beef
- 6.1.2. Mutton
- 6.1.3. Other Meat
- 6.2. Market Analysis, Insights and Forecast - by Form
- 6.2.1. Canned
- 6.2.2. Fresh / Chilled
- 6.2.3. Frozen
- 6.2.4. Processed
- 6.3. Market Analysis, Insights and Forecast - by Distribution Channel
- 6.3.1. Off-Trade
- 6.3.1.1. Convenience Stores
- 6.3.1.2. Online Channel
- 6.3.1.3. Supermarkets and Hypermarkets
- 6.3.1.4. Others
- 6.3.2. On-Trade
- 6.3.1. Off-Trade
- 6.1. Market Analysis, Insights and Forecast - by Type
- 7. South America Red Meat Market in United Arab Emirates Analysis, Insights and Forecast, 2019-2031
- 7.1. Market Analysis, Insights and Forecast - by Type
- 7.1.1. Beef
- 7.1.2. Mutton
- 7.1.3. Other Meat
- 7.2. Market Analysis, Insights and Forecast - by Form
- 7.2.1. Canned
- 7.2.2. Fresh / Chilled
- 7.2.3. Frozen
- 7.2.4. Processed
- 7.3. Market Analysis, Insights and Forecast - by Distribution Channel
- 7.3.1. Off-Trade
- 7.3.1.1. Convenience Stores
- 7.3.1.2. Online Channel
- 7.3.1.3. Supermarkets and Hypermarkets
- 7.3.1.4. Others
- 7.3.2. On-Trade
- 7.3.1. Off-Trade
- 7.1. Market Analysis, Insights and Forecast - by Type
- 8. Europe Red Meat Market in United Arab Emirates Analysis, Insights and Forecast, 2019-2031
- 8.1. Market Analysis, Insights and Forecast - by Type
- 8.1.1. Beef
- 8.1.2. Mutton
- 8.1.3. Other Meat
- 8.2. Market Analysis, Insights and Forecast - by Form
- 8.2.1. Canned
- 8.2.2. Fresh / Chilled
- 8.2.3. Frozen
- 8.2.4. Processed
- 8.3. Market Analysis, Insights and Forecast - by Distribution Channel
- 8.3.1. Off-Trade
- 8.3.1.1. Convenience Stores
- 8.3.1.2. Online Channel
- 8.3.1.3. Supermarkets and Hypermarkets
- 8.3.1.4. Others
- 8.3.2. On-Trade
- 8.3.1. Off-Trade
- 8.1. Market Analysis, Insights and Forecast - by Type
- 9. Middle East & Africa Red Meat Market in United Arab Emirates Analysis, Insights and Forecast, 2019-2031
- 9.1. Market Analysis, Insights and Forecast - by Type
- 9.1.1. Beef
- 9.1.2. Mutton
- 9.1.3. Other Meat
- 9.2. Market Analysis, Insights and Forecast - by Form
- 9.2.1. Canned
- 9.2.2. Fresh / Chilled
- 9.2.3. Frozen
- 9.2.4. Processed
- 9.3. Market Analysis, Insights and Forecast - by Distribution Channel
- 9.3.1. Off-Trade
- 9.3.1.1. Convenience Stores
- 9.3.1.2. Online Channel
- 9.3.1.3. Supermarkets and Hypermarkets
- 9.3.1.4. Others
- 9.3.2. On-Trade
- 9.3.1. Off-Trade
- 9.1. Market Analysis, Insights and Forecast - by Type
- 10. Asia Pacific Red Meat Market in United Arab Emirates Analysis, Insights and Forecast, 2019-2031
- 10.1. Market Analysis, Insights and Forecast - by Type
- 10.1.1. Beef
- 10.1.2. Mutton
- 10.1.3. Other Meat
- 10.2. Market Analysis, Insights and Forecast - by Form
- 10.2.1. Canned
- 10.2.2. Fresh / Chilled
- 10.2.3. Frozen
- 10.2.4. Processed
- 10.3. Market Analysis, Insights and Forecast - by Distribution Channel
- 10.3.1. Off-Trade
- 10.3.1.1. Convenience Stores
- 10.3.1.2. Online Channel
- 10.3.1.3. Supermarkets and Hypermarkets
- 10.3.1.4. Others
- 10.3.2. On-Trade
- 10.3.1. Off-Trade
- 10.1. Market Analysis, Insights and Forecast - by Type
- 11. North America Red Meat Market in United Arab Emirates Analysis, Insights and Forecast, 2019-2031
- 11.1. Market Analysis, Insights and Forecast - By Country/Sub-region
- 11.1.1 United States
- 11.1.2 Canada
- 11.1.3 Mexico
- 11.1.4 Rest of North America
- 12. Europe Red Meat Market in United Arab Emirates Analysis, Insights and Forecast, 2019-2031
- 12.1. Market Analysis, Insights and Forecast - By Country/Sub-region
- 12.1.1 United Kingdom
- 12.1.2 Germany
- 12.1.3 France
- 12.1.4 Russia
- 12.1.5 Italy
- 12.1.6 Spain
- 12.1.7 Rest of Europe
- 13. Asia Pacific Red Meat Market in United Arab Emirates Analysis, Insights and Forecast, 2019-2031
- 13.1. Market Analysis, Insights and Forecast - By Country/Sub-region
- 13.1.1 India
- 13.1.2 China
- 13.1.3 Japan
- 13.1.4 Australia
- 13.1.5 Rest of Asia Pacific
- 14. South America Red Meat Market in United Arab Emirates Analysis, Insights and Forecast, 2019-2031
- 14.1. Market Analysis, Insights and Forecast - By Country/Sub-region
- 14.1.1 Brazil
- 14.1.2 Argentina
- 14.1.3 Rest of South America
- 15. Middle East and Africa Red Meat Market in United Arab Emirates Analysis, Insights and Forecast, 2019-2031
- 15.1. Market Analysis, Insights and Forecast - By Country/Sub-region
- 15.1.1 South Africa
- 15.1.2 United Arab Emirates
- 15.1.3 Rest of Middle East and Africa
- 16. Competitive Analysis
- 16.1. Global Market Share Analysis 2024
- 16.2. Company Profiles
- 16.2.1 Najmat Taiba Foodstuff LLC
- 16.2.1.1. Overview
- 16.2.1.2. Products
- 16.2.1.3. SWOT Analysis
- 16.2.1.4. Recent Developments
- 16.2.1.5. Financials (Based on Availability)
- 16.2.2 BRF S A
- 16.2.2.1. Overview
- 16.2.2.2. Products
- 16.2.2.3. SWOT Analysis
- 16.2.2.4. Recent Developments
- 16.2.2.5. Financials (Based on Availability)
- 16.2.3 Albatha Group
- 16.2.3.1. Overview
- 16.2.3.2. Products
- 16.2.3.3. SWOT Analysis
- 16.2.3.4. Recent Developments
- 16.2.3.5. Financials (Based on Availability)
- 16.2.4 Siniora Food Industries Company
- 16.2.4.1. Overview
- 16.2.4.2. Products
- 16.2.4.3. SWOT Analysis
- 16.2.4.4. Recent Developments
- 16.2.4.5. Financials (Based on Availability)
- 16.2.5 The Savola Grou
- 16.2.5.1. Overview
- 16.2.5.2. Products
- 16.2.5.3. SWOT Analysis
- 16.2.5.4. Recent Developments
- 16.2.5.5. Financials (Based on Availability)
- 16.2.6 JBS SA
- 16.2.6.1. Overview
- 16.2.6.2. Products
- 16.2.6.3. SWOT Analysis
- 16.2.6.4. Recent Developments
- 16.2.6.5. Financials (Based on Availability)
- 16.2.7 Tanmiah Food Company
- 16.2.7.1. Overview
- 16.2.7.2. Products
- 16.2.7.3. SWOT Analysis
- 16.2.7.4. Recent Developments
- 16.2.7.5. Financials (Based on Availability)
- 16.2.8 Freshly Frozen Foods Factory LLC
- 16.2.8.1. Overview
- 16.2.8.2. Products
- 16.2.8.3. SWOT Analysis
- 16.2.8.4. Recent Developments
- 16.2.8.5. Financials (Based on Availability)
- 16.2.1 Najmat Taiba Foodstuff LLC
List of Figures
- Figure 1: Global Red Meat Market in United Arab Emirates Revenue Breakdown (Million, %) by Region 2024 & 2032
- Figure 2: Global Red Meat Market in United Arab Emirates Volume Breakdown (K Tons, %) by Region 2024 & 2032
- Figure 3: North America Red Meat Market in United Arab Emirates Revenue (Million), by Country 2024 & 2032
- Figure 4: North America Red Meat Market in United Arab Emirates Volume (K Tons), by Country 2024 & 2032
- Figure 5: North America Red Meat Market in United Arab Emirates Revenue Share (%), by Country 2024 & 2032
- Figure 6: North America Red Meat Market in United Arab Emirates Volume Share (%), by Country 2024 & 2032
- Figure 7: Europe Red Meat Market in United Arab Emirates Revenue (Million), by Country 2024 & 2032
- Figure 8: Europe Red Meat Market in United Arab Emirates Volume (K Tons), by Country 2024 & 2032
- Figure 9: Europe Red Meat Market in United Arab Emirates Revenue Share (%), by Country 2024 & 2032
- Figure 10: Europe Red Meat Market in United Arab Emirates Volume Share (%), by Country 2024 & 2032
- Figure 11: Asia Pacific Red Meat Market in United Arab Emirates Revenue (Million), by Country 2024 & 2032
- Figure 12: Asia Pacific Red Meat Market in United Arab Emirates Volume (K Tons), by Country 2024 & 2032
- Figure 13: Asia Pacific Red Meat Market in United Arab Emirates Revenue Share (%), by Country 2024 & 2032
- Figure 14: Asia Pacific Red Meat Market in United Arab Emirates Volume Share (%), by Country 2024 & 2032
- Figure 15: South America Red Meat Market in United Arab Emirates Revenue (Million), by Country 2024 & 2032
- Figure 16: South America Red Meat Market in United Arab Emirates Volume (K Tons), by Country 2024 & 2032
- Figure 17: South America Red Meat Market in United Arab Emirates Revenue Share (%), by Country 2024 & 2032
- Figure 18: South America Red Meat Market in United Arab Emirates Volume Share (%), by Country 2024 & 2032
- Figure 19: Middle East and Africa Red Meat Market in United Arab Emirates Revenue (Million), by Country 2024 & 2032
- Figure 20: Middle East and Africa Red Meat Market in United Arab Emirates Volume (K Tons), by Country 2024 & 2032
- Figure 21: Middle East and Africa Red Meat Market in United Arab Emirates Revenue Share (%), by Country 2024 & 2032
- Figure 22: Middle East and Africa Red Meat Market in United Arab Emirates Volume Share (%), by Country 2024 & 2032
- Figure 23: North America Red Meat Market in United Arab Emirates Revenue (Million), by Type 2024 & 2032
- Figure 24: North America Red Meat Market in United Arab Emirates Volume (K Tons), by Type 2024 & 2032
- Figure 25: North America Red Meat Market in United Arab Emirates Revenue Share (%), by Type 2024 & 2032
- Figure 26: North America Red Meat Market in United Arab Emirates Volume Share (%), by Type 2024 & 2032
- Figure 27: North America Red Meat Market in United Arab Emirates Revenue (Million), by Form 2024 & 2032
- Figure 28: North America Red Meat Market in United Arab Emirates Volume (K Tons), by Form 2024 & 2032
- Figure 29: North America Red Meat Market in United Arab Emirates Revenue Share (%), by Form 2024 & 2032
- Figure 30: North America Red Meat Market in United Arab Emirates Volume Share (%), by Form 2024 & 2032
- Figure 31: North America Red Meat Market in United Arab Emirates Revenue (Million), by Distribution Channel 2024 & 2032
- Figure 32: North America Red Meat Market in United Arab Emirates Volume (K Tons), by Distribution Channel 2024 & 2032
- Figure 33: North America Red Meat Market in United Arab Emirates Revenue Share (%), by Distribution Channel 2024 & 2032
- Figure 34: North America Red Meat Market in United Arab Emirates Volume Share (%), by Distribution Channel 2024 & 2032
- Figure 35: North America Red Meat Market in United Arab Emirates Revenue (Million), by Country 2024 & 2032
- Figure 36: North America Red Meat Market in United Arab Emirates Volume (K Tons), by Country 2024 & 2032
- Figure 37: North America Red Meat Market in United Arab Emirates Revenue Share (%), by Country 2024 & 2032
- Figure 38: North America Red Meat Market in United Arab Emirates Volume Share (%), by Country 2024 & 2032
- Figure 39: South America Red Meat Market in United Arab Emirates Revenue (Million), by Type 2024 & 2032
- Figure 40: South America Red Meat Market in United Arab Emirates Volume (K Tons), by Type 2024 & 2032
- Figure 41: South America Red Meat Market in United Arab Emirates Revenue Share (%), by Type 2024 & 2032
- Figure 42: South America Red Meat Market in United Arab Emirates Volume Share (%), by Type 2024 & 2032
- Figure 43: South America Red Meat Market in United Arab Emirates Revenue (Million), by Form 2024 & 2032
- Figure 44: South America Red Meat Market in United Arab Emirates Volume (K Tons), by Form 2024 & 2032
- Figure 45: South America Red Meat Market in United Arab Emirates Revenue Share (%), by Form 2024 & 2032
- Figure 46: South America Red Meat Market in United Arab Emirates Volume Share (%), by Form 2024 & 2032
- Figure 47: South America Red Meat Market in United Arab Emirates Revenue (Million), by Distribution Channel 2024 & 2032
- Figure 48: South America Red Meat Market in United Arab Emirates Volume (K Tons), by Distribution Channel 2024 & 2032
- Figure 49: South America Red Meat Market in United Arab Emirates Revenue Share (%), by Distribution Channel 2024 & 2032
- Figure 50: South America Red Meat Market in United Arab Emirates Volume Share (%), by Distribution Channel 2024 & 2032
- Figure 51: South America Red Meat Market in United Arab Emirates Revenue (Million), by Country 2024 & 2032
- Figure 52: South America Red Meat Market in United Arab Emirates Volume (K Tons), by Country 2024 & 2032
- Figure 53: South America Red Meat Market in United Arab Emirates Revenue Share (%), by Country 2024 & 2032
- Figure 54: South America Red Meat Market in United Arab Emirates Volume Share (%), by Country 2024 & 2032
- Figure 55: Europe Red Meat Market in United Arab Emirates Revenue (Million), by Type 2024 & 2032
- Figure 56: Europe Red Meat Market in United Arab Emirates Volume (K Tons), by Type 2024 & 2032
- Figure 57: Europe Red Meat Market in United Arab Emirates Revenue Share (%), by Type 2024 & 2032
- Figure 58: Europe Red Meat Market in United Arab Emirates Volume Share (%), by Type 2024 & 2032
- Figure 59: Europe Red Meat Market in United Arab Emirates Revenue (Million), by Form 2024 & 2032
- Figure 60: Europe Red Meat Market in United Arab Emirates Volume (K Tons), by Form 2024 & 2032
- Figure 61: Europe Red Meat Market in United Arab Emirates Revenue Share (%), by Form 2024 & 2032
- Figure 62: Europe Red Meat Market in United Arab Emirates Volume Share (%), by Form 2024 & 2032
- Figure 63: Europe Red Meat Market in United Arab Emirates Revenue (Million), by Distribution Channel 2024 & 2032
- Figure 64: Europe Red Meat Market in United Arab Emirates Volume (K Tons), by Distribution Channel 2024 & 2032
- Figure 65: Europe Red Meat Market in United Arab Emirates Revenue Share (%), by Distribution Channel 2024 & 2032
- Figure 66: Europe Red Meat Market in United Arab Emirates Volume Share (%), by Distribution Channel 2024 & 2032
- Figure 67: Europe Red Meat Market in United Arab Emirates Revenue (Million), by Country 2024 & 2032
- Figure 68: Europe Red Meat Market in United Arab Emirates Volume (K Tons), by Country 2024 & 2032
- Figure 69: Europe Red Meat Market in United Arab Emirates Revenue Share (%), by Country 2024 & 2032
- Figure 70: Europe Red Meat Market in United Arab Emirates Volume Share (%), by Country 2024 & 2032
- Figure 71: Middle East & Africa Red Meat Market in United Arab Emirates Revenue (Million), by Type 2024 & 2032
- Figure 72: Middle East & Africa Red Meat Market in United Arab Emirates Volume (K Tons), by Type 2024 & 2032
- Figure 73: Middle East & Africa Red Meat Market in United Arab Emirates Revenue Share (%), by Type 2024 & 2032
- Figure 74: Middle East & Africa Red Meat Market in United Arab Emirates Volume Share (%), by Type 2024 & 2032
- Figure 75: Middle East & Africa Red Meat Market in United Arab Emirates Revenue (Million), by Form 2024 & 2032
- Figure 76: Middle East & Africa Red Meat Market in United Arab Emirates Volume (K Tons), by Form 2024 & 2032
- Figure 77: Middle East & Africa Red Meat Market in United Arab Emirates Revenue Share (%), by Form 2024 & 2032
- Figure 78: Middle East & Africa Red Meat Market in United Arab Emirates Volume Share (%), by Form 2024 & 2032
- Figure 79: Middle East & Africa Red Meat Market in United Arab Emirates Revenue (Million), by Distribution Channel 2024 & 2032
- Figure 80: Middle East & Africa Red Meat Market in United Arab Emirates Volume (K Tons), by Distribution Channel 2024 & 2032
- Figure 81: Middle East & Africa Red Meat Market in United Arab Emirates Revenue Share (%), by Distribution Channel 2024 & 2032
- Figure 82: Middle East & Africa Red Meat Market in United Arab Emirates Volume Share (%), by Distribution Channel 2024 & 2032
- Figure 83: Middle East & Africa Red Meat Market in United Arab Emirates Revenue (Million), by Country 2024 & 2032
- Figure 84: Middle East & Africa Red Meat Market in United Arab Emirates Volume (K Tons), by Country 2024 & 2032
- Figure 85: Middle East & Africa Red Meat Market in United Arab Emirates Revenue Share (%), by Country 2024 & 2032
- Figure 86: Middle East & Africa Red Meat Market in United Arab Emirates Volume Share (%), by Country 2024 & 2032
- Figure 87: Asia Pacific Red Meat Market in United Arab Emirates Revenue (Million), by Type 2024 & 2032
- Figure 88: Asia Pacific Red Meat Market in United Arab Emirates Volume (K Tons), by Type 2024 & 2032
- Figure 89: Asia Pacific Red Meat Market in United Arab Emirates Revenue Share (%), by Type 2024 & 2032
- Figure 90: Asia Pacific Red Meat Market in United Arab Emirates Volume Share (%), by Type 2024 & 2032
- Figure 91: Asia Pacific Red Meat Market in United Arab Emirates Revenue (Million), by Form 2024 & 2032
- Figure 92: Asia Pacific Red Meat Market in United Arab Emirates Volume (K Tons), by Form 2024 & 2032
- Figure 93: Asia Pacific Red Meat Market in United Arab Emirates Revenue Share (%), by Form 2024 & 2032
- Figure 94: Asia Pacific Red Meat Market in United Arab Emirates Volume Share (%), by Form 2024 & 2032
- Figure 95: Asia Pacific Red Meat Market in United Arab Emirates Revenue (Million), by Distribution Channel 2024 & 2032
- Figure 96: Asia Pacific Red Meat Market in United Arab Emirates Volume (K Tons), by Distribution Channel 2024 & 2032
- Figure 97: Asia Pacific Red Meat Market in United Arab Emirates Revenue Share (%), by Distribution Channel 2024 & 2032
- Figure 98: Asia Pacific Red Meat Market in United Arab Emirates Volume Share (%), by Distribution Channel 2024 & 2032
- Figure 99: Asia Pacific Red Meat Market in United Arab Emirates Revenue (Million), by Country 2024 & 2032
- Figure 100: Asia Pacific Red Meat Market in United Arab Emirates Volume (K Tons), by Country 2024 & 2032
- Figure 101: Asia Pacific Red Meat Market in United Arab Emirates Revenue Share (%), by Country 2024 & 2032
- Figure 102: Asia Pacific Red Meat Market in United Arab Emirates Volume Share (%), by Country 2024 & 2032
List of Tables
- Table 1: Global Red Meat Market in United Arab Emirates Revenue Million Forecast, by Region 2019 & 2032
- Table 2: Global Red Meat Market in United Arab Emirates Volume K Tons Forecast, by Region 2019 & 2032
- Table 3: Global Red Meat Market in United Arab Emirates Revenue Million Forecast, by Type 2019 & 2032
- Table 4: Global Red Meat Market in United Arab Emirates Volume K Tons Forecast, by Type 2019 & 2032
- Table 5: Global Red Meat Market in United Arab Emirates Revenue Million Forecast, by Form 2019 & 2032
- Table 6: Global Red Meat Market in United Arab Emirates Volume K Tons Forecast, by Form 2019 & 2032
- Table 7: Global Red Meat Market in United Arab Emirates Revenue Million Forecast, by Distribution Channel 2019 & 2032
- Table 8: Global Red Meat Market in United Arab Emirates Volume K Tons Forecast, by Distribution Channel 2019 & 2032
- Table 9: Global Red Meat Market in United Arab Emirates Revenue Million Forecast, by Region 2019 & 2032
- Table 10: Global Red Meat Market in United Arab Emirates Volume K Tons Forecast, by Region 2019 & 2032
- Table 11: Global Red Meat Market in United Arab Emirates Revenue Million Forecast, by Country 2019 & 2032
- Table 12: Global Red Meat Market in United Arab Emirates Volume K Tons Forecast, by Country 2019 & 2032
- Table 13: United States Red Meat Market in United Arab Emirates Revenue (Million) Forecast, by Application 2019 & 2032
- Table 14: United States Red Meat Market in United Arab Emirates Volume (K Tons) Forecast, by Application 2019 & 2032
- Table 15: Canada Red Meat Market in United Arab Emirates Revenue (Million) Forecast, by Application 2019 & 2032
- Table 16: Canada Red Meat Market in United Arab Emirates Volume (K Tons) Forecast, by Application 2019 & 2032
- Table 17: Mexico Red Meat Market in United Arab Emirates Revenue (Million) Forecast, by Application 2019 & 2032
- Table 18: Mexico Red Meat Market in United Arab Emirates Volume (K Tons) Forecast, by Application 2019 & 2032
- Table 19: Rest of North America Red Meat Market in United Arab Emirates Revenue (Million) Forecast, by Application 2019 & 2032
- Table 20: Rest of North America Red Meat Market in United Arab Emirates Volume (K Tons) Forecast, by Application 2019 & 2032
- Table 21: Global Red Meat Market in United Arab Emirates Revenue Million Forecast, by Country 2019 & 2032
- Table 22: Global Red Meat Market in United Arab Emirates Volume K Tons Forecast, by Country 2019 & 2032
- Table 23: United Kingdom Red Meat Market in United Arab Emirates Revenue (Million) Forecast, by Application 2019 & 2032
- Table 24: United Kingdom Red Meat Market in United Arab Emirates Volume (K Tons) Forecast, by Application 2019 & 2032
- Table 25: Germany Red Meat Market in United Arab Emirates Revenue (Million) Forecast, by Application 2019 & 2032
- Table 26: Germany Red Meat Market in United Arab Emirates Volume (K Tons) Forecast, by Application 2019 & 2032
- Table 27: France Red Meat Market in United Arab Emirates Revenue (Million) Forecast, by Application 2019 & 2032
- Table 28: France Red Meat Market in United Arab Emirates Volume (K Tons) Forecast, by Application 2019 & 2032
- Table 29: Russia Red Meat Market in United Arab Emirates Revenue (Million) Forecast, by Application 2019 & 2032
- Table 30: Russia Red Meat Market in United Arab Emirates Volume (K Tons) Forecast, by Application 2019 & 2032
- Table 31: Italy Red Meat Market in United Arab Emirates Revenue (Million) Forecast, by Application 2019 & 2032
- Table 32: Italy Red Meat Market in United Arab Emirates Volume (K Tons) Forecast, by Application 2019 & 2032
- Table 33: Spain Red Meat Market in United Arab Emirates Revenue (Million) Forecast, by Application 2019 & 2032
- Table 34: Spain Red Meat Market in United Arab Emirates Volume (K Tons) Forecast, by Application 2019 & 2032
- Table 35: Rest of Europe Red Meat Market in United Arab Emirates Revenue (Million) Forecast, by Application 2019 & 2032
- Table 36: Rest of Europe Red Meat Market in United Arab Emirates Volume (K Tons) Forecast, by Application 2019 & 2032
- Table 37: Global Red Meat Market in United Arab Emirates Revenue Million Forecast, by Country 2019 & 2032
- Table 38: Global Red Meat Market in United Arab Emirates Volume K Tons Forecast, by Country 2019 & 2032
- Table 39: India Red Meat Market in United Arab Emirates Revenue (Million) Forecast, by Application 2019 & 2032
- Table 40: India Red Meat Market in United Arab Emirates Volume (K Tons) Forecast, by Application 2019 & 2032
- Table 41: China Red Meat Market in United Arab Emirates Revenue (Million) Forecast, by Application 2019 & 2032
- Table 42: China Red Meat Market in United Arab Emirates Volume (K Tons) Forecast, by Application 2019 & 2032
- Table 43: Japan Red Meat Market in United Arab Emirates Revenue (Million) Forecast, by Application 2019 & 2032
- Table 44: Japan Red Meat Market in United Arab Emirates Volume (K Tons) Forecast, by Application 2019 & 2032
- Table 45: Australia Red Meat Market in United Arab Emirates Revenue (Million) Forecast, by Application 2019 & 2032
- Table 46: Australia Red Meat Market in United Arab Emirates Volume (K Tons) Forecast, by Application 2019 & 2032
- Table 47: Rest of Asia Pacific Red Meat Market in United Arab Emirates Revenue (Million) Forecast, by Application 2019 & 2032
- Table 48: Rest of Asia Pacific Red Meat Market in United Arab Emirates Volume (K Tons) Forecast, by Application 2019 & 2032
- Table 49: Global Red Meat Market in United Arab Emirates Revenue Million Forecast, by Country 2019 & 2032
- Table 50: Global Red Meat Market in United Arab Emirates Volume K Tons Forecast, by Country 2019 & 2032
- Table 51: Brazil Red Meat Market in United Arab Emirates Revenue (Million) Forecast, by Application 2019 & 2032
- Table 52: Brazil Red Meat Market in United Arab Emirates Volume (K Tons) Forecast, by Application 2019 & 2032
- Table 53: Argentina Red Meat Market in United Arab Emirates Revenue (Million) Forecast, by Application 2019 & 2032
- Table 54: Argentina Red Meat Market in United Arab Emirates Volume (K Tons) Forecast, by Application 2019 & 2032
- Table 55: Rest of South America Red Meat Market in United Arab Emirates Revenue (Million) Forecast, by Application 2019 & 2032
- Table 56: Rest of South America Red Meat Market in United Arab Emirates Volume (K Tons) Forecast, by Application 2019 & 2032
- Table 57: Global Red Meat Market in United Arab Emirates Revenue Million Forecast, by Country 2019 & 2032
- Table 58: Global Red Meat Market in United Arab Emirates Volume K Tons Forecast, by Country 2019 & 2032
- Table 59: South Africa Red Meat Market in United Arab Emirates Revenue (Million) Forecast, by Application 2019 & 2032
- Table 60: South Africa Red Meat Market in United Arab Emirates Volume (K Tons) Forecast, by Application 2019 & 2032
- Table 61: United Arab Emirates Red Meat Market in United Arab Emirates Revenue (Million) Forecast, by Application 2019 & 2032
- Table 62: United Arab Emirates Red Meat Market in United Arab Emirates Volume (K Tons) Forecast, by Application 2019 & 2032
- Table 63: Rest of Middle East and Africa Red Meat Market in United Arab Emirates Revenue (Million) Forecast, by Application 2019 & 2032
- Table 64: Rest of Middle East and Africa Red Meat Market in United Arab Emirates Volume (K Tons) Forecast, by Application 2019 & 2032
- Table 65: Global Red Meat Market in United Arab Emirates Revenue Million Forecast, by Type 2019 & 2032
- Table 66: Global Red Meat Market in United Arab Emirates Volume K Tons Forecast, by Type 2019 & 2032
- Table 67: Global Red Meat Market in United Arab Emirates Revenue Million Forecast, by Form 2019 & 2032
- Table 68: Global Red Meat Market in United Arab Emirates Volume K Tons Forecast, by Form 2019 & 2032
- Table 69: Global Red Meat Market in United Arab Emirates Revenue Million Forecast, by Distribution Channel 2019 & 2032
- Table 70: Global Red Meat Market in United Arab Emirates Volume K Tons Forecast, by Distribution Channel 2019 & 2032
- Table 71: Global Red Meat Market in United Arab Emirates Revenue Million Forecast, by Country 2019 & 2032
- Table 72: Global Red Meat Market in United Arab Emirates Volume K Tons Forecast, by Country 2019 & 2032
- Table 73: United States Red Meat Market in United Arab Emirates Revenue (Million) Forecast, by Application 2019 & 2032
- Table 74: United States Red Meat Market in United Arab Emirates Volume (K Tons) Forecast, by Application 2019 & 2032
- Table 75: Canada Red Meat Market in United Arab Emirates Revenue (Million) Forecast, by Application 2019 & 2032
- Table 76: Canada Red Meat Market in United Arab Emirates Volume (K Tons) Forecast, by Application 2019 & 2032
- Table 77: Mexico Red Meat Market in United Arab Emirates Revenue (Million) Forecast, by Application 2019 & 2032
- Table 78: Mexico Red Meat Market in United Arab Emirates Volume (K Tons) Forecast, by Application 2019 & 2032
- Table 79: Global Red Meat Market in United Arab Emirates Revenue Million Forecast, by Type 2019 & 2032
- Table 80: Global Red Meat Market in United Arab Emirates Volume K Tons Forecast, by Type 2019 & 2032
- Table 81: Global Red Meat Market in United Arab Emirates Revenue Million Forecast, by Form 2019 & 2032
- Table 82: Global Red Meat Market in United Arab Emirates Volume K Tons Forecast, by Form 2019 & 2032
- Table 83: Global Red Meat Market in United Arab Emirates Revenue Million Forecast, by Distribution Channel 2019 & 2032
- Table 84: Global Red Meat Market in United Arab Emirates Volume K Tons Forecast, by Distribution Channel 2019 & 2032
- Table 85: Global Red Meat Market in United Arab Emirates Revenue Million Forecast, by Country 2019 & 2032
- Table 86: Global Red Meat Market in United Arab Emirates Volume K Tons Forecast, by Country 2019 & 2032
- Table 87: Brazil Red Meat Market in United Arab Emirates Revenue (Million) Forecast, by Application 2019 & 2032
- Table 88: Brazil Red Meat Market in United Arab Emirates Volume (K Tons) Forecast, by Application 2019 & 2032
- Table 89: Argentina Red Meat Market in United Arab Emirates Revenue (Million) Forecast, by Application 2019 & 2032
- Table 90: Argentina Red Meat Market in United Arab Emirates Volume (K Tons) Forecast, by Application 2019 & 2032
- Table 91: Rest of South America Red Meat Market in United Arab Emirates Revenue (Million) Forecast, by Application 2019 & 2032
- Table 92: Rest of South America Red Meat Market in United Arab Emirates Volume (K Tons) Forecast, by Application 2019 & 2032
- Table 93: Global Red Meat Market in United Arab Emirates Revenue Million Forecast, by Type 2019 & 2032
- Table 94: Global Red Meat Market in United Arab Emirates Volume K Tons Forecast, by Type 2019 & 2032
- Table 95: Global Red Meat Market in United Arab Emirates Revenue Million Forecast, by Form 2019 & 2032
- Table 96: Global Red Meat Market in United Arab Emirates Volume K Tons Forecast, by Form 2019 & 2032
- Table 97: Global Red Meat Market in United Arab Emirates Revenue Million Forecast, by Distribution Channel 2019 & 2032
- Table 98: Global Red Meat Market in United Arab Emirates Volume K Tons Forecast, by Distribution Channel 2019 & 2032
- Table 99: Global Red Meat Market in United Arab Emirates Revenue Million Forecast, by Country 2019 & 2032
- Table 100: Global Red Meat Market in United Arab Emirates Volume K Tons Forecast, by Country 2019 & 2032
- Table 101: United Kingdom Red Meat Market in United Arab Emirates Revenue (Million) Forecast, by Application 2019 & 2032
- Table 102: United Kingdom Red Meat Market in United Arab Emirates Volume (K Tons) Forecast, by Application 2019 & 2032
- Table 103: Germany Red Meat Market in United Arab Emirates Revenue (Million) Forecast, by Application 2019 & 2032
- Table 104: Germany Red Meat Market in United Arab Emirates Volume (K Tons) Forecast, by Application 2019 & 2032
- Table 105: France Red Meat Market in United Arab Emirates Revenue (Million) Forecast, by Application 2019 & 2032
- Table 106: France Red Meat Market in United Arab Emirates Volume (K Tons) Forecast, by Application 2019 & 2032
- Table 107: Italy Red Meat Market in United Arab Emirates Revenue (Million) Forecast, by Application 2019 & 2032
- Table 108: Italy Red Meat Market in United Arab Emirates Volume (K Tons) Forecast, by Application 2019 & 2032
- Table 109: Spain Red Meat Market in United Arab Emirates Revenue (Million) Forecast, by Application 2019 & 2032
- Table 110: Spain Red Meat Market in United Arab Emirates Volume (K Tons) Forecast, by Application 2019 & 2032
- Table 111: Russia Red Meat Market in United Arab Emirates Revenue (Million) Forecast, by Application 2019 & 2032
- Table 112: Russia Red Meat Market in United Arab Emirates Volume (K Tons) Forecast, by Application 2019 & 2032
- Table 113: Benelux Red Meat Market in United Arab Emirates Revenue (Million) Forecast, by Application 2019 & 2032
- Table 114: Benelux Red Meat Market in United Arab Emirates Volume (K Tons) Forecast, by Application 2019 & 2032
- Table 115: Nordics Red Meat Market in United Arab Emirates Revenue (Million) Forecast, by Application 2019 & 2032
- Table 116: Nordics Red Meat Market in United Arab Emirates Volume (K Tons) Forecast, by Application 2019 & 2032
- Table 117: Rest of Europe Red Meat Market in United Arab Emirates Revenue (Million) Forecast, by Application 2019 & 2032
- Table 118: Rest of Europe Red Meat Market in United Arab Emirates Volume (K Tons) Forecast, by Application 2019 & 2032
- Table 119: Global Red Meat Market in United Arab Emirates Revenue Million Forecast, by Type 2019 & 2032
- Table 120: Global Red Meat Market in United Arab Emirates Volume K Tons Forecast, by Type 2019 & 2032
- Table 121: Global Red Meat Market in United Arab Emirates Revenue Million Forecast, by Form 2019 & 2032
- Table 122: Global Red Meat Market in United Arab Emirates Volume K Tons Forecast, by Form 2019 & 2032
- Table 123: Global Red Meat Market in United Arab Emirates Revenue Million Forecast, by Distribution Channel 2019 & 2032
- Table 124: Global Red Meat Market in United Arab Emirates Volume K Tons Forecast, by Distribution Channel 2019 & 2032
- Table 125: Global Red Meat Market in United Arab Emirates Revenue Million Forecast, by Country 2019 & 2032
- Table 126: Global Red Meat Market in United Arab Emirates Volume K Tons Forecast, by Country 2019 & 2032
- Table 127: Turkey Red Meat Market in United Arab Emirates Revenue (Million) Forecast, by Application 2019 & 2032
- Table 128: Turkey Red Meat Market in United Arab Emirates Volume (K Tons) Forecast, by Application 2019 & 2032
- Table 129: Israel Red Meat Market in United Arab Emirates Revenue (Million) Forecast, by Application 2019 & 2032
- Table 130: Israel Red Meat Market in United Arab Emirates Volume (K Tons) Forecast, by Application 2019 & 2032
- Table 131: GCC Red Meat Market in United Arab Emirates Revenue (Million) Forecast, by Application 2019 & 2032
- Table 132: GCC Red Meat Market in United Arab Emirates Volume (K Tons) Forecast, by Application 2019 & 2032
- Table 133: North Africa Red Meat Market in United Arab Emirates Revenue (Million) Forecast, by Application 2019 & 2032
- Table 134: North Africa Red Meat Market in United Arab Emirates Volume (K Tons) Forecast, by Application 2019 & 2032
- Table 135: South Africa Red Meat Market in United Arab Emirates Revenue (Million) Forecast, by Application 2019 & 2032
- Table 136: South Africa Red Meat Market in United Arab Emirates Volume (K Tons) Forecast, by Application 2019 & 2032
- Table 137: Rest of Middle East & Africa Red Meat Market in United Arab Emirates Revenue (Million) Forecast, by Application 2019 & 2032
- Table 138: Rest of Middle East & Africa Red Meat Market in United Arab Emirates Volume (K Tons) Forecast, by Application 2019 & 2032
- Table 139: Global Red Meat Market in United Arab Emirates Revenue Million Forecast, by Type 2019 & 2032
- Table 140: Global Red Meat Market in United Arab Emirates Volume K Tons Forecast, by Type 2019 & 2032
- Table 141: Global Red Meat Market in United Arab Emirates Revenue Million Forecast, by Form 2019 & 2032
- Table 142: Global Red Meat Market in United Arab Emirates Volume K Tons Forecast, by Form 2019 & 2032
- Table 143: Global Red Meat Market in United Arab Emirates Revenue Million Forecast, by Distribution Channel 2019 & 2032
- Table 144: Global Red Meat Market in United Arab Emirates Volume K Tons Forecast, by Distribution Channel 2019 & 2032
- Table 145: Global Red Meat Market in United Arab Emirates Revenue Million Forecast, by Country 2019 & 2032
- Table 146: Global Red Meat Market in United Arab Emirates Volume K Tons Forecast, by Country 2019 & 2032
- Table 147: China Red Meat Market in United Arab Emirates Revenue (Million) Forecast, by Application 2019 & 2032
- Table 148: China Red Meat Market in United Arab Emirates Volume (K Tons) Forecast, by Application 2019 & 2032
- Table 149: India Red Meat Market in United Arab Emirates Revenue (Million) Forecast, by Application 2019 & 2032
- Table 150: India Red Meat Market in United Arab Emirates Volume (K Tons) Forecast, by Application 2019 & 2032
- Table 151: Japan Red Meat Market in United Arab Emirates Revenue (Million) Forecast, by Application 2019 & 2032
- Table 152: Japan Red Meat Market in United Arab Emirates Volume (K Tons) Forecast, by Application 2019 & 2032
- Table 153: South Korea Red Meat Market in United Arab Emirates Revenue (Million) Forecast, by Application 2019 & 2032
- Table 154: South Korea Red Meat Market in United Arab Emirates Volume (K Tons) Forecast, by Application 2019 & 2032
- Table 155: ASEAN Red Meat Market in United Arab Emirates Revenue (Million) Forecast, by Application 2019 & 2032
- Table 156: ASEAN Red Meat Market in United Arab Emirates Volume (K Tons) Forecast, by Application 2019 & 2032
- Table 157: Oceania Red Meat Market in United Arab Emirates Revenue (Million) Forecast, by Application 2019 & 2032
- Table 158: Oceania Red Meat Market in United Arab Emirates Volume (K Tons) Forecast, by Application 2019 & 2032
- Table 159: Rest of Asia Pacific Red Meat Market in United Arab Emirates Revenue (Million) Forecast, by Application 2019 & 2032
- Table 160: Rest of Asia Pacific Red Meat Market in United Arab Emirates Volume (K Tons) Forecast, by Application 2019 & 2032
Frequently Asked Questions
1. What is the projected Compound Annual Growth Rate (CAGR) of the Red Meat Market in United Arab Emirates?
The projected CAGR is approximately 4.20%.
2. Which companies are prominent players in the Red Meat Market in United Arab Emirates?
Key companies in the market include Najmat Taiba Foodstuff LLC, BRF S A, Albatha Group, Siniora Food Industries Company, The Savola Grou, JBS SA, Tanmiah Food Company, Freshly Frozen Foods Factory LLC.
3. What are the main segments of the Red Meat Market in United Arab Emirates?
The market segments include Type, Form, Distribution Channel.
4. Can you provide details about the market size?
The market size is estimated to be USD 789.11 Million as of 2022.
5. What are some drivers contributing to market growth?
Escalating Demand for Processed Poultry Products; Favorable Government Initiatives to Boost Production.
6. What are the notable trends driving market growth?
OTHER KEY INDUSTRY TRENDS COVERED IN THE REPORT.
7. Are there any restraints impacting market growth?
Rising Vegan Trend among Young Consumers; Deeper Penetration of Red Meat Across Saudi Arabia.
8. Can you provide examples of recent developments in the market?
February 2023: Saudi-based Tanmiah Food Company and US-based Tyson Foods Inc. renewed their partnership signed previously in 2022. The partnership was signed in order to recognize the potential growth opportunities across Saudi Arabia and the broader Middle East.July 2022: Tanmiah Food Company and Tyson Foods entered a strategic partnership to expand meat production capacity. The investment is expected to enable Tanmiah Food Company to access the high demand for protein in the Middle East and other international markets.December 2021: Tanmiah Food Company’s wholly owned subsidiary Gulf Brand Fast Food Co. signed a master franchise and development agreement with Popeyes, an international quick service restaurant chain, to diversify across the value chain by offering high-quality food options, including Popeyes Chicken Sandwich made from fresh and locally sourced fresh chicken.
9. What pricing options are available for accessing the report?
Pricing options include single-user, multi-user, and enterprise licenses priced at USD 3800, USD 4500, and USD 5800 respectively.
10. Is the market size provided in terms of value or volume?
The market size is provided in terms of value, measured in Million and volume, measured in K Tons.
11. Are there any specific market keywords associated with the report?
Yes, the market keyword associated with the report is "Red Meat Market in United Arab Emirates," which aids in identifying and referencing the specific market segment covered.
12. How do I determine which pricing option suits my needs best?
The pricing options vary based on user requirements and access needs. Individual users may opt for single-user licenses, while businesses requiring broader access may choose multi-user or enterprise licenses for cost-effective access to the report.
13. Are there any additional resources or data provided in the Red Meat Market in United Arab Emirates report?
While the report offers comprehensive insights, it's advisable to review the specific contents or supplementary materials provided to ascertain if additional resources or data are available.
14. How can I stay updated on further developments or reports in the Red Meat Market in United Arab Emirates?
To stay informed about further developments, trends, and reports in the Red Meat Market in United Arab Emirates, consider subscribing to industry newsletters, following relevant companies and organizations, or regularly checking reputable industry news sources and publications.
Methodology
Step 1 - Identification of Relevant Samples Size from Population Database


Step 2 - Approaches for Defining Global Market Size (Value, Volume* & Price*)

Note*: In applicable scenarios
Step 3 - Data Sources
Primary Research
- Web Analytics
- Survey Reports
- Research Institute
- Latest Research Reports
- Opinion Leaders
Secondary Research
- Annual Reports
- White Paper
- Latest Press Release
- Industry Association
- Paid Database
- Investor Presentations

Step 4 - Data Triangulation
Involves using different sources of information in order to increase the validity of a study
These sources are likely to be stakeholders in a program - participants, other researchers, program staff, other community members, and so on.
Then we put all data in single framework & apply various statistical tools to find out the dynamic on the market.
During the analysis stage, feedback from the stakeholder groups would be compared to determine areas of agreement as well as areas of divergence


