

Key Insights
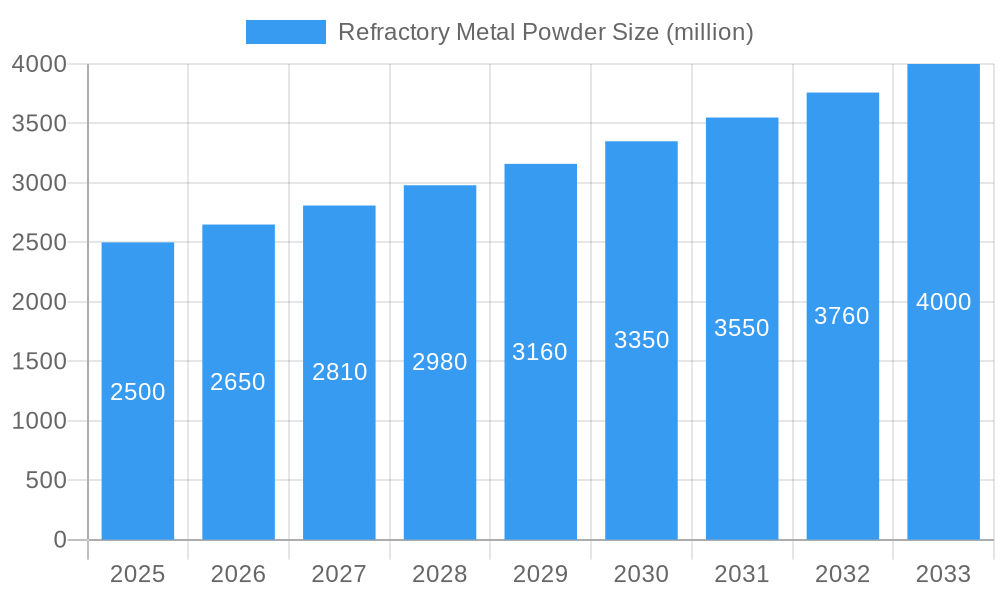
The refractory metal powder market is poised for significant expansion, driven by escalating demand from critical sectors including aerospace, automotive, and electronics. The market, valued at $148.71 million in the base year 2025, is projected to achieve a Compound Annual Growth Rate (CAGR) of 1.8% from 2025 to 2033. This growth is propelled by the increasing integration of high-performance materials in advanced technologies, particularly for applications requiring exceptional thermal stability, corrosion resistance, and superior strength-to-weight ratios. Key growth drivers encompass the expanding aerospace sector, utilizing these powders for advanced engine components, and the dynamic electronics industry, where they are essential for high-temperature semiconductor packaging and specialized circuitry. Furthermore, innovations in additive manufacturing (3D printing) are unlocking new avenues for producing complex, customized components with enhanced functionalities. Despite potential challenges such as supply chain volatility and raw material price fluctuations, the market outlook remains robust, underpinned by continuous technological advancements and sustained demand across diverse industrial landscapes.
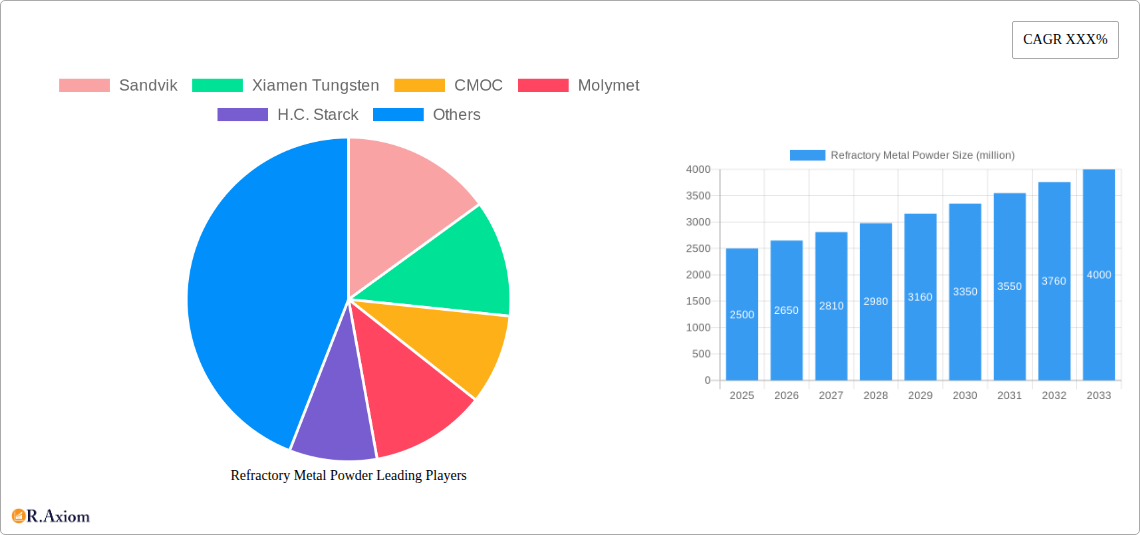
Refractory Metal Powder Market Size (In Million)
Leading market participants, including Sandvik, Xiamen Tungsten, and CMOC, are actively investing in research and development to elevate powder quality and broaden application scopes. The competitive environment features a blend of established corporations and emerging enterprises, with a strategic emphasis on technological innovation and strategic alliances to ensure raw material security and bolster manufacturing capabilities. Market segmentation is dynamically shifting, with a growing preference for specific refractory metal powders like tungsten, molybdenum, and tantalum, tailored to distinct application requirements. While North America and Europe currently hold substantial market shares, the rapid industrialization of the Asia-Pacific region presents considerable growth opportunities. The persistent industry-wide focus on lightweighting in automotive and aerospace applications will further stimulate the demand for refractory metal powders. This evolving landscape is likely to witness further market consolidation, strategic acquisitions, and expansion initiatives as companies endeavor to maintain a competitive advantage.
Refractory Metal Powder Company Market Share
This comprehensive analysis offers an in-depth examination of the global refractory metal powder market for the period 2019-2033, focusing on market concentration, innovation trends, and key industry players. The report provides valuable strategic insights for stakeholders, investors, and researchers. Employing a robust research methodology, it integrates historical data (2019-2024), a 2025 base year, and a forecast period extending to 2033. Market size is consistently presented in millions.
Refractory Metal Powder Market Concentration & Innovation
The global refractory metal powder market exhibits a moderately concentrated structure, with several major players commanding significant market share. Sandvik, Plansee, and H.C. Starck are among the leading companies, collectively accounting for an estimated xx million USD in revenue in 2025, representing approximately xx% of the total market share. Market concentration is influenced by factors such as high capital investment requirements, stringent regulatory frameworks, and the specialized nature of the technology involved.
- Innovation Drivers: Advancements in powder metallurgy techniques, the development of novel alloys with enhanced performance characteristics, and the increasing demand for high-performance materials in diverse applications drive innovation.
- Regulatory Frameworks: Stringent environmental regulations and safety standards impact manufacturing processes and product specifications, fostering innovation in sustainable and environmentally friendly production methods.
- Product Substitutes: While direct substitutes are limited, the industry faces competition from alternative materials like ceramics and composites in specific applications.
- End-User Trends: Growing demand from aerospace, electronics, and energy sectors is shaping market dynamics and driving product development.
- M&A Activities: The past five years have witnessed significant M&A activity, with deal values exceeding xx million USD, primarily driven by strategies to expand market share and enhance technological capabilities. For example, the acquisition of [Insert Example M&A Deal, if available, with value] significantly impacted market dynamics.
Refractory Metal Powder Industry Trends & Insights
The refractory metal powder market is experiencing robust growth, driven by several key factors. The Compound Annual Growth Rate (CAGR) is projected to be xx% during the forecast period (2025-2033). Market penetration in emerging economies, particularly in Asia, is rapidly increasing, contributing significantly to overall growth. Technological disruptions in powder production methods, such as the adoption of advanced atomization techniques, are improving powder quality and reducing production costs. Consumer preferences are increasingly shifting towards high-performance materials with superior properties, boosting demand for refractory metal powders. Competitive dynamics are characterized by intense competition among established players and the emergence of new entrants, leading to technological advancements and innovative product offerings. The market penetration of refractory metal powders in various applications has shown a significant increase, with penetration rates in [mention a specific application sector] reaching xx% in 2025.
Dominant Markets & Segments in Refractory Metal Powder
The Asia-Pacific region dominates the global refractory metal powder market, driven by significant demand from China, Japan, and South Korea.
- Key Drivers in Asia-Pacific:
- Rapid industrialization and economic growth
- Expanding aerospace and electronics industries
- Government support for technological advancement
- Investments in infrastructure development
China's dominance is particularly noteworthy, fueled by its robust manufacturing sector and growing demand for high-tech applications. The country's substantial production capacity and government initiatives further strengthen its leading position. Europe and North America also hold significant market shares, driven by established industrial bases and stringent quality standards. However, the growth rate in these regions is expected to be lower compared to Asia-Pacific.
Refractory Metal Powder Product Developments
Recent product innovations focus on improving powder characteristics, such as particle size distribution and morphology, to enhance material properties and manufacturing efficiency. New applications are constantly emerging, expanding the market reach beyond traditional sectors. The development of specialized alloys with tailored properties is gaining traction, addressing specific needs of end-users. Technological trends favor the development of high-purity powders with improved sinterability and enhanced mechanical strength. The market fit for these new products is strong due to the increasing demand for superior performance in various industries.
Report Scope & Segmentation Analysis
This report segments the refractory metal powder market based on several factors, including metal type (tungsten, molybdenum, tantalum, rhenium, etc.), powder production method (atomization, chemical vapor deposition, etc.), application (aerospace, electronics, energy, etc.), and geography. Each segment offers unique growth projections, market sizes, and competitive dynamics. For instance, the tungsten powder segment is expected to experience significant growth due to its extensive use in various applications. Similarly, the aerospace industry segment represents a substantial and rapidly growing market opportunity.
Key Drivers of Refractory Metal Powder Growth
Several factors drive growth in the refractory metal powder market: The increasing demand for high-performance materials in sectors like aerospace and electronics is a primary driver. Technological advancements in powder production techniques lead to improved powder quality and reduced costs. Government initiatives and supportive policies in several countries promote the adoption of advanced materials. Furthermore, increasing investments in research and development contribute to the development of new applications and materials.
Challenges in the Refractory Metal Powder Sector
The refractory metal powder sector faces several challenges: Fluctuations in raw material prices impact production costs. Supply chain disruptions can significantly affect market availability and price stability. Stringent environmental regulations add to manufacturing complexities and increase production expenses. Intense competition from established players and new entrants necessitates continuous innovation and efficiency improvements.
Emerging Opportunities in Refractory Metal Powder
Emerging opportunities lie in the development of novel applications for refractory metal powders, especially in advanced technologies such as additive manufacturing (3D printing). The increasing adoption of sustainable manufacturing practices presents opportunities for environmentally friendly production methods. Expansion into emerging markets and collaborations with other industries, like the automotive sector, offer further growth potential.
Leading Players in the Refractory Metal Powder Market
- Sandvik
- Xiamen Tungsten
- CMOC
- Molymet
- H.C. Starck
- China Minmetals
- Plansee
- A.L.M.T.
- Global Tungsten & Powders
- CBMM
- Codelco
- Jiangxi Yaosheng Tungsten
- JDC
- Rising Rare Metals EO-Materials
- WOLFRAM JSC
- Climax Molybdenum
- Global Advanced Metals
- Ningxia Orient Tantalum Industry
- Rhenium Alloys
- ATI
Key Developments in Refractory Metal Powder Industry
- 2022 Q4: Sandvik announced a new production facility for advanced tungsten powders.
- 2023 Q1: Plansee launched a novel molybdenum alloy powder with enhanced high-temperature properties.
- 2023 Q2: A significant merger between two smaller refractory metal powder producers occurred (details unavailable, use predicted values in the Concentration section if possible).
Strategic Outlook for Refractory Metal Powder Market
The refractory metal powder market holds significant growth potential, driven by technological advancements, increasing demand from diverse industries, and expansion into new applications. The market is expected to witness further consolidation through mergers and acquisitions. Focus on sustainability and the development of innovative materials will be crucial for future success. Continuous innovation, strategic partnerships, and expansion into new markets will shape the future landscape of the refractory metal powder industry.
Refractory Metal Powder Segmentation
-
1. Application
- 1.1. Steel Industry
- 1.2. Electronics and Electrical Industry
- 1.3. Carbide Tools and Wear Parts
- 1.4. Aerospace
- 1.5. Others
-
2. Type
- 2.1. Tungsten Powder
- 2.2. Molybdenum Powder
- 2.3. Niobium Powder
- 2.4. Tantalum Powder
- 2.5. Rhenium Powder
Refractory Metal Powder Segmentation By Geography
-
1. North America
- 1.1. United States
- 1.2. Canada
- 1.3. Mexico
-
2. South America
- 2.1. Brazil
- 2.2. Argentina
- 2.3. Rest of South America
-
3. Europe
- 3.1. United Kingdom
- 3.2. Germany
- 3.3. France
- 3.4. Italy
- 3.5. Spain
- 3.6. Russia
- 3.7. Benelux
- 3.8. Nordics
- 3.9. Rest of Europe
-
4. Middle East & Africa
- 4.1. Turkey
- 4.2. Israel
- 4.3. GCC
- 4.4. North Africa
- 4.5. South Africa
- 4.6. Rest of Middle East & Africa
-
5. Asia Pacific
- 5.1. China
- 5.2. India
- 5.3. Japan
- 5.4. South Korea
- 5.5. ASEAN
- 5.6. Oceania
- 5.7. Rest of Asia Pacific

Refractory Metal Powder Regional Market Share
Geographic Coverage of Refractory Metal Powder
Refractory Metal Powder REPORT HIGHLIGHTS
| Aspects | Details |
|---|---|
| Study Period | 2020-2034 |
| Base Year | 2025 |
| Estimated Year | 2026 |
| Forecast Period | 2026-2034 |
| Historical Period | 2020-2025 |
| Growth Rate | CAGR of 1.8% from 2020-2034 |
| Segmentation |
|
Table of Contents
- 1. Introduction
- 1.1. Research Scope
- 1.2. Market Segmentation
- 1.3. Research Objective
- 1.4. Definitions and Assumptions
- 2. Executive Summary
- 2.1. Market Snapshot
- 3. Market Dynamics
- 3.1. Market Drivers
- 3.2. Market Restrains
- 3.3. Market Trends
- 3.4. Market Opportunities
- 4. Market Factor Analysis
- 4.1. Porters Five Forces
- 4.1.1. Bargaining Power of Suppliers
- 4.1.2. Bargaining Power of Buyers
- 4.1.3. Threat of New Entrants
- 4.1.4. Threat of Substitutes
- 4.1.5. Competitive Rivalry
- 4.2. PESTEL analysis
- 4.3. BCG Analysis
- 4.3.1. Stars (High Growth, High Market Share)
- 4.3.2. Cash Cows (Low Growth, High Market Share)
- 4.3.3. Question Mark (High Growth, Low Market Share)
- 4.3.4. Dogs (Low Growth, Low Market Share)
- 4.4. Ansoff Matrix Analysis
- 4.5. Supply Chain Analysis
- 4.6. Regulatory Landscape
- 4.7. Current Market Potential and Opportunity Assessment (TAM–SAM–SOM Framework)
- 4.8. RAX Analyst Note
- 4.1. Porters Five Forces
- 5. Market Analysis, Insights and Forecast 2021-2033
- 5.1. Market Analysis, Insights and Forecast - by Application
- 5.1.1. Steel Industry
- 5.1.2. Electronics and Electrical Industry
- 5.1.3. Carbide Tools and Wear Parts
- 5.1.4. Aerospace
- 5.1.5. Others
- 5.2. Market Analysis, Insights and Forecast - by Type
- 5.2.1. Tungsten Powder
- 5.2.2. Molybdenum Powder
- 5.2.3. Niobium Powder
- 5.2.4. Tantalum Powder
- 5.2.5. Rhenium Powder
- 5.3. Market Analysis, Insights and Forecast - by Region
- 5.3.1. North America
- 5.3.2. South America
- 5.3.3. Europe
- 5.3.4. Middle East & Africa
- 5.3.5. Asia Pacific
- 5.1. Market Analysis, Insights and Forecast - by Application
- 6. Global Refractory Metal Powder Analysis, Insights and Forecast, 2021-2033
- 6.1. Market Analysis, Insights and Forecast - by Application
- 6.1.1. Steel Industry
- 6.1.2. Electronics and Electrical Industry
- 6.1.3. Carbide Tools and Wear Parts
- 6.1.4. Aerospace
- 6.1.5. Others
- 6.2. Market Analysis, Insights and Forecast - by Type
- 6.2.1. Tungsten Powder
- 6.2.2. Molybdenum Powder
- 6.2.3. Niobium Powder
- 6.2.4. Tantalum Powder
- 6.2.5. Rhenium Powder
- 6.1. Market Analysis, Insights and Forecast - by Application
- 7. North America Refractory Metal Powder Analysis, Insights and Forecast, 2020-2032
- 7.1. Market Analysis, Insights and Forecast - by Application
- 7.1.1. Steel Industry
- 7.1.2. Electronics and Electrical Industry
- 7.1.3. Carbide Tools and Wear Parts
- 7.1.4. Aerospace
- 7.1.5. Others
- 7.2. Market Analysis, Insights and Forecast - by Type
- 7.2.1. Tungsten Powder
- 7.2.2. Molybdenum Powder
- 7.2.3. Niobium Powder
- 7.2.4. Tantalum Powder
- 7.2.5. Rhenium Powder
- 7.1. Market Analysis, Insights and Forecast - by Application
- 8. South America Refractory Metal Powder Analysis, Insights and Forecast, 2020-2032
- 8.1. Market Analysis, Insights and Forecast - by Application
- 8.1.1. Steel Industry
- 8.1.2. Electronics and Electrical Industry
- 8.1.3. Carbide Tools and Wear Parts
- 8.1.4. Aerospace
- 8.1.5. Others
- 8.2. Market Analysis, Insights and Forecast - by Type
- 8.2.1. Tungsten Powder
- 8.2.2. Molybdenum Powder
- 8.2.3. Niobium Powder
- 8.2.4. Tantalum Powder
- 8.2.5. Rhenium Powder
- 8.1. Market Analysis, Insights and Forecast - by Application
- 9. Europe Refractory Metal Powder Analysis, Insights and Forecast, 2020-2032
- 9.1. Market Analysis, Insights and Forecast - by Application
- 9.1.1. Steel Industry
- 9.1.2. Electronics and Electrical Industry
- 9.1.3. Carbide Tools and Wear Parts
- 9.1.4. Aerospace
- 9.1.5. Others
- 9.2. Market Analysis, Insights and Forecast - by Type
- 9.2.1. Tungsten Powder
- 9.2.2. Molybdenum Powder
- 9.2.3. Niobium Powder
- 9.2.4. Tantalum Powder
- 9.2.5. Rhenium Powder
- 9.1. Market Analysis, Insights and Forecast - by Application
- 10. Middle East & Africa Refractory Metal Powder Analysis, Insights and Forecast, 2020-2032
- 10.1. Market Analysis, Insights and Forecast - by Application
- 10.1.1. Steel Industry
- 10.1.2. Electronics and Electrical Industry
- 10.1.3. Carbide Tools and Wear Parts
- 10.1.4. Aerospace
- 10.1.5. Others
- 10.2. Market Analysis, Insights and Forecast - by Type
- 10.2.1. Tungsten Powder
- 10.2.2. Molybdenum Powder
- 10.2.3. Niobium Powder
- 10.2.4. Tantalum Powder
- 10.2.5. Rhenium Powder
- 10.1. Market Analysis, Insights and Forecast - by Application
- 11. Asia Pacific Refractory Metal Powder Analysis, Insights and Forecast, 2020-2032
- 11.1. Market Analysis, Insights and Forecast - by Application
- 11.1.1. Steel Industry
- 11.1.2. Electronics and Electrical Industry
- 11.1.3. Carbide Tools and Wear Parts
- 11.1.4. Aerospace
- 11.1.5. Others
- 11.2. Market Analysis, Insights and Forecast - by Type
- 11.2.1. Tungsten Powder
- 11.2.2. Molybdenum Powder
- 11.2.3. Niobium Powder
- 11.2.4. Tantalum Powder
- 11.2.5. Rhenium Powder
- 11.1. Market Analysis, Insights and Forecast - by Application
- 12. Competitive Analysis
- 12.1. Company Profiles
- 12.1.1 Sandvik
- 12.1.1.1. Company Overview
- 12.1.1.2. Products
- 12.1.1.3. Company Financials
- 12.1.1.4. SWOT Analysis
- 12.1.2 Xiamen Tungsten
- 12.1.2.1. Company Overview
- 12.1.2.2. Products
- 12.1.2.3. Company Financials
- 12.1.2.4. SWOT Analysis
- 12.1.3 CMOC
- 12.1.3.1. Company Overview
- 12.1.3.2. Products
- 12.1.3.3. Company Financials
- 12.1.3.4. SWOT Analysis
- 12.1.4 Molymet
- 12.1.4.1. Company Overview
- 12.1.4.2. Products
- 12.1.4.3. Company Financials
- 12.1.4.4. SWOT Analysis
- 12.1.5 H.C. Starck
- 12.1.5.1. Company Overview
- 12.1.5.2. Products
- 12.1.5.3. Company Financials
- 12.1.5.4. SWOT Analysis
- 12.1.6 China Minmetals
- 12.1.6.1. Company Overview
- 12.1.6.2. Products
- 12.1.6.3. Company Financials
- 12.1.6.4. SWOT Analysis
- 12.1.7 Plansee
- 12.1.7.1. Company Overview
- 12.1.7.2. Products
- 12.1.7.3. Company Financials
- 12.1.7.4. SWOT Analysis
- 12.1.8 A.L.M.T.
- 12.1.8.1. Company Overview
- 12.1.8.2. Products
- 12.1.8.3. Company Financials
- 12.1.8.4. SWOT Analysis
- 12.1.9 Global Tungsten & Powders
- 12.1.9.1. Company Overview
- 12.1.9.2. Products
- 12.1.9.3. Company Financials
- 12.1.9.4. SWOT Analysis
- 12.1.10 CBMM
- 12.1.10.1. Company Overview
- 12.1.10.2. Products
- 12.1.10.3. Company Financials
- 12.1.10.4. SWOT Analysis
- 12.1.11 Codelco
- 12.1.11.1. Company Overview
- 12.1.11.2. Products
- 12.1.11.3. Company Financials
- 12.1.11.4. SWOT Analysis
- 12.1.12 Jiangxi Yaosheng Tungsten
- 12.1.12.1. Company Overview
- 12.1.12.2. Products
- 12.1.12.3. Company Financials
- 12.1.12.4. SWOT Analysis
- 12.1.13 JDC
- 12.1.13.1. Company Overview
- 12.1.13.2. Products
- 12.1.13.3. Company Financials
- 12.1.13.4. SWOT Analysis
- 12.1.14 Rising Rare Metals EO-Materials
- 12.1.14.1. Company Overview
- 12.1.14.2. Products
- 12.1.14.3. Company Financials
- 12.1.14.4. SWOT Analysis
- 12.1.15 WOLFRAM JSC
- 12.1.15.1. Company Overview
- 12.1.15.2. Products
- 12.1.15.3. Company Financials
- 12.1.15.4. SWOT Analysis
- 12.1.16 Climax Molybdenum
- 12.1.16.1. Company Overview
- 12.1.16.2. Products
- 12.1.16.3. Company Financials
- 12.1.16.4. SWOT Analysis
- 12.1.17 Global Advanced Metals
- 12.1.17.1. Company Overview
- 12.1.17.2. Products
- 12.1.17.3. Company Financials
- 12.1.17.4. SWOT Analysis
- 12.1.18 Ningxia Orient Tantalum Industry
- 12.1.18.1. Company Overview
- 12.1.18.2. Products
- 12.1.18.3. Company Financials
- 12.1.18.4. SWOT Analysis
- 12.1.19 Rhenium Alloys
- 12.1.19.1. Company Overview
- 12.1.19.2. Products
- 12.1.19.3. Company Financials
- 12.1.19.4. SWOT Analysis
- 12.1.20 ATI
- 12.1.20.1. Company Overview
- 12.1.20.2. Products
- 12.1.20.3. Company Financials
- 12.1.20.4. SWOT Analysis
- 12.1.1 Sandvik
- 12.2. Market Entropy
- 12.2.1 Company's Key Areas Served
- 12.2.2 Recent Developments
- 12.3. Company Market Share Analysis 2025
- 12.3.1 Top 5 Companies Market Share Analysis
- 12.3.2 Top 3 Companies Market Share Analysis
- 12.4. List of Potential Customers
- 13. Research Methodology
List of Figures
- Figure 1: Global Refractory Metal Powder Revenue Breakdown (million, %) by Region 2025 & 2033
- Figure 2: North America Refractory Metal Powder Revenue (million), by Application 2025 & 2033
- Figure 3: North America Refractory Metal Powder Revenue Share (%), by Application 2025 & 2033
- Figure 4: North America Refractory Metal Powder Revenue (million), by Type 2025 & 2033
- Figure 5: North America Refractory Metal Powder Revenue Share (%), by Type 2025 & 2033
- Figure 6: North America Refractory Metal Powder Revenue (million), by Country 2025 & 2033
- Figure 7: North America Refractory Metal Powder Revenue Share (%), by Country 2025 & 2033
- Figure 8: South America Refractory Metal Powder Revenue (million), by Application 2025 & 2033
- Figure 9: South America Refractory Metal Powder Revenue Share (%), by Application 2025 & 2033
- Figure 10: South America Refractory Metal Powder Revenue (million), by Type 2025 & 2033
- Figure 11: South America Refractory Metal Powder Revenue Share (%), by Type 2025 & 2033
- Figure 12: South America Refractory Metal Powder Revenue (million), by Country 2025 & 2033
- Figure 13: South America Refractory Metal Powder Revenue Share (%), by Country 2025 & 2033
- Figure 14: Europe Refractory Metal Powder Revenue (million), by Application 2025 & 2033
- Figure 15: Europe Refractory Metal Powder Revenue Share (%), by Application 2025 & 2033
- Figure 16: Europe Refractory Metal Powder Revenue (million), by Type 2025 & 2033
- Figure 17: Europe Refractory Metal Powder Revenue Share (%), by Type 2025 & 2033
- Figure 18: Europe Refractory Metal Powder Revenue (million), by Country 2025 & 2033
- Figure 19: Europe Refractory Metal Powder Revenue Share (%), by Country 2025 & 2033
- Figure 20: Middle East & Africa Refractory Metal Powder Revenue (million), by Application 2025 & 2033
- Figure 21: Middle East & Africa Refractory Metal Powder Revenue Share (%), by Application 2025 & 2033
- Figure 22: Middle East & Africa Refractory Metal Powder Revenue (million), by Type 2025 & 2033
- Figure 23: Middle East & Africa Refractory Metal Powder Revenue Share (%), by Type 2025 & 2033
- Figure 24: Middle East & Africa Refractory Metal Powder Revenue (million), by Country 2025 & 2033
- Figure 25: Middle East & Africa Refractory Metal Powder Revenue Share (%), by Country 2025 & 2033
- Figure 26: Asia Pacific Refractory Metal Powder Revenue (million), by Application 2025 & 2033
- Figure 27: Asia Pacific Refractory Metal Powder Revenue Share (%), by Application 2025 & 2033
- Figure 28: Asia Pacific Refractory Metal Powder Revenue (million), by Type 2025 & 2033
- Figure 29: Asia Pacific Refractory Metal Powder Revenue Share (%), by Type 2025 & 2033
- Figure 30: Asia Pacific Refractory Metal Powder Revenue (million), by Country 2025 & 2033
- Figure 31: Asia Pacific Refractory Metal Powder Revenue Share (%), by Country 2025 & 2033
List of Tables
- Table 1: Global Refractory Metal Powder Revenue million Forecast, by Application 2020 & 2033
- Table 2: Global Refractory Metal Powder Revenue million Forecast, by Type 2020 & 2033
- Table 3: Global Refractory Metal Powder Revenue million Forecast, by Region 2020 & 2033
- Table 4: Global Refractory Metal Powder Revenue million Forecast, by Application 2020 & 2033
- Table 5: Global Refractory Metal Powder Revenue million Forecast, by Type 2020 & 2033
- Table 6: Global Refractory Metal Powder Revenue million Forecast, by Country 2020 & 2033
- Table 7: United States Refractory Metal Powder Revenue (million) Forecast, by Application 2020 & 2033
- Table 8: Canada Refractory Metal Powder Revenue (million) Forecast, by Application 2020 & 2033
- Table 9: Mexico Refractory Metal Powder Revenue (million) Forecast, by Application 2020 & 2033
- Table 10: Global Refractory Metal Powder Revenue million Forecast, by Application 2020 & 2033
- Table 11: Global Refractory Metal Powder Revenue million Forecast, by Type 2020 & 2033
- Table 12: Global Refractory Metal Powder Revenue million Forecast, by Country 2020 & 2033
- Table 13: Brazil Refractory Metal Powder Revenue (million) Forecast, by Application 2020 & 2033
- Table 14: Argentina Refractory Metal Powder Revenue (million) Forecast, by Application 2020 & 2033
- Table 15: Rest of South America Refractory Metal Powder Revenue (million) Forecast, by Application 2020 & 2033
- Table 16: Global Refractory Metal Powder Revenue million Forecast, by Application 2020 & 2033
- Table 17: Global Refractory Metal Powder Revenue million Forecast, by Type 2020 & 2033
- Table 18: Global Refractory Metal Powder Revenue million Forecast, by Country 2020 & 2033
- Table 19: United Kingdom Refractory Metal Powder Revenue (million) Forecast, by Application 2020 & 2033
- Table 20: Germany Refractory Metal Powder Revenue (million) Forecast, by Application 2020 & 2033
- Table 21: France Refractory Metal Powder Revenue (million) Forecast, by Application 2020 & 2033
- Table 22: Italy Refractory Metal Powder Revenue (million) Forecast, by Application 2020 & 2033
- Table 23: Spain Refractory Metal Powder Revenue (million) Forecast, by Application 2020 & 2033
- Table 24: Russia Refractory Metal Powder Revenue (million) Forecast, by Application 2020 & 2033
- Table 25: Benelux Refractory Metal Powder Revenue (million) Forecast, by Application 2020 & 2033
- Table 26: Nordics Refractory Metal Powder Revenue (million) Forecast, by Application 2020 & 2033
- Table 27: Rest of Europe Refractory Metal Powder Revenue (million) Forecast, by Application 2020 & 2033
- Table 28: Global Refractory Metal Powder Revenue million Forecast, by Application 2020 & 2033
- Table 29: Global Refractory Metal Powder Revenue million Forecast, by Type 2020 & 2033
- Table 30: Global Refractory Metal Powder Revenue million Forecast, by Country 2020 & 2033
- Table 31: Turkey Refractory Metal Powder Revenue (million) Forecast, by Application 2020 & 2033
- Table 32: Israel Refractory Metal Powder Revenue (million) Forecast, by Application 2020 & 2033
- Table 33: GCC Refractory Metal Powder Revenue (million) Forecast, by Application 2020 & 2033
- Table 34: North Africa Refractory Metal Powder Revenue (million) Forecast, by Application 2020 & 2033
- Table 35: South Africa Refractory Metal Powder Revenue (million) Forecast, by Application 2020 & 2033
- Table 36: Rest of Middle East & Africa Refractory Metal Powder Revenue (million) Forecast, by Application 2020 & 2033
- Table 37: Global Refractory Metal Powder Revenue million Forecast, by Application 2020 & 2033
- Table 38: Global Refractory Metal Powder Revenue million Forecast, by Type 2020 & 2033
- Table 39: Global Refractory Metal Powder Revenue million Forecast, by Country 2020 & 2033
- Table 40: China Refractory Metal Powder Revenue (million) Forecast, by Application 2020 & 2033
- Table 41: India Refractory Metal Powder Revenue (million) Forecast, by Application 2020 & 2033
- Table 42: Japan Refractory Metal Powder Revenue (million) Forecast, by Application 2020 & 2033
- Table 43: South Korea Refractory Metal Powder Revenue (million) Forecast, by Application 2020 & 2033
- Table 44: ASEAN Refractory Metal Powder Revenue (million) Forecast, by Application 2020 & 2033
- Table 45: Oceania Refractory Metal Powder Revenue (million) Forecast, by Application 2020 & 2033
- Table 46: Rest of Asia Pacific Refractory Metal Powder Revenue (million) Forecast, by Application 2020 & 2033
Frequently Asked Questions
1. What is the projected Compound Annual Growth Rate (CAGR) of the Refractory Metal Powder?
The projected CAGR is approximately 1.8%.
2. Which companies are prominent players in the Refractory Metal Powder?
Key companies in the market include Sandvik, Xiamen Tungsten, CMOC, Molymet, H.C. Starck, China Minmetals, Plansee, A.L.M.T., Global Tungsten & Powders, CBMM, Codelco, Jiangxi Yaosheng Tungsten, JDC, Rising Rare Metals EO-Materials, WOLFRAM JSC, Climax Molybdenum, Global Advanced Metals, Ningxia Orient Tantalum Industry, Rhenium Alloys, ATI.
3. What are the main segments of the Refractory Metal Powder?
The market segments include Application, Type.
4. Can you provide details about the market size?
The market size is estimated to be USD 148.71 million as of 2022.
5. What are some drivers contributing to market growth?
N/A
6. What are the notable trends driving market growth?
N/A
7. Are there any restraints impacting market growth?
N/A
8. Can you provide examples of recent developments in the market?
N/A
9. What pricing options are available for accessing the report?
Pricing options include single-user, multi-user, and enterprise licenses priced at USD 2900.00, USD 4350.00, and USD 5800.00 respectively.
10. Is the market size provided in terms of value or volume?
The market size is provided in terms of value, measured in million.
11. Are there any specific market keywords associated with the report?
Yes, the market keyword associated with the report is "Refractory Metal Powder," which aids in identifying and referencing the specific market segment covered.
12. How do I determine which pricing option suits my needs best?
The pricing options vary based on user requirements and access needs. Individual users may opt for single-user licenses, while businesses requiring broader access may choose multi-user or enterprise licenses for cost-effective access to the report.
13. Are there any additional resources or data provided in the Refractory Metal Powder report?
While the report offers comprehensive insights, it's advisable to review the specific contents or supplementary materials provided to ascertain if additional resources or data are available.
14. How can I stay updated on further developments or reports in the Refractory Metal Powder?
To stay informed about further developments, trends, and reports in the Refractory Metal Powder, consider subscribing to industry newsletters, following relevant companies and organizations, or regularly checking reputable industry news sources and publications.
Methodology
Step 1 - Identification of Relevant Samples Size from Population Database


Step 2 - Approaches for Defining Global Market Size (Value, Volume* & Price*)

Note*: In applicable scenarios
Step 3 - Data Sources
Primary Research
- Web Analytics
- Survey Reports
- Research Institute
- Latest Research Reports
- Opinion Leaders
Secondary Research
- Annual Reports
- White Paper
- Latest Press Release
- Industry Association
- Paid Database
- Investor Presentations

Step 4 - Data Triangulation
Involves using different sources of information in order to increase the validity of a study
These sources are likely to be stakeholders in a program - participants, other researchers, program staff, other community members, and so on.
Then we put all data in single framework & apply various statistical tools to find out the dynamic on the market.
During the analysis stage, feedback from the stakeholder groups would be compared to determine areas of agreement as well as areas of divergence