

Key Insights
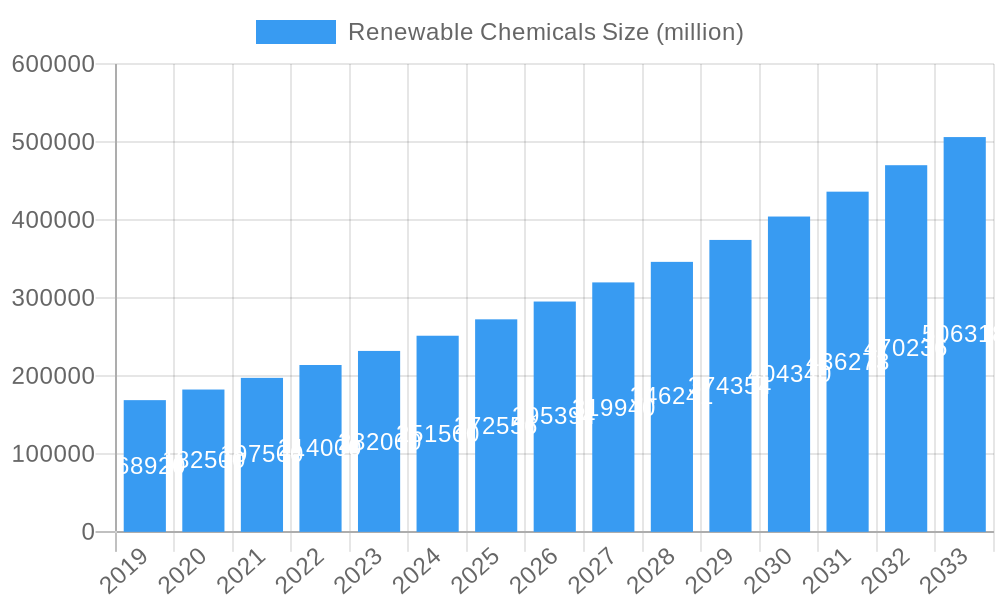
The global renewable chemicals market is experiencing robust expansion, projected to reach a significant valuation by 2033. With a compelling Compound Annual Growth Rate (CAGR) of 9.8%, this sector is driven by an increasing global imperative for sustainable solutions and a growing demand for environmentally friendly alternatives across various industries. Key applications such as transportation, textiles, and food processing are witnessing a substantial uptake of renewable chemical alternatives, fueled by stringent regulatory frameworks, rising consumer awareness regarding environmental impact, and technological advancements in bio-based production. The market's growth is further bolstered by the rising cost and volatility of fossil fuel-based chemicals, making bioethanol and biodiesel increasingly attractive options. Innovations in biochemical production are also unlocking new avenues for sustainable materials, further diversifying the market's potential and contributing to its impressive trajectory.
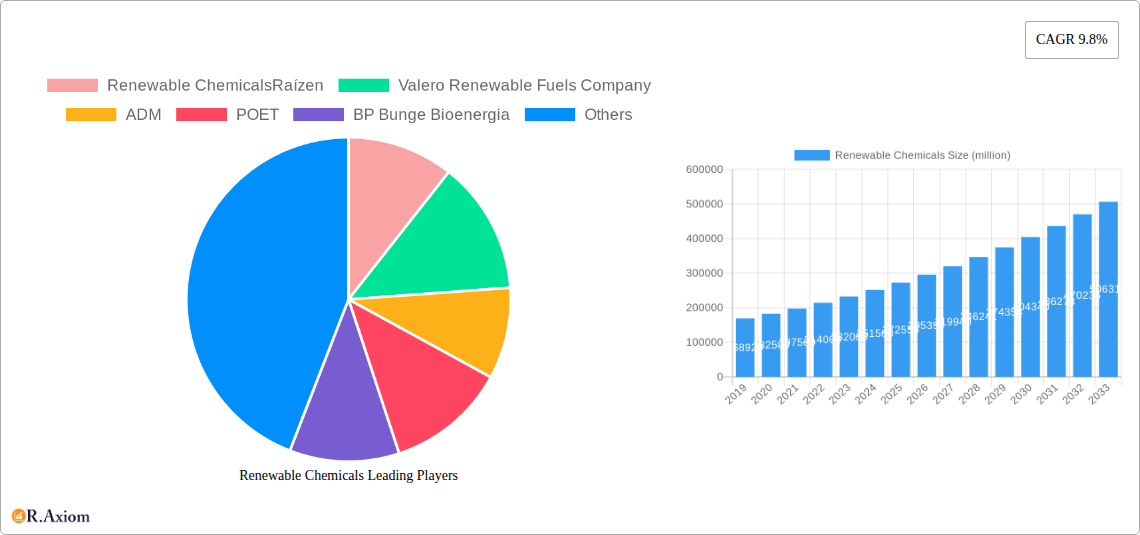
Renewable Chemicals Market Size (In Billion)
The market landscape is characterized by intense competition and strategic collaborations among major players, including Renewable Chemicals Raízen, ADM, POET, and Cargill. These companies are actively investing in research and development to enhance production efficiency, reduce costs, and expand their product portfolios. Geographically, North America and Europe are leading the adoption of renewable chemicals, driven by supportive government policies and a strong emphasis on circular economy principles. However, the Asia Pacific region is emerging as a high-growth market, propelled by rapid industrialization, a large consumer base, and increasing environmental consciousness. While the market benefits from strong drivers, challenges such as the high initial investment costs for production facilities, fluctuating raw material prices, and the need for improved supply chain infrastructure remain areas for strategic focus to ensure sustained and accelerated growth in the coming years.
Renewable Chemicals Company Market Share
Renewable Chemicals Market: A Comprehensive Analysis and Strategic Outlook (2019-2033)
This in-depth report delivers a meticulously researched analysis of the global renewable chemicals market, a rapidly expanding sector driven by sustainability initiatives and technological advancements. Covering the historical period of 2019-2024 and projecting growth through the forecast period of 2025-2033, with the base year and estimated year set at 2025, this report is an indispensable resource for industry stakeholders. It provides critical insights into market concentration, innovation drivers, regulatory frameworks, segment-specific growth trajectories, product developments, and strategic outlooks, all essential for navigating the evolving biofuels, biochemicals, and sustainable materials landscape. Expect to find millions of dollars in market value projections and detailed segment analysis, offering actionable intelligence for chemical manufacturers, energy companies, investors, and policymakers.
Renewable Chemicals Market Concentration & Innovation
The global renewable chemicals market exhibits a moderately concentrated structure, with key players like ADM, Neste Oil Rotterdam, and Raízen holding significant market share, estimated in the billions of dollars. Innovation is a primary driver, fueled by substantial investments in R&D by companies such as BASF and Arkema, focusing on improving yields, reducing production costs, and developing novel bio-based polymers and sustainable fuels. The market share for leading bioethanol producers, for instance, is estimated to be in the high tens of billions of dollars, while biodiesel and biochemicals segments are also experiencing robust growth, projected to reach tens of billions each by 2025. Regulatory frameworks, including government mandates for biofuel blending and incentives for green chemistry, are pivotal in shaping market dynamics. For example, the renewable fuel standard programs have spurred significant investment. The threat of product substitutes, primarily from conventional petrochemicals, remains a consideration, though the increasing cost and environmental impact of fossil fuels are diminishing this threat. End-user trends, particularly the demand for sustainable solutions in transportation, textiles, and food applications, are accelerating market penetration. Mergers and acquisitions (M&A) activity is on the rise, with notable deals in the tens to hundreds of millions of dollars, as larger corporations seek to acquire innovative technologies and expand their sustainable portfolio.
Renewable Chemicals Industry Trends & Insights
The renewable chemicals industry is poised for substantial expansion, with a projected Compound Annual Growth Rate (CAGR) of approximately 8.5% to 10% over the forecast period. This growth is underpinned by a confluence of factors, including escalating global demand for sustainable alternatives to petrochemicals, stringent environmental regulations, and significant advancements in biotechnology and biorefining technologies. The transportation sector remains a dominant application, driven by the increasing adoption of bioethanol and biodiesel as fuel additives and replacements, propelled by government mandates and consumer awareness. Market penetration in this segment is estimated to reach over 60% in key developed economies by 2033. Technological disruptions are central to this growth, with innovations in enzyme technology, genetic engineering of microorganisms, and advanced catalysis enabling the more efficient and cost-effective production of a wider range of bio-based chemicals. For instance, the development of cellulosic bioethanol from non-food biomass is unlocking new feedstock opportunities and reducing land-use competition. Consumer preferences are increasingly shifting towards products with a lower carbon footprint and reduced environmental impact. This is evident in the growing demand for bio-based plastics, renewable textiles, and sustainable ingredients in the food industry. The competitive landscape is characterized by strategic alliances, technological partnerships, and increased investment from both established chemical giants and emerging bio-based companies. The market size for renewable chemicals is projected to exceed hundreds of billions of dollars by 2033, with significant contributions from all key segments.
Dominant Markets & Segments in Renewable Chemicals
The Asia-Pacific region, particularly China and India, is emerging as a dominant market for renewable chemicals, driven by supportive government policies, a rapidly expanding industrial base, and increasing consumer demand for sustainable products. Economic policies such as subsidies for biofuel production and investments in green infrastructure are critical drivers in this region. The transportation application segment is the largest contributor to the global renewable chemicals market. Within this segment, bioethanol production dominates, supported by blending mandates in numerous countries, aiming to reduce reliance on fossil fuels and mitigate greenhouse gas emissions. The market size for bioethanol in transportation alone is estimated to be in the tens of billions of dollars.
Key drivers for this dominance include:
- Government Mandates: Mandatory blending of biofuels in gasoline and diesel.
- Energy Security Concerns: Reducing dependence on imported fossil fuels.
- Environmental Regulations: Targets for reducing carbon emissions.
- Growing Vehicle Fleets: Increased demand for fuel additives.
The biofuel segment, encompassing both bioethanol and biodiesel, collectively represents the largest share of the renewable chemicals market, accounting for over 70% of the total market value in 2025, projected to be in the hundreds of billions of dollars. Biodiesel, produced from vegetable oils and animal fats, is gaining traction due to its lower emissions profile and compatibility with existing diesel engines.
- Biodiesel Market Drivers:
- Advancements in feedstock diversification (e.g., used cooking oil, algal oil).
- Technological improvements in transesterification processes.
- Growing demand for cleaner fuels in commercial fleets.
The biochemicals segment is also experiencing significant growth, driven by their versatility and applicability across various industries, including textiles, food, pharmaceuticals, and specialty chemicals. Innovations in producing bioplastics, bio-based solvents, and bio-based surfactants are expanding their market penetration. The food application, while smaller than transportation, is witnessing robust growth due to the increasing consumer preference for natural and sustainably sourced ingredients.
- Biochemicals Market Drivers:
- Development of bio-based alternatives for conventional plastics.
- Demand for sustainable packaging solutions.
- Innovation in bio-based materials for the textile industry, offering eco-friendly alternatives.
Renewable Chemicals Product Developments
Recent product developments in the renewable chemicals market focus on enhancing performance, expanding applications, and improving sustainability metrics. Innovations in bio-based polymers are yielding materials with properties comparable to or exceeding those of their petrochemical counterparts, finding use in packaging and automotive components. Advancements in bio-surfactants offer eco-friendly alternatives for cleaning products and personal care items. The development of advanced biofuels from non-food biomass, such as lignocellulosic bioethanol, represents a significant leap towards greater sustainability and reduced competition with food resources. These product innovations are crucial for expanding market reach and providing competitive advantages in a rapidly evolving industry.
Report Scope & Segmentation Analysis
This report provides a comprehensive segmentation of the renewable chemicals market.
- Application Segment: This segment is analyzed across Transportation (primarily biofuels), Textiles (e.g., bio-based fibers), Food (e.g., bio-based ingredients, food packaging), and Others (including bioplastics, pharmaceuticals, and specialty chemicals). The Transportation segment is projected to maintain its dominance, with a market size expected to reach tens of billions of dollars by 2033.
- Type Segment: The market is segmented by product type into Bioethanol, Biodiesel, and Biochemicals. Bioethanol and Biodiesel are expected to collectively hold the largest market share, with projections in the tens to hundreds of billions of dollars. Biochemicals represent a rapidly growing segment, with significant potential in diverse applications.
Key Drivers of Renewable Chemicals Growth
The growth of the renewable chemicals market is propelled by several interconnected factors. Technological advancements in biorefining, biotechnology, and catalysis are continuously improving production efficiency and reducing costs. Economic factors, such as rising oil prices and the increasing economic viability of bio-based alternatives, are making renewable chemicals more competitive. Furthermore, regulatory support through government mandates, subsidies, and carbon pricing mechanisms is a critical catalyst, encouraging investment and adoption. The growing consumer and corporate demand for sustainable and eco-friendly products is also a significant driver, pushing industries to seek greener alternatives.
Challenges in the Renewable Chemicals Sector
Despite its robust growth, the renewable chemicals sector faces several challenges. Supply chain volatility for biomass feedstocks, including fluctuations in availability and pricing, can impact production costs. Regulatory hurdles and inconsistencies across different regions can create market uncertainty and hinder widespread adoption. Competition from established petrochemical industries, which benefit from economies of scale and existing infrastructure, remains a significant pressure. Furthermore, ensuring the scalability and cost-effectiveness of new technologies is crucial for widespread market penetration.
Emerging Opportunities in Renewable Chemicals
The renewable chemicals market presents numerous emerging opportunities. The development of next-generation biofuels from waste materials and algae promises to enhance sustainability and reduce land-use conflicts. The expanding market for bioplastics and bio-based materials in packaging, automotive, and consumer goods offers significant growth potential. Advancements in synthetic biology and precision fermentation are opening new avenues for producing complex biochemicals with novel functionalities. Furthermore, the increasing focus on the circular economy is driving innovation in bio-based product design and end-of-life solutions.
Leading Players in the Renewable Chemicals Market
- Raízen
- Valero Renewable Fuels Company
- ADM
- POET
- BP Bunge Bioenergia
- Green Plains
- Flint Hills Resource
- Cargill
- CropEnergies AG
- Diester Industries
- Neste Oil Rotterdam
- Renewable Energy Group
- COFCO
- RBF Port Neches
- Aemetis
- Louis Dreyfus
- BASF
- Arkema
Key Developments in Renewable Chemicals Industry
- 2023 December: Neste Oil Rotterdam announces expansion of its renewable diesel capacity, aiming to meet growing demand for sustainable aviation fuel.
- 2023 November: ADM invests in new biorefinery for advanced biofuels, utilizing agricultural residues for enhanced sustainability.
- 2023 October: POET secures partnerships for cellulosic bioethanol production, further diversifying feedstock sources.
- 2023 September: BASF launches a new line of bio-based polymers for automotive applications, enhancing lightweighting and sustainability.
- 2023 August: Valero Renewable Fuels Company reports record production of bioethanol, driven by strong market demand and favorable policies.
- 2023 July: CropEnergies AG expands its bioethanol production to include sustainable aviation fuel precursors.
- 2023 June: Cargill announces collaborations for biodiesel production from novel feedstocks, including used cooking oil.
- 2023 May: Green Plains initiates projects for advanced bio-based chemicals production, diversifying its product portfolio beyond bioethanol.
- 2023 April: Raízen inaugurates a new bioethanol plant utilizing sugarcane waste, enhancing its circular economy initiatives.
- 2023 March: Renewable Energy Group (REG) expands its renewable diesel production capacity through strategic acquisitions.
- 2023 February: BP Bunge Bioenergia invests in technologies to improve bioethanol yield from sugarcane.
- 2023 January: Arkema develops new bio-based adhesives for the construction industry, promoting sustainable building practices.
Strategic Outlook for Renewable Chemicals Market
The strategic outlook for the renewable chemicals market is exceptionally positive, driven by a global imperative for sustainability and a robust technological innovation pipeline. Growth catalysts include increasing government support for green technologies, rising consumer demand for eco-friendly products, and the continuous development of cost-effective and high-performance bio-based materials. Strategic partnerships, M&A activities, and investments in research and development will be crucial for companies to maintain a competitive edge. The market is poised for significant expansion, offering substantial opportunities for those aligned with the transition towards a more sustainable and circular economy.
Renewable Chemicals Segmentation
-
1. Application
- 1.1. Transportation
- 1.2. Textiles
- 1.3. Food
- 1.4. Others
-
2. Type
- 2.1. Bioethanol
- 2.2. Biodiesel
- 2.3. Biochemicals
Renewable Chemicals Segmentation By Geography
-
1. North America
- 1.1. United States
- 1.2. Canada
- 1.3. Mexico
-
2. South America
- 2.1. Brazil
- 2.2. Argentina
- 2.3. Rest of South America
-
3. Europe
- 3.1. United Kingdom
- 3.2. Germany
- 3.3. France
- 3.4. Italy
- 3.5. Spain
- 3.6. Russia
- 3.7. Benelux
- 3.8. Nordics
- 3.9. Rest of Europe
-
4. Middle East & Africa
- 4.1. Turkey
- 4.2. Israel
- 4.3. GCC
- 4.4. North Africa
- 4.5. South Africa
- 4.6. Rest of Middle East & Africa
-
5. Asia Pacific
- 5.1. China
- 5.2. India
- 5.3. Japan
- 5.4. South Korea
- 5.5. ASEAN
- 5.6. Oceania
- 5.7. Rest of Asia Pacific
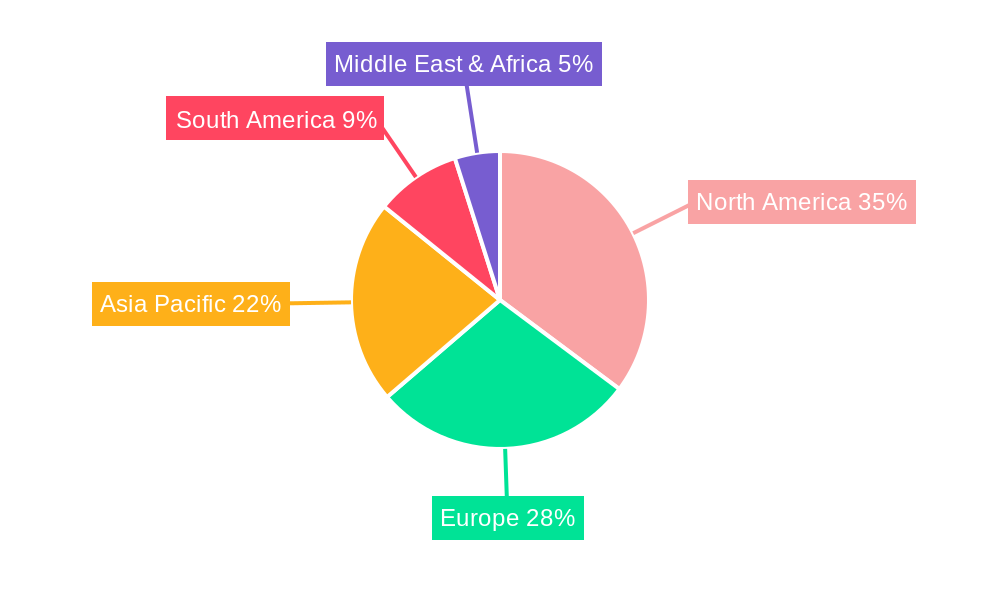
Renewable Chemicals Regional Market Share
Geographic Coverage of Renewable Chemicals
Renewable Chemicals REPORT HIGHLIGHTS
| Aspects | Details |
|---|---|
| Study Period | 2020-2034 |
| Base Year | 2025 |
| Estimated Year | 2026 |
| Forecast Period | 2026-2034 |
| Historical Period | 2020-2025 |
| Growth Rate | CAGR of 9.8% from 2020-2034 |
| Segmentation |
|
Table of Contents
- 1. Introduction
- 1.1. Research Scope
- 1.2. Market Segmentation
- 1.3. Research Objective
- 1.4. Definitions and Assumptions
- 2. Executive Summary
- 2.1. Market Snapshot
- 3. Market Dynamics
- 3.1. Market Drivers
- 3.2. Market Restrains
- 3.3. Market Trends
- 3.4. Market Opportunities
- 4. Market Factor Analysis
- 4.1. Porters Five Forces
- 4.1.1. Bargaining Power of Suppliers
- 4.1.2. Bargaining Power of Buyers
- 4.1.3. Threat of New Entrants
- 4.1.4. Threat of Substitutes
- 4.1.5. Competitive Rivalry
- 4.2. PESTEL analysis
- 4.3. BCG Analysis
- 4.3.1. Stars (High Growth, High Market Share)
- 4.3.2. Cash Cows (Low Growth, High Market Share)
- 4.3.3. Question Mark (High Growth, Low Market Share)
- 4.3.4. Dogs (Low Growth, Low Market Share)
- 4.4. Ansoff Matrix Analysis
- 4.5. Supply Chain Analysis
- 4.6. Regulatory Landscape
- 4.7. Current Market Potential and Opportunity Assessment (TAM–SAM–SOM Framework)
- 4.8. RAX Analyst Note
- 4.1. Porters Five Forces
- 5. Market Analysis, Insights and Forecast 2021-2033
- 5.1. Market Analysis, Insights and Forecast - by Application
- 5.1.1. Transportation
- 5.1.2. Textiles
- 5.1.3. Food
- 5.1.4. Others
- 5.2. Market Analysis, Insights and Forecast - by Type
- 5.2.1. Bioethanol
- 5.2.2. Biodiesel
- 5.2.3. Biochemicals
- 5.3. Market Analysis, Insights and Forecast - by Region
- 5.3.1. North America
- 5.3.2. South America
- 5.3.3. Europe
- 5.3.4. Middle East & Africa
- 5.3.5. Asia Pacific
- 5.1. Market Analysis, Insights and Forecast - by Application
- 6. Global Renewable Chemicals Analysis, Insights and Forecast, 2021-2033
- 6.1. Market Analysis, Insights and Forecast - by Application
- 6.1.1. Transportation
- 6.1.2. Textiles
- 6.1.3. Food
- 6.1.4. Others
- 6.2. Market Analysis, Insights and Forecast - by Type
- 6.2.1. Bioethanol
- 6.2.2. Biodiesel
- 6.2.3. Biochemicals
- 6.1. Market Analysis, Insights and Forecast - by Application
- 7. North America Renewable Chemicals Analysis, Insights and Forecast, 2020-2032
- 7.1. Market Analysis, Insights and Forecast - by Application
- 7.1.1. Transportation
- 7.1.2. Textiles
- 7.1.3. Food
- 7.1.4. Others
- 7.2. Market Analysis, Insights and Forecast - by Type
- 7.2.1. Bioethanol
- 7.2.2. Biodiesel
- 7.2.3. Biochemicals
- 7.1. Market Analysis, Insights and Forecast - by Application
- 8. South America Renewable Chemicals Analysis, Insights and Forecast, 2020-2032
- 8.1. Market Analysis, Insights and Forecast - by Application
- 8.1.1. Transportation
- 8.1.2. Textiles
- 8.1.3. Food
- 8.1.4. Others
- 8.2. Market Analysis, Insights and Forecast - by Type
- 8.2.1. Bioethanol
- 8.2.2. Biodiesel
- 8.2.3. Biochemicals
- 8.1. Market Analysis, Insights and Forecast - by Application
- 9. Europe Renewable Chemicals Analysis, Insights and Forecast, 2020-2032
- 9.1. Market Analysis, Insights and Forecast - by Application
- 9.1.1. Transportation
- 9.1.2. Textiles
- 9.1.3. Food
- 9.1.4. Others
- 9.2. Market Analysis, Insights and Forecast - by Type
- 9.2.1. Bioethanol
- 9.2.2. Biodiesel
- 9.2.3. Biochemicals
- 9.1. Market Analysis, Insights and Forecast - by Application
- 10. Middle East & Africa Renewable Chemicals Analysis, Insights and Forecast, 2020-2032
- 10.1. Market Analysis, Insights and Forecast - by Application
- 10.1.1. Transportation
- 10.1.2. Textiles
- 10.1.3. Food
- 10.1.4. Others
- 10.2. Market Analysis, Insights and Forecast - by Type
- 10.2.1. Bioethanol
- 10.2.2. Biodiesel
- 10.2.3. Biochemicals
- 10.1. Market Analysis, Insights and Forecast - by Application
- 11. Asia Pacific Renewable Chemicals Analysis, Insights and Forecast, 2020-2032
- 11.1. Market Analysis, Insights and Forecast - by Application
- 11.1.1. Transportation
- 11.1.2. Textiles
- 11.1.3. Food
- 11.1.4. Others
- 11.2. Market Analysis, Insights and Forecast - by Type
- 11.2.1. Bioethanol
- 11.2.2. Biodiesel
- 11.2.3. Biochemicals
- 11.1. Market Analysis, Insights and Forecast - by Application
- 12. Competitive Analysis
- 12.1. Company Profiles
- 12.1.1 Renewable ChemicalsRaízen
- 12.1.1.1. Company Overview
- 12.1.1.2. Products
- 12.1.1.3. Company Financials
- 12.1.1.4. SWOT Analysis
- 12.1.2 Valero Renewable Fuels Company
- 12.1.2.1. Company Overview
- 12.1.2.2. Products
- 12.1.2.3. Company Financials
- 12.1.2.4. SWOT Analysis
- 12.1.3 ADM
- 12.1.3.1. Company Overview
- 12.1.3.2. Products
- 12.1.3.3. Company Financials
- 12.1.3.4. SWOT Analysis
- 12.1.4 POET
- 12.1.4.1. Company Overview
- 12.1.4.2. Products
- 12.1.4.3. Company Financials
- 12.1.4.4. SWOT Analysis
- 12.1.5 BP Bunge Bioenergia
- 12.1.5.1. Company Overview
- 12.1.5.2. Products
- 12.1.5.3. Company Financials
- 12.1.5.4. SWOT Analysis
- 12.1.6 Green Plains
- 12.1.6.1. Company Overview
- 12.1.6.2. Products
- 12.1.6.3. Company Financials
- 12.1.6.4. SWOT Analysis
- 12.1.7 Flint Hills Resource
- 12.1.7.1. Company Overview
- 12.1.7.2. Products
- 12.1.7.3. Company Financials
- 12.1.7.4. SWOT Analysis
- 12.1.8 Cargill
- 12.1.8.1. Company Overview
- 12.1.8.2. Products
- 12.1.8.3. Company Financials
- 12.1.8.4. SWOT Analysis
- 12.1.9 CropEnergies AG
- 12.1.9.1. Company Overview
- 12.1.9.2. Products
- 12.1.9.3. Company Financials
- 12.1.9.4. SWOT Analysis
- 12.1.10 Diester Industries
- 12.1.10.1. Company Overview
- 12.1.10.2. Products
- 12.1.10.3. Company Financials
- 12.1.10.4. SWOT Analysis
- 12.1.11 Neste Oil Rotterdam
- 12.1.11.1. Company Overview
- 12.1.11.2. Products
- 12.1.11.3. Company Financials
- 12.1.11.4. SWOT Analysis
- 12.1.12 Renewable Energy Group
- 12.1.12.1. Company Overview
- 12.1.12.2. Products
- 12.1.12.3. Company Financials
- 12.1.12.4. SWOT Analysis
- 12.1.13 COFCO
- 12.1.13.1. Company Overview
- 12.1.13.2. Products
- 12.1.13.3. Company Financials
- 12.1.13.4. SWOT Analysis
- 12.1.14 RBF Port Neches
- 12.1.14.1. Company Overview
- 12.1.14.2. Products
- 12.1.14.3. Company Financials
- 12.1.14.4. SWOT Analysis
- 12.1.15 Aemetis
- 12.1.15.1. Company Overview
- 12.1.15.2. Products
- 12.1.15.3. Company Financials
- 12.1.15.4. SWOT Analysis
- 12.1.16 Louis Dreyfus
- 12.1.16.1. Company Overview
- 12.1.16.2. Products
- 12.1.16.3. Company Financials
- 12.1.16.4. SWOT Analysis
- 12.1.17 BASF
- 12.1.17.1. Company Overview
- 12.1.17.2. Products
- 12.1.17.3. Company Financials
- 12.1.17.4. SWOT Analysis
- 12.1.18 Arkema
- 12.1.18.1. Company Overview
- 12.1.18.2. Products
- 12.1.18.3. Company Financials
- 12.1.18.4. SWOT Analysis
- 12.1.1 Renewable ChemicalsRaízen
- 12.2. Market Entropy
- 12.2.1 Company's Key Areas Served
- 12.2.2 Recent Developments
- 12.3. Company Market Share Analysis 2025
- 12.3.1 Top 5 Companies Market Share Analysis
- 12.3.2 Top 3 Companies Market Share Analysis
- 12.4. List of Potential Customers
- 13. Research Methodology
List of Figures
- Figure 1: Global Renewable Chemicals Revenue Breakdown (million, %) by Region 2025 & 2033
- Figure 2: North America Renewable Chemicals Revenue (million), by Application 2025 & 2033
- Figure 3: North America Renewable Chemicals Revenue Share (%), by Application 2025 & 2033
- Figure 4: North America Renewable Chemicals Revenue (million), by Type 2025 & 2033
- Figure 5: North America Renewable Chemicals Revenue Share (%), by Type 2025 & 2033
- Figure 6: North America Renewable Chemicals Revenue (million), by Country 2025 & 2033
- Figure 7: North America Renewable Chemicals Revenue Share (%), by Country 2025 & 2033
- Figure 8: South America Renewable Chemicals Revenue (million), by Application 2025 & 2033
- Figure 9: South America Renewable Chemicals Revenue Share (%), by Application 2025 & 2033
- Figure 10: South America Renewable Chemicals Revenue (million), by Type 2025 & 2033
- Figure 11: South America Renewable Chemicals Revenue Share (%), by Type 2025 & 2033
- Figure 12: South America Renewable Chemicals Revenue (million), by Country 2025 & 2033
- Figure 13: South America Renewable Chemicals Revenue Share (%), by Country 2025 & 2033
- Figure 14: Europe Renewable Chemicals Revenue (million), by Application 2025 & 2033
- Figure 15: Europe Renewable Chemicals Revenue Share (%), by Application 2025 & 2033
- Figure 16: Europe Renewable Chemicals Revenue (million), by Type 2025 & 2033
- Figure 17: Europe Renewable Chemicals Revenue Share (%), by Type 2025 & 2033
- Figure 18: Europe Renewable Chemicals Revenue (million), by Country 2025 & 2033
- Figure 19: Europe Renewable Chemicals Revenue Share (%), by Country 2025 & 2033
- Figure 20: Middle East & Africa Renewable Chemicals Revenue (million), by Application 2025 & 2033
- Figure 21: Middle East & Africa Renewable Chemicals Revenue Share (%), by Application 2025 & 2033
- Figure 22: Middle East & Africa Renewable Chemicals Revenue (million), by Type 2025 & 2033
- Figure 23: Middle East & Africa Renewable Chemicals Revenue Share (%), by Type 2025 & 2033
- Figure 24: Middle East & Africa Renewable Chemicals Revenue (million), by Country 2025 & 2033
- Figure 25: Middle East & Africa Renewable Chemicals Revenue Share (%), by Country 2025 & 2033
- Figure 26: Asia Pacific Renewable Chemicals Revenue (million), by Application 2025 & 2033
- Figure 27: Asia Pacific Renewable Chemicals Revenue Share (%), by Application 2025 & 2033
- Figure 28: Asia Pacific Renewable Chemicals Revenue (million), by Type 2025 & 2033
- Figure 29: Asia Pacific Renewable Chemicals Revenue Share (%), by Type 2025 & 2033
- Figure 30: Asia Pacific Renewable Chemicals Revenue (million), by Country 2025 & 2033
- Figure 31: Asia Pacific Renewable Chemicals Revenue Share (%), by Country 2025 & 2033
List of Tables
- Table 1: Global Renewable Chemicals Revenue million Forecast, by Application 2020 & 2033
- Table 2: Global Renewable Chemicals Revenue million Forecast, by Type 2020 & 2033
- Table 3: Global Renewable Chemicals Revenue million Forecast, by Region 2020 & 2033
- Table 4: Global Renewable Chemicals Revenue million Forecast, by Application 2020 & 2033
- Table 5: Global Renewable Chemicals Revenue million Forecast, by Type 2020 & 2033
- Table 6: Global Renewable Chemicals Revenue million Forecast, by Country 2020 & 2033
- Table 7: United States Renewable Chemicals Revenue (million) Forecast, by Application 2020 & 2033
- Table 8: Canada Renewable Chemicals Revenue (million) Forecast, by Application 2020 & 2033
- Table 9: Mexico Renewable Chemicals Revenue (million) Forecast, by Application 2020 & 2033
- Table 10: Global Renewable Chemicals Revenue million Forecast, by Application 2020 & 2033
- Table 11: Global Renewable Chemicals Revenue million Forecast, by Type 2020 & 2033
- Table 12: Global Renewable Chemicals Revenue million Forecast, by Country 2020 & 2033
- Table 13: Brazil Renewable Chemicals Revenue (million) Forecast, by Application 2020 & 2033
- Table 14: Argentina Renewable Chemicals Revenue (million) Forecast, by Application 2020 & 2033
- Table 15: Rest of South America Renewable Chemicals Revenue (million) Forecast, by Application 2020 & 2033
- Table 16: Global Renewable Chemicals Revenue million Forecast, by Application 2020 & 2033
- Table 17: Global Renewable Chemicals Revenue million Forecast, by Type 2020 & 2033
- Table 18: Global Renewable Chemicals Revenue million Forecast, by Country 2020 & 2033
- Table 19: United Kingdom Renewable Chemicals Revenue (million) Forecast, by Application 2020 & 2033
- Table 20: Germany Renewable Chemicals Revenue (million) Forecast, by Application 2020 & 2033
- Table 21: France Renewable Chemicals Revenue (million) Forecast, by Application 2020 & 2033
- Table 22: Italy Renewable Chemicals Revenue (million) Forecast, by Application 2020 & 2033
- Table 23: Spain Renewable Chemicals Revenue (million) Forecast, by Application 2020 & 2033
- Table 24: Russia Renewable Chemicals Revenue (million) Forecast, by Application 2020 & 2033
- Table 25: Benelux Renewable Chemicals Revenue (million) Forecast, by Application 2020 & 2033
- Table 26: Nordics Renewable Chemicals Revenue (million) Forecast, by Application 2020 & 2033
- Table 27: Rest of Europe Renewable Chemicals Revenue (million) Forecast, by Application 2020 & 2033
- Table 28: Global Renewable Chemicals Revenue million Forecast, by Application 2020 & 2033
- Table 29: Global Renewable Chemicals Revenue million Forecast, by Type 2020 & 2033
- Table 30: Global Renewable Chemicals Revenue million Forecast, by Country 2020 & 2033
- Table 31: Turkey Renewable Chemicals Revenue (million) Forecast, by Application 2020 & 2033
- Table 32: Israel Renewable Chemicals Revenue (million) Forecast, by Application 2020 & 2033
- Table 33: GCC Renewable Chemicals Revenue (million) Forecast, by Application 2020 & 2033
- Table 34: North Africa Renewable Chemicals Revenue (million) Forecast, by Application 2020 & 2033
- Table 35: South Africa Renewable Chemicals Revenue (million) Forecast, by Application 2020 & 2033
- Table 36: Rest of Middle East & Africa Renewable Chemicals Revenue (million) Forecast, by Application 2020 & 2033
- Table 37: Global Renewable Chemicals Revenue million Forecast, by Application 2020 & 2033
- Table 38: Global Renewable Chemicals Revenue million Forecast, by Type 2020 & 2033
- Table 39: Global Renewable Chemicals Revenue million Forecast, by Country 2020 & 2033
- Table 40: China Renewable Chemicals Revenue (million) Forecast, by Application 2020 & 2033
- Table 41: India Renewable Chemicals Revenue (million) Forecast, by Application 2020 & 2033
- Table 42: Japan Renewable Chemicals Revenue (million) Forecast, by Application 2020 & 2033
- Table 43: South Korea Renewable Chemicals Revenue (million) Forecast, by Application 2020 & 2033
- Table 44: ASEAN Renewable Chemicals Revenue (million) Forecast, by Application 2020 & 2033
- Table 45: Oceania Renewable Chemicals Revenue (million) Forecast, by Application 2020 & 2033
- Table 46: Rest of Asia Pacific Renewable Chemicals Revenue (million) Forecast, by Application 2020 & 2033
Frequently Asked Questions
1. What is the projected Compound Annual Growth Rate (CAGR) of the Renewable Chemicals?
The projected CAGR is approximately 9.8%.
2. Which companies are prominent players in the Renewable Chemicals?
Key companies in the market include Renewable ChemicalsRaízen, Valero Renewable Fuels Company, ADM, POET, BP Bunge Bioenergia, Green Plains, Flint Hills Resource, Cargill, CropEnergies AG, Diester Industries, Neste Oil Rotterdam, Renewable Energy Group, COFCO, RBF Port Neches, Aemetis, Louis Dreyfus, BASF, Arkema.
3. What are the main segments of the Renewable Chemicals?
The market segments include Application, Type.
4. Can you provide details about the market size?
The market size is estimated to be USD 265840 million as of 2022.
5. What are some drivers contributing to market growth?
N/A
6. What are the notable trends driving market growth?
N/A
7. Are there any restraints impacting market growth?
N/A
8. Can you provide examples of recent developments in the market?
N/A
9. What pricing options are available for accessing the report?
Pricing options include single-user, multi-user, and enterprise licenses priced at USD 5900.00, USD 8850.00, and USD 11800.00 respectively.
10. Is the market size provided in terms of value or volume?
The market size is provided in terms of value, measured in million.
11. Are there any specific market keywords associated with the report?
Yes, the market keyword associated with the report is "Renewable Chemicals," which aids in identifying and referencing the specific market segment covered.
12. How do I determine which pricing option suits my needs best?
The pricing options vary based on user requirements and access needs. Individual users may opt for single-user licenses, while businesses requiring broader access may choose multi-user or enterprise licenses for cost-effective access to the report.
13. Are there any additional resources or data provided in the Renewable Chemicals report?
While the report offers comprehensive insights, it's advisable to review the specific contents or supplementary materials provided to ascertain if additional resources or data are available.
14. How can I stay updated on further developments or reports in the Renewable Chemicals?
To stay informed about further developments, trends, and reports in the Renewable Chemicals, consider subscribing to industry newsletters, following relevant companies and organizations, or regularly checking reputable industry news sources and publications.
Methodology
Step 1 - Identification of Relevant Samples Size from Population Database


Step 2 - Approaches for Defining Global Market Size (Value, Volume* & Price*)

Note*: In applicable scenarios
Step 3 - Data Sources
Primary Research
- Web Analytics
- Survey Reports
- Research Institute
- Latest Research Reports
- Opinion Leaders
Secondary Research
- Annual Reports
- White Paper
- Latest Press Release
- Industry Association
- Paid Database
- Investor Presentations

Step 4 - Data Triangulation
Involves using different sources of information in order to increase the validity of a study
These sources are likely to be stakeholders in a program - participants, other researchers, program staff, other community members, and so on.
Then we put all data in single framework & apply various statistical tools to find out the dynamic on the market.
During the analysis stage, feedback from the stakeholder groups would be compared to determine areas of agreement as well as areas of divergence