
Key Insights
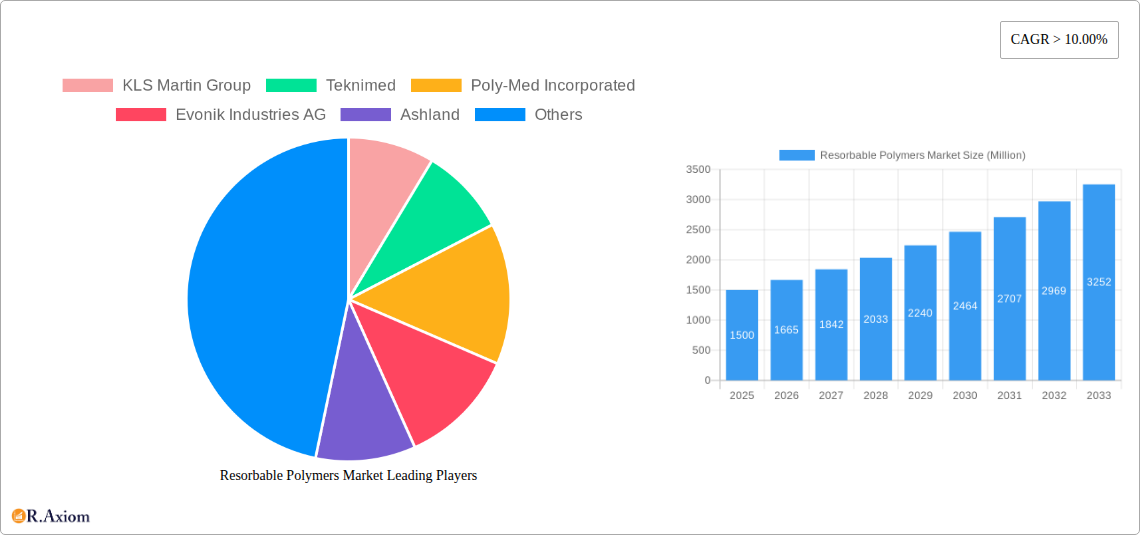
The resorbable polymers market is experiencing robust growth, driven by the increasing demand for biodegradable and biocompatible materials in various medical applications. The market's Compound Annual Growth Rate (CAGR) exceeding 10% signifies a significant expansion projected through 2033. Key drivers include the rising prevalence of chronic diseases necessitating minimally invasive surgeries and implants, coupled with the growing preference for materials that eliminate the need for a second surgery for implant removal. The substantial growth is further fueled by ongoing advancements in polymer chemistry leading to improved biodegradability, biocompatibility, and mechanical properties. Significant market segments include Polylactic Acid (PLA), Polyglycolic Acid (PGA), and Polycaprolactone (PCL), each exhibiting unique properties suitable for specific applications like drug delivery systems and orthopedic implants. The leading regional markets are North America and Europe, driven by strong healthcare infrastructure and regulatory frameworks. However, the Asia-Pacific region is expected to witness substantial growth due to increasing healthcare expenditure and a burgeoning medical device industry. Competition within the market is intense, with established players like KLS Martin Group, Teknimed, and Evonik Industries AG alongside emerging companies continuously innovating to capture market share. Challenges include the relatively high cost of production compared to conventional polymers and the need for stringent regulatory approvals for medical applications.
Despite these challenges, the long-term outlook remains positive. The market is poised for further expansion as research and development efforts continue to improve the performance and reduce the cost of resorbable polymers. The increasing focus on personalized medicine and the development of advanced drug delivery systems are expected to significantly boost market growth. Furthermore, the growing adoption of minimally invasive surgical procedures and the rising demand for biodegradable sutures and scaffolds are anticipated to propel the market forward. The expanding application areas in tissue engineering and regenerative medicine further contribute to the optimistic forecast, suggesting a substantial market opportunity for manufacturers and investors.
Resorbable Polymers Market: A Comprehensive Analysis (2019-2033)
This comprehensive report provides a detailed analysis of the global Resorbable Polymers market, offering invaluable insights for stakeholders seeking to navigate this dynamic landscape. The study covers the period from 2019 to 2033, with 2025 serving as the base and estimated year. The report meticulously examines market concentration, innovation, trends, dominant segments, product developments, and future opportunities, providing actionable intelligence for informed decision-making. The market is valued at xx Million in 2025 and is projected to reach xx Million by 2033, exhibiting a CAGR of xx% during the forecast period (2025-2033).
Resorbable Polymers Market Market Concentration & Innovation
The Resorbable Polymers market exhibits a moderately consolidated structure, with a few key players holding significant market share. While precise market share figures for individual companies are proprietary data, Evonik Industries AG, Ashland, and KLS Martin Group are recognized as major players. The market is characterized by ongoing innovation driven by the increasing demand for biodegradable and biocompatible materials in various applications. Regulatory frameworks, particularly those related to biocompatibility and safety, significantly influence market dynamics. Product substitutes, such as non-absorbable polymers, present competitive challenges. End-user trends toward minimally invasive procedures and personalized medicine are fueling demand for advanced resorbable polymer technologies. Mergers and acquisitions (M&A) activity, exemplified by Evonik’s acquisition of LACTEL Absorbable Polymers in January 2021, underscore the strategic importance of this market. The total value of M&A deals in the Resorbable Polymers market during the historical period (2019-2024) is estimated at xx Million.
- Market Concentration: Moderately consolidated, with several key players dominating.
- Innovation Drivers: Demand for biodegradable materials, minimally invasive procedures, personalized medicine.
- Regulatory Frameworks: Stringent regulations on biocompatibility and safety.
- Product Substitutes: Non-absorbable polymers pose a competitive threat.
- M&A Activity: Significant activity, reflecting the market's strategic importance (e.g., Evonik’s LACTEL acquisition).
Resorbable Polymers Market Industry Trends & Insights
The Resorbable Polymers market is experiencing robust growth, driven by several factors. The rising prevalence of chronic diseases requiring implantable devices fuels demand for biocompatible and biodegradable materials that eliminate the need for secondary surgeries for device removal. Technological advancements in polymer synthesis and processing are enabling the development of novel materials with improved biodegradability, mechanical strength, and biocompatibility profiles. Consumer preferences are shifting towards less invasive procedures and improved patient outcomes, driving adoption of resorbable polymers. Competitive dynamics are characterized by ongoing innovation, strategic alliances, and M&A activity. The market penetration of resorbable polymers in various applications is gradually increasing, particularly in orthopedics and drug delivery. The market is expected to witness continuous innovation in material formulations and applications in the coming years.

Dominant Markets & Segments in Resorbable Polymers Market
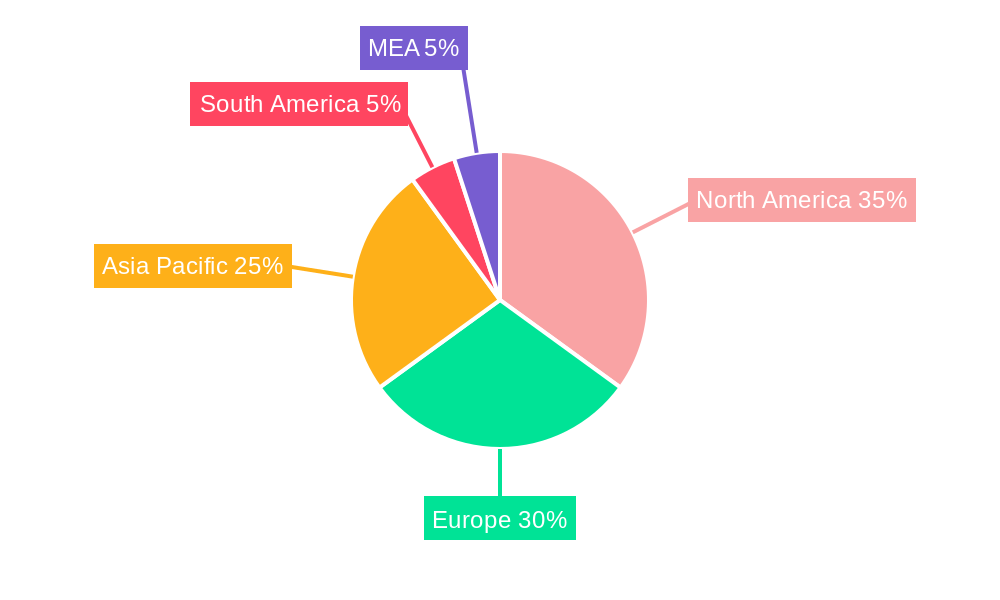
The North American region currently dominates the Resorbable Polymers market due to the high prevalence of chronic diseases, advanced healthcare infrastructure, and substantial investments in biomedical research and development. Within materials, Polylactic Acid (PLA) and Polyglycolic Acid (PGA) hold significant market share, driven by their established safety profiles and wide range of applications. The drug delivery segment shows strong growth potential, propelled by advancements in controlled drug release technologies.
- Leading Region: North America
- Dominant Material: Polylactic Acid (PLA) and Polyglycolic Acid (PGA)
- Fastest-Growing Application: Drug Delivery
Key Drivers for North American Dominance:
- Advanced healthcare infrastructure
- High prevalence of chronic diseases
- Significant R&D investments
- Stringent regulatory frameworks driving quality and innovation
Key Drivers for PLA/PGA Dominance:
- Established safety profiles
- Versatile applications
- Cost-effectiveness compared to other materials
Resorbable Polymers Market Product Developments
Recent product innovations focus on enhancing biodegradability rates, mechanical properties, and biocompatibility of resorbable polymers. New formulations are being developed for specific applications, such as targeted drug delivery and bone tissue engineering. Companies are emphasizing competitive advantages through proprietary material formulations and manufacturing processes, leading to improved product performance and reduced costs. This focus on specialized products caters to the growing demand for personalized medicine and improved patient outcomes.
Report Scope & Segmentation Analysis
This report segments the Resorbable Polymers market by material type (Polylactic Acid (PLA), Polyglycolic Acid (PGA), Polycaprolactone (PCL), PGA/PLA Copolymers) and application (Drug Delivery, Orthopedics). Each segment’s growth projections, market sizes, and competitive dynamics are thoroughly analyzed. The PLA segment currently holds a major market share, but PCL and PGA/PLA copolymers are anticipated to experience significant growth due to their improved properties. Within applications, the orthopedics segment is substantial, while the drug delivery segment is projected to exhibit high growth in the forecast period.
Key Drivers of Resorbable Polymers Market Growth
The Resorbable Polymers market is propelled by several key factors. The increasing prevalence of chronic diseases requiring implantable devices fuels demand for resorbable alternatives. Technological advancements, including the development of new polymer formulations with improved properties, are driving market expansion. Favorable regulatory frameworks supporting the adoption of biocompatible materials further stimulate growth. Lastly, the rising consumer preference for minimally invasive procedures also fuels market expansion.
Challenges in the Resorbable Polymers Market Sector
Several challenges hinder market growth. Stringent regulatory approvals for new materials and devices increase the time and cost associated with product launches. Variations in material properties and biodegradation rates across different batches pose manufacturing challenges. Competitive pressures from established players and emerging entrants necessitate continuous innovation. Supply chain disruptions impacting raw material availability also present challenges, potentially impacting production and market supply.
Emerging Opportunities in Resorbable Polymers Market
Emerging opportunities include the development of novel resorbable polymer formulations for tissue engineering and regenerative medicine applications. Growing interest in personalized medicine necessitates tailoring materials to individual patient needs. Expansion into emerging markets with a rising need for advanced medical devices presents significant growth prospects. The development of sustainable and environmentally friendly resorbable polymers also presents a compelling opportunity.
Leading Players in the Resorbable Polymers Market Market
- KLS Martin Group
- Teknimed
- Poly-Med Incorporated
- Evonik Industries AG
- Ashland
- Biogeneral
- Foster Corporation
- CORBION
Key Developments in Resorbable Polymers Market Industry
- Jan 2021: Evonik announced the closing of the LACTEL Absorbable Polymers acquisition from DURECT Corporation. This acquisition significantly expanded Evonik’s portfolio of resorbable polymer products and strengthened its market position.
Strategic Outlook for Resorbable Polymers Market Market
The Resorbable Polymers market presents a promising outlook, driven by continuous technological advancements, the increasing demand for biocompatible materials in various medical applications, and expanding adoption in emerging markets. The development of innovative materials with improved biodegradability, mechanical strength, and biocompatibility will be key to sustaining market growth. Strategic partnerships and collaborations will play a crucial role in accelerating product development and market penetration.
Resorbable Polymers Market Segmentation
-
1. Material
- 1.1. Polylactic Acid (PLA)
- 1.2. Polyglycolic Acid (PGA)
- 1.3. Polycaprolactone (PCL)
- 1.4. PGA/PLA Copolymers
-
2. Application
- 2.1. Drug Delivery
- 2.2. Orthopedics
Resorbable Polymers Market Segmentation By Geography
-
1. Asia Pacific
- 1.1. China
- 1.2. India
- 1.3. Japan
- 1.4. South Korea
- 1.5. Rest of Asia Pacific
-
2. North America
- 2.1. United States
- 2.2. Canada
- 2.3. Mexico
-
3. Europe
- 3.1. Germany
- 3.2. United Kingdom
- 3.3. Italy
- 3.4. France
- 3.5. Rest of Europe
-
4. South America
- 4.1. Brazil
- 4.2. Argentina
- 4.3. Rest of South America
-
5. Middle East & Africa
- 5.1. UAE
- 5.2. Saudi Arabia
- 5.3. South Africa
- 5.4. Rest of Middle East & Africa
Resorbable Polymers Market REPORT HIGHLIGHTS
| Aspects | Details |
|---|---|
| Study Period | 2019-2033 |
| Base Year | 2024 |
| Estimated Year | 2025 |
| Forecast Period | 2025-2033 |
| Historical Period | 2019-2024 |
| Growth Rate | CAGR of > 10.00% from 2019-2033 |
| Segmentation |
|
Table of Contents
- 1. Introduction
- 1.1. Research Scope
- 1.2. Market Segmentation
- 1.3. Research Methodology
- 1.4. Definitions and Assumptions
- 2. Executive Summary
- 2.1. Introduction
- 3. Market Dynamics
- 3.1. Introduction
- 3.2. Market Drivers
- 3.2.1. Growing Demand from Medical Industry; Other Drivers
- 3.3. Market Restrains
- 3.3.1. Other Restraints
- 3.4. Market Trends
- 3.4.1. Orthopedics to Dominate the Market
- 4. Market Factor Analysis
- 4.1. Porters Five Forces
- 4.2. Supply/Value Chain
- 4.3. PESTEL analysis
- 4.4. Market Entropy
- 4.5. Patent/Trademark Analysis
- 5. Global Resorbable Polymers Market Analysis, Insights and Forecast, 2019-2031
- 5.1. Market Analysis, Insights and Forecast - by Material
- 5.1.1. Polylactic Acid (PLA)
- 5.1.2. Polyglycolic Acid (PGA)
- 5.1.3. Polycaprolactone (PCL)
- 5.1.4. PGA/PLA Copolymers
- 5.2. Market Analysis, Insights and Forecast - by Application
- 5.2.1. Drug Delivery
- 5.2.2. Orthopedics
- 5.3. Market Analysis, Insights and Forecast - by Region
- 5.3.1. Asia Pacific
- 5.3.2. North America
- 5.3.3. Europe
- 5.3.4. South America
- 5.3.5. Middle East & Africa
- 5.1. Market Analysis, Insights and Forecast - by Material
- 6. Asia Pacific Resorbable Polymers Market Analysis, Insights and Forecast, 2019-2031
- 6.1. Market Analysis, Insights and Forecast - by Material
- 6.1.1. Polylactic Acid (PLA)
- 6.1.2. Polyglycolic Acid (PGA)
- 6.1.3. Polycaprolactone (PCL)
- 6.1.4. PGA/PLA Copolymers
- 6.2. Market Analysis, Insights and Forecast - by Application
- 6.2.1. Drug Delivery
- 6.2.2. Orthopedics
- 6.1. Market Analysis, Insights and Forecast - by Material
- 7. North America Resorbable Polymers Market Analysis, Insights and Forecast, 2019-2031
- 7.1. Market Analysis, Insights and Forecast - by Material
- 7.1.1. Polylactic Acid (PLA)
- 7.1.2. Polyglycolic Acid (PGA)
- 7.1.3. Polycaprolactone (PCL)
- 7.1.4. PGA/PLA Copolymers
- 7.2. Market Analysis, Insights and Forecast - by Application
- 7.2.1. Drug Delivery
- 7.2.2. Orthopedics
- 7.1. Market Analysis, Insights and Forecast - by Material
- 8. Europe Resorbable Polymers Market Analysis, Insights and Forecast, 2019-2031
- 8.1. Market Analysis, Insights and Forecast - by Material
- 8.1.1. Polylactic Acid (PLA)
- 8.1.2. Polyglycolic Acid (PGA)
- 8.1.3. Polycaprolactone (PCL)
- 8.1.4. PGA/PLA Copolymers
- 8.2. Market Analysis, Insights and Forecast - by Application
- 8.2.1. Drug Delivery
- 8.2.2. Orthopedics
- 8.1. Market Analysis, Insights and Forecast - by Material
- 9. South America Resorbable Polymers Market Analysis, Insights and Forecast, 2019-2031
- 9.1. Market Analysis, Insights and Forecast - by Material
- 9.1.1. Polylactic Acid (PLA)
- 9.1.2. Polyglycolic Acid (PGA)
- 9.1.3. Polycaprolactone (PCL)
- 9.1.4. PGA/PLA Copolymers
- 9.2. Market Analysis, Insights and Forecast - by Application
- 9.2.1. Drug Delivery
- 9.2.2. Orthopedics
- 9.1. Market Analysis, Insights and Forecast - by Material
- 10. Middle East & Africa Resorbable Polymers Market Analysis, Insights and Forecast, 2019-2031
- 10.1. Market Analysis, Insights and Forecast - by Material
- 10.1.1. Polylactic Acid (PLA)
- 10.1.2. Polyglycolic Acid (PGA)
- 10.1.3. Polycaprolactone (PCL)
- 10.1.4. PGA/PLA Copolymers
- 10.2. Market Analysis, Insights and Forecast - by Application
- 10.2.1. Drug Delivery
- 10.2.2. Orthopedics
- 10.1. Market Analysis, Insights and Forecast - by Material
- 11. North America Resorbable Polymers Market Analysis, Insights and Forecast, 2019-2031
- 11.1. Market Analysis, Insights and Forecast - By Country/Sub-region
- 11.1.1 United States
- 11.1.2 Canada
- 11.1.3 Mexico
- 12. Europe Resorbable Polymers Market Analysis, Insights and Forecast, 2019-2031
- 12.1. Market Analysis, Insights and Forecast - By Country/Sub-region
- 12.1.1 Germany
- 12.1.2 United Kingdom
- 12.1.3 France
- 12.1.4 Spain
- 12.1.5 Italy
- 12.1.6 Spain
- 12.1.7 Belgium
- 12.1.8 Netherland
- 12.1.9 Nordics
- 12.1.10 Rest of Europe
- 13. Asia Pacific Resorbable Polymers Market Analysis, Insights and Forecast, 2019-2031
- 13.1. Market Analysis, Insights and Forecast - By Country/Sub-region
- 13.1.1 China
- 13.1.2 Japan
- 13.1.3 India
- 13.1.4 South Korea
- 13.1.5 Southeast Asia
- 13.1.6 Australia
- 13.1.7 Indonesia
- 13.1.8 Phillipes
- 13.1.9 Singapore
- 13.1.10 Thailandc
- 13.1.11 Rest of Asia Pacific
- 14. South America Resorbable Polymers Market Analysis, Insights and Forecast, 2019-2031
- 14.1. Market Analysis, Insights and Forecast - By Country/Sub-region
- 14.1.1 Brazil
- 14.1.2 Argentina
- 14.1.3 Peru
- 14.1.4 Chile
- 14.1.5 Colombia
- 14.1.6 Ecuador
- 14.1.7 Venezuela
- 14.1.8 Rest of South America
- 15. North America Resorbable Polymers Market Analysis, Insights and Forecast, 2019-2031
- 15.1. Market Analysis, Insights and Forecast - By Country/Sub-region
- 15.1.1 United States
- 15.1.2 Canada
- 15.1.3 Mexico
- 16. MEA Resorbable Polymers Market Analysis, Insights and Forecast, 2019-2031
- 16.1. Market Analysis, Insights and Forecast - By Country/Sub-region
- 16.1.1 United Arab Emirates
- 16.1.2 Saudi Arabia
- 16.1.3 South Africa
- 16.1.4 Rest of Middle East and Africa
- 17. Competitive Analysis
- 17.1. Global Market Share Analysis 2024
- 17.2. Company Profiles
- 17.2.1 KLS Martin Group
- 17.2.1.1. Overview
- 17.2.1.2. Products
- 17.2.1.3. SWOT Analysis
- 17.2.1.4. Recent Developments
- 17.2.1.5. Financials (Based on Availability)
- 17.2.2 Teknimed
- 17.2.2.1. Overview
- 17.2.2.2. Products
- 17.2.2.3. SWOT Analysis
- 17.2.2.4. Recent Developments
- 17.2.2.5. Financials (Based on Availability)
- 17.2.3 Poly-Med Incorporated
- 17.2.3.1. Overview
- 17.2.3.2. Products
- 17.2.3.3. SWOT Analysis
- 17.2.3.4. Recent Developments
- 17.2.3.5. Financials (Based on Availability)
- 17.2.4 Evonik Industries AG
- 17.2.4.1. Overview
- 17.2.4.2. Products
- 17.2.4.3. SWOT Analysis
- 17.2.4.4. Recent Developments
- 17.2.4.5. Financials (Based on Availability)
- 17.2.5 Ashland
- 17.2.5.1. Overview
- 17.2.5.2. Products
- 17.2.5.3. SWOT Analysis
- 17.2.5.4. Recent Developments
- 17.2.5.5. Financials (Based on Availability)
- 17.2.6 Biogeneral
- 17.2.6.1. Overview
- 17.2.6.2. Products
- 17.2.6.3. SWOT Analysis
- 17.2.6.4. Recent Developments
- 17.2.6.5. Financials (Based on Availability)
- 17.2.7 Foster Corporation
- 17.2.7.1. Overview
- 17.2.7.2. Products
- 17.2.7.3. SWOT Analysis
- 17.2.7.4. Recent Developments
- 17.2.7.5. Financials (Based on Availability)
- 17.2.8 CORBION
- 17.2.8.1. Overview
- 17.2.8.2. Products
- 17.2.8.3. SWOT Analysis
- 17.2.8.4. Recent Developments
- 17.2.8.5. Financials (Based on Availability)
- 17.2.1 KLS Martin Group
List of Figures
- Figure 1: Global Resorbable Polymers Market Revenue Breakdown (Million, %) by Region 2024 & 2032
- Figure 2: Global Resorbable Polymers Market Volume Breakdown (K Tons, %) by Region 2024 & 2032
- Figure 3: North America Resorbable Polymers Market Revenue (Million), by Country 2024 & 2032
- Figure 4: North America Resorbable Polymers Market Volume (K Tons), by Country 2024 & 2032
- Figure 5: North America Resorbable Polymers Market Revenue Share (%), by Country 2024 & 2032
- Figure 6: North America Resorbable Polymers Market Volume Share (%), by Country 2024 & 2032
- Figure 7: Europe Resorbable Polymers Market Revenue (Million), by Country 2024 & 2032
- Figure 8: Europe Resorbable Polymers Market Volume (K Tons), by Country 2024 & 2032
- Figure 9: Europe Resorbable Polymers Market Revenue Share (%), by Country 2024 & 2032
- Figure 10: Europe Resorbable Polymers Market Volume Share (%), by Country 2024 & 2032
- Figure 11: Asia Pacific Resorbable Polymers Market Revenue (Million), by Country 2024 & 2032
- Figure 12: Asia Pacific Resorbable Polymers Market Volume (K Tons), by Country 2024 & 2032
- Figure 13: Asia Pacific Resorbable Polymers Market Revenue Share (%), by Country 2024 & 2032
- Figure 14: Asia Pacific Resorbable Polymers Market Volume Share (%), by Country 2024 & 2032
- Figure 15: South America Resorbable Polymers Market Revenue (Million), by Country 2024 & 2032
- Figure 16: South America Resorbable Polymers Market Volume (K Tons), by Country 2024 & 2032
- Figure 17: South America Resorbable Polymers Market Revenue Share (%), by Country 2024 & 2032
- Figure 18: South America Resorbable Polymers Market Volume Share (%), by Country 2024 & 2032
- Figure 19: North America Resorbable Polymers Market Revenue (Million), by Country 2024 & 2032
- Figure 20: North America Resorbable Polymers Market Volume (K Tons), by Country 2024 & 2032
- Figure 21: North America Resorbable Polymers Market Revenue Share (%), by Country 2024 & 2032
- Figure 22: North America Resorbable Polymers Market Volume Share (%), by Country 2024 & 2032
- Figure 23: MEA Resorbable Polymers Market Revenue (Million), by Country 2024 & 2032
- Figure 24: MEA Resorbable Polymers Market Volume (K Tons), by Country 2024 & 2032
- Figure 25: MEA Resorbable Polymers Market Revenue Share (%), by Country 2024 & 2032
- Figure 26: MEA Resorbable Polymers Market Volume Share (%), by Country 2024 & 2032
- Figure 27: Asia Pacific Resorbable Polymers Market Revenue (Million), by Material 2024 & 2032
- Figure 28: Asia Pacific Resorbable Polymers Market Volume (K Tons), by Material 2024 & 2032
- Figure 29: Asia Pacific Resorbable Polymers Market Revenue Share (%), by Material 2024 & 2032
- Figure 30: Asia Pacific Resorbable Polymers Market Volume Share (%), by Material 2024 & 2032
- Figure 31: Asia Pacific Resorbable Polymers Market Revenue (Million), by Application 2024 & 2032
- Figure 32: Asia Pacific Resorbable Polymers Market Volume (K Tons), by Application 2024 & 2032
- Figure 33: Asia Pacific Resorbable Polymers Market Revenue Share (%), by Application 2024 & 2032
- Figure 34: Asia Pacific Resorbable Polymers Market Volume Share (%), by Application 2024 & 2032
- Figure 35: Asia Pacific Resorbable Polymers Market Revenue (Million), by Country 2024 & 2032
- Figure 36: Asia Pacific Resorbable Polymers Market Volume (K Tons), by Country 2024 & 2032
- Figure 37: Asia Pacific Resorbable Polymers Market Revenue Share (%), by Country 2024 & 2032
- Figure 38: Asia Pacific Resorbable Polymers Market Volume Share (%), by Country 2024 & 2032
- Figure 39: North America Resorbable Polymers Market Revenue (Million), by Material 2024 & 2032
- Figure 40: North America Resorbable Polymers Market Volume (K Tons), by Material 2024 & 2032
- Figure 41: North America Resorbable Polymers Market Revenue Share (%), by Material 2024 & 2032
- Figure 42: North America Resorbable Polymers Market Volume Share (%), by Material 2024 & 2032
- Figure 43: North America Resorbable Polymers Market Revenue (Million), by Application 2024 & 2032
- Figure 44: North America Resorbable Polymers Market Volume (K Tons), by Application 2024 & 2032
- Figure 45: North America Resorbable Polymers Market Revenue Share (%), by Application 2024 & 2032
- Figure 46: North America Resorbable Polymers Market Volume Share (%), by Application 2024 & 2032
- Figure 47: North America Resorbable Polymers Market Revenue (Million), by Country 2024 & 2032
- Figure 48: North America Resorbable Polymers Market Volume (K Tons), by Country 2024 & 2032
- Figure 49: North America Resorbable Polymers Market Revenue Share (%), by Country 2024 & 2032
- Figure 50: North America Resorbable Polymers Market Volume Share (%), by Country 2024 & 2032
- Figure 51: Europe Resorbable Polymers Market Revenue (Million), by Material 2024 & 2032
- Figure 52: Europe Resorbable Polymers Market Volume (K Tons), by Material 2024 & 2032
- Figure 53: Europe Resorbable Polymers Market Revenue Share (%), by Material 2024 & 2032
- Figure 54: Europe Resorbable Polymers Market Volume Share (%), by Material 2024 & 2032
- Figure 55: Europe Resorbable Polymers Market Revenue (Million), by Application 2024 & 2032
- Figure 56: Europe Resorbable Polymers Market Volume (K Tons), by Application 2024 & 2032
- Figure 57: Europe Resorbable Polymers Market Revenue Share (%), by Application 2024 & 2032
- Figure 58: Europe Resorbable Polymers Market Volume Share (%), by Application 2024 & 2032
- Figure 59: Europe Resorbable Polymers Market Revenue (Million), by Country 2024 & 2032
- Figure 60: Europe Resorbable Polymers Market Volume (K Tons), by Country 2024 & 2032
- Figure 61: Europe Resorbable Polymers Market Revenue Share (%), by Country 2024 & 2032
- Figure 62: Europe Resorbable Polymers Market Volume Share (%), by Country 2024 & 2032
- Figure 63: South America Resorbable Polymers Market Revenue (Million), by Material 2024 & 2032
- Figure 64: South America Resorbable Polymers Market Volume (K Tons), by Material 2024 & 2032
- Figure 65: South America Resorbable Polymers Market Revenue Share (%), by Material 2024 & 2032
- Figure 66: South America Resorbable Polymers Market Volume Share (%), by Material 2024 & 2032
- Figure 67: South America Resorbable Polymers Market Revenue (Million), by Application 2024 & 2032
- Figure 68: South America Resorbable Polymers Market Volume (K Tons), by Application 2024 & 2032
- Figure 69: South America Resorbable Polymers Market Revenue Share (%), by Application 2024 & 2032
- Figure 70: South America Resorbable Polymers Market Volume Share (%), by Application 2024 & 2032
- Figure 71: South America Resorbable Polymers Market Revenue (Million), by Country 2024 & 2032
- Figure 72: South America Resorbable Polymers Market Volume (K Tons), by Country 2024 & 2032
- Figure 73: South America Resorbable Polymers Market Revenue Share (%), by Country 2024 & 2032
- Figure 74: South America Resorbable Polymers Market Volume Share (%), by Country 2024 & 2032
- Figure 75: Middle East & Africa Resorbable Polymers Market Revenue (Million), by Material 2024 & 2032
- Figure 76: Middle East & Africa Resorbable Polymers Market Volume (K Tons), by Material 2024 & 2032
- Figure 77: Middle East & Africa Resorbable Polymers Market Revenue Share (%), by Material 2024 & 2032
- Figure 78: Middle East & Africa Resorbable Polymers Market Volume Share (%), by Material 2024 & 2032
- Figure 79: Middle East & Africa Resorbable Polymers Market Revenue (Million), by Application 2024 & 2032
- Figure 80: Middle East & Africa Resorbable Polymers Market Volume (K Tons), by Application 2024 & 2032
- Figure 81: Middle East & Africa Resorbable Polymers Market Revenue Share (%), by Application 2024 & 2032
- Figure 82: Middle East & Africa Resorbable Polymers Market Volume Share (%), by Application 2024 & 2032
- Figure 83: Middle East & Africa Resorbable Polymers Market Revenue (Million), by Country 2024 & 2032
- Figure 84: Middle East & Africa Resorbable Polymers Market Volume (K Tons), by Country 2024 & 2032
- Figure 85: Middle East & Africa Resorbable Polymers Market Revenue Share (%), by Country 2024 & 2032
- Figure 86: Middle East & Africa Resorbable Polymers Market Volume Share (%), by Country 2024 & 2032
List of Tables
- Table 1: Global Resorbable Polymers Market Revenue Million Forecast, by Region 2019 & 2032
- Table 2: Global Resorbable Polymers Market Volume K Tons Forecast, by Region 2019 & 2032
- Table 3: Global Resorbable Polymers Market Revenue Million Forecast, by Material 2019 & 2032
- Table 4: Global Resorbable Polymers Market Volume K Tons Forecast, by Material 2019 & 2032
- Table 5: Global Resorbable Polymers Market Revenue Million Forecast, by Application 2019 & 2032
- Table 6: Global Resorbable Polymers Market Volume K Tons Forecast, by Application 2019 & 2032
- Table 7: Global Resorbable Polymers Market Revenue Million Forecast, by Region 2019 & 2032
- Table 8: Global Resorbable Polymers Market Volume K Tons Forecast, by Region 2019 & 2032
- Table 9: Global Resorbable Polymers Market Revenue Million Forecast, by Country 2019 & 2032
- Table 10: Global Resorbable Polymers Market Volume K Tons Forecast, by Country 2019 & 2032
- Table 11: United States Resorbable Polymers Market Revenue (Million) Forecast, by Application 2019 & 2032
- Table 12: United States Resorbable Polymers Market Volume (K Tons) Forecast, by Application 2019 & 2032
- Table 13: Canada Resorbable Polymers Market Revenue (Million) Forecast, by Application 2019 & 2032
- Table 14: Canada Resorbable Polymers Market Volume (K Tons) Forecast, by Application 2019 & 2032
- Table 15: Mexico Resorbable Polymers Market Revenue (Million) Forecast, by Application 2019 & 2032
- Table 16: Mexico Resorbable Polymers Market Volume (K Tons) Forecast, by Application 2019 & 2032
- Table 17: Global Resorbable Polymers Market Revenue Million Forecast, by Country 2019 & 2032
- Table 18: Global Resorbable Polymers Market Volume K Tons Forecast, by Country 2019 & 2032
- Table 19: Germany Resorbable Polymers Market Revenue (Million) Forecast, by Application 2019 & 2032
- Table 20: Germany Resorbable Polymers Market Volume (K Tons) Forecast, by Application 2019 & 2032
- Table 21: United Kingdom Resorbable Polymers Market Revenue (Million) Forecast, by Application 2019 & 2032
- Table 22: United Kingdom Resorbable Polymers Market Volume (K Tons) Forecast, by Application 2019 & 2032
- Table 23: France Resorbable Polymers Market Revenue (Million) Forecast, by Application 2019 & 2032
- Table 24: France Resorbable Polymers Market Volume (K Tons) Forecast, by Application 2019 & 2032
- Table 25: Spain Resorbable Polymers Market Revenue (Million) Forecast, by Application 2019 & 2032
- Table 26: Spain Resorbable Polymers Market Volume (K Tons) Forecast, by Application 2019 & 2032
- Table 27: Italy Resorbable Polymers Market Revenue (Million) Forecast, by Application 2019 & 2032
- Table 28: Italy Resorbable Polymers Market Volume (K Tons) Forecast, by Application 2019 & 2032
- Table 29: Spain Resorbable Polymers Market Revenue (Million) Forecast, by Application 2019 & 2032
- Table 30: Spain Resorbable Polymers Market Volume (K Tons) Forecast, by Application 2019 & 2032
- Table 31: Belgium Resorbable Polymers Market Revenue (Million) Forecast, by Application 2019 & 2032
- Table 32: Belgium Resorbable Polymers Market Volume (K Tons) Forecast, by Application 2019 & 2032
- Table 33: Netherland Resorbable Polymers Market Revenue (Million) Forecast, by Application 2019 & 2032
- Table 34: Netherland Resorbable Polymers Market Volume (K Tons) Forecast, by Application 2019 & 2032
- Table 35: Nordics Resorbable Polymers Market Revenue (Million) Forecast, by Application 2019 & 2032
- Table 36: Nordics Resorbable Polymers Market Volume (K Tons) Forecast, by Application 2019 & 2032
- Table 37: Rest of Europe Resorbable Polymers Market Revenue (Million) Forecast, by Application 2019 & 2032
- Table 38: Rest of Europe Resorbable Polymers Market Volume (K Tons) Forecast, by Application 2019 & 2032
- Table 39: Global Resorbable Polymers Market Revenue Million Forecast, by Country 2019 & 2032
- Table 40: Global Resorbable Polymers Market Volume K Tons Forecast, by Country 2019 & 2032
- Table 41: China Resorbable Polymers Market Revenue (Million) Forecast, by Application 2019 & 2032
- Table 42: China Resorbable Polymers Market Volume (K Tons) Forecast, by Application 2019 & 2032
- Table 43: Japan Resorbable Polymers Market Revenue (Million) Forecast, by Application 2019 & 2032
- Table 44: Japan Resorbable Polymers Market Volume (K Tons) Forecast, by Application 2019 & 2032
- Table 45: India Resorbable Polymers Market Revenue (Million) Forecast, by Application 2019 & 2032
- Table 46: India Resorbable Polymers Market Volume (K Tons) Forecast, by Application 2019 & 2032
- Table 47: South Korea Resorbable Polymers Market Revenue (Million) Forecast, by Application 2019 & 2032
- Table 48: South Korea Resorbable Polymers Market Volume (K Tons) Forecast, by Application 2019 & 2032
- Table 49: Southeast Asia Resorbable Polymers Market Revenue (Million) Forecast, by Application 2019 & 2032
- Table 50: Southeast Asia Resorbable Polymers Market Volume (K Tons) Forecast, by Application 2019 & 2032
- Table 51: Australia Resorbable Polymers Market Revenue (Million) Forecast, by Application 2019 & 2032
- Table 52: Australia Resorbable Polymers Market Volume (K Tons) Forecast, by Application 2019 & 2032
- Table 53: Indonesia Resorbable Polymers Market Revenue (Million) Forecast, by Application 2019 & 2032
- Table 54: Indonesia Resorbable Polymers Market Volume (K Tons) Forecast, by Application 2019 & 2032
- Table 55: Phillipes Resorbable Polymers Market Revenue (Million) Forecast, by Application 2019 & 2032
- Table 56: Phillipes Resorbable Polymers Market Volume (K Tons) Forecast, by Application 2019 & 2032
- Table 57: Singapore Resorbable Polymers Market Revenue (Million) Forecast, by Application 2019 & 2032
- Table 58: Singapore Resorbable Polymers Market Volume (K Tons) Forecast, by Application 2019 & 2032
- Table 59: Thailandc Resorbable Polymers Market Revenue (Million) Forecast, by Application 2019 & 2032
- Table 60: Thailandc Resorbable Polymers Market Volume (K Tons) Forecast, by Application 2019 & 2032
- Table 61: Rest of Asia Pacific Resorbable Polymers Market Revenue (Million) Forecast, by Application 2019 & 2032
- Table 62: Rest of Asia Pacific Resorbable Polymers Market Volume (K Tons) Forecast, by Application 2019 & 2032
- Table 63: Global Resorbable Polymers Market Revenue Million Forecast, by Country 2019 & 2032
- Table 64: Global Resorbable Polymers Market Volume K Tons Forecast, by Country 2019 & 2032
- Table 65: Brazil Resorbable Polymers Market Revenue (Million) Forecast, by Application 2019 & 2032
- Table 66: Brazil Resorbable Polymers Market Volume (K Tons) Forecast, by Application 2019 & 2032
- Table 67: Argentina Resorbable Polymers Market Revenue (Million) Forecast, by Application 2019 & 2032
- Table 68: Argentina Resorbable Polymers Market Volume (K Tons) Forecast, by Application 2019 & 2032
- Table 69: Peru Resorbable Polymers Market Revenue (Million) Forecast, by Application 2019 & 2032
- Table 70: Peru Resorbable Polymers Market Volume (K Tons) Forecast, by Application 2019 & 2032
- Table 71: Chile Resorbable Polymers Market Revenue (Million) Forecast, by Application 2019 & 2032
- Table 72: Chile Resorbable Polymers Market Volume (K Tons) Forecast, by Application 2019 & 2032
- Table 73: Colombia Resorbable Polymers Market Revenue (Million) Forecast, by Application 2019 & 2032
- Table 74: Colombia Resorbable Polymers Market Volume (K Tons) Forecast, by Application 2019 & 2032
- Table 75: Ecuador Resorbable Polymers Market Revenue (Million) Forecast, by Application 2019 & 2032
- Table 76: Ecuador Resorbable Polymers Market Volume (K Tons) Forecast, by Application 2019 & 2032
- Table 77: Venezuela Resorbable Polymers Market Revenue (Million) Forecast, by Application 2019 & 2032
- Table 78: Venezuela Resorbable Polymers Market Volume (K Tons) Forecast, by Application 2019 & 2032
- Table 79: Rest of South America Resorbable Polymers Market Revenue (Million) Forecast, by Application 2019 & 2032
- Table 80: Rest of South America Resorbable Polymers Market Volume (K Tons) Forecast, by Application 2019 & 2032
- Table 81: Global Resorbable Polymers Market Revenue Million Forecast, by Country 2019 & 2032
- Table 82: Global Resorbable Polymers Market Volume K Tons Forecast, by Country 2019 & 2032
- Table 83: United States Resorbable Polymers Market Revenue (Million) Forecast, by Application 2019 & 2032
- Table 84: United States Resorbable Polymers Market Volume (K Tons) Forecast, by Application 2019 & 2032
- Table 85: Canada Resorbable Polymers Market Revenue (Million) Forecast, by Application 2019 & 2032
- Table 86: Canada Resorbable Polymers Market Volume (K Tons) Forecast, by Application 2019 & 2032
- Table 87: Mexico Resorbable Polymers Market Revenue (Million) Forecast, by Application 2019 & 2032
- Table 88: Mexico Resorbable Polymers Market Volume (K Tons) Forecast, by Application 2019 & 2032
- Table 89: Global Resorbable Polymers Market Revenue Million Forecast, by Country 2019 & 2032
- Table 90: Global Resorbable Polymers Market Volume K Tons Forecast, by Country 2019 & 2032
- Table 91: United Arab Emirates Resorbable Polymers Market Revenue (Million) Forecast, by Application 2019 & 2032
- Table 92: United Arab Emirates Resorbable Polymers Market Volume (K Tons) Forecast, by Application 2019 & 2032
- Table 93: Saudi Arabia Resorbable Polymers Market Revenue (Million) Forecast, by Application 2019 & 2032
- Table 94: Saudi Arabia Resorbable Polymers Market Volume (K Tons) Forecast, by Application 2019 & 2032
- Table 95: South Africa Resorbable Polymers Market Revenue (Million) Forecast, by Application 2019 & 2032
- Table 96: South Africa Resorbable Polymers Market Volume (K Tons) Forecast, by Application 2019 & 2032
- Table 97: Rest of Middle East and Africa Resorbable Polymers Market Revenue (Million) Forecast, by Application 2019 & 2032
- Table 98: Rest of Middle East and Africa Resorbable Polymers Market Volume (K Tons) Forecast, by Application 2019 & 2032
- Table 99: Global Resorbable Polymers Market Revenue Million Forecast, by Material 2019 & 2032
- Table 100: Global Resorbable Polymers Market Volume K Tons Forecast, by Material 2019 & 2032
- Table 101: Global Resorbable Polymers Market Revenue Million Forecast, by Application 2019 & 2032
- Table 102: Global Resorbable Polymers Market Volume K Tons Forecast, by Application 2019 & 2032
- Table 103: Global Resorbable Polymers Market Revenue Million Forecast, by Country 2019 & 2032
- Table 104: Global Resorbable Polymers Market Volume K Tons Forecast, by Country 2019 & 2032
- Table 105: China Resorbable Polymers Market Revenue (Million) Forecast, by Application 2019 & 2032
- Table 106: China Resorbable Polymers Market Volume (K Tons) Forecast, by Application 2019 & 2032
- Table 107: India Resorbable Polymers Market Revenue (Million) Forecast, by Application 2019 & 2032
- Table 108: India Resorbable Polymers Market Volume (K Tons) Forecast, by Application 2019 & 2032
- Table 109: Japan Resorbable Polymers Market Revenue (Million) Forecast, by Application 2019 & 2032
- Table 110: Japan Resorbable Polymers Market Volume (K Tons) Forecast, by Application 2019 & 2032
- Table 111: South Korea Resorbable Polymers Market Revenue (Million) Forecast, by Application 2019 & 2032
- Table 112: South Korea Resorbable Polymers Market Volume (K Tons) Forecast, by Application 2019 & 2032
- Table 113: Rest of Asia Pacific Resorbable Polymers Market Revenue (Million) Forecast, by Application 2019 & 2032
- Table 114: Rest of Asia Pacific Resorbable Polymers Market Volume (K Tons) Forecast, by Application 2019 & 2032
- Table 115: Global Resorbable Polymers Market Revenue Million Forecast, by Material 2019 & 2032
- Table 116: Global Resorbable Polymers Market Volume K Tons Forecast, by Material 2019 & 2032
- Table 117: Global Resorbable Polymers Market Revenue Million Forecast, by Application 2019 & 2032
- Table 118: Global Resorbable Polymers Market Volume K Tons Forecast, by Application 2019 & 2032
- Table 119: Global Resorbable Polymers Market Revenue Million Forecast, by Country 2019 & 2032
- Table 120: Global Resorbable Polymers Market Volume K Tons Forecast, by Country 2019 & 2032
- Table 121: United States Resorbable Polymers Market Revenue (Million) Forecast, by Application 2019 & 2032
- Table 122: United States Resorbable Polymers Market Volume (K Tons) Forecast, by Application 2019 & 2032
- Table 123: Canada Resorbable Polymers Market Revenue (Million) Forecast, by Application 2019 & 2032
- Table 124: Canada Resorbable Polymers Market Volume (K Tons) Forecast, by Application 2019 & 2032
- Table 125: Mexico Resorbable Polymers Market Revenue (Million) Forecast, by Application 2019 & 2032
- Table 126: Mexico Resorbable Polymers Market Volume (K Tons) Forecast, by Application 2019 & 2032
- Table 127: Global Resorbable Polymers Market Revenue Million Forecast, by Material 2019 & 2032
- Table 128: Global Resorbable Polymers Market Volume K Tons Forecast, by Material 2019 & 2032
- Table 129: Global Resorbable Polymers Market Revenue Million Forecast, by Application 2019 & 2032
- Table 130: Global Resorbable Polymers Market Volume K Tons Forecast, by Application 2019 & 2032
- Table 131: Global Resorbable Polymers Market Revenue Million Forecast, by Country 2019 & 2032
- Table 132: Global Resorbable Polymers Market Volume K Tons Forecast, by Country 2019 & 2032
- Table 133: Germany Resorbable Polymers Market Revenue (Million) Forecast, by Application 2019 & 2032
- Table 134: Germany Resorbable Polymers Market Volume (K Tons) Forecast, by Application 2019 & 2032
- Table 135: United Kingdom Resorbable Polymers Market Revenue (Million) Forecast, by Application 2019 & 2032
- Table 136: United Kingdom Resorbable Polymers Market Volume (K Tons) Forecast, by Application 2019 & 2032
- Table 137: Italy Resorbable Polymers Market Revenue (Million) Forecast, by Application 2019 & 2032
- Table 138: Italy Resorbable Polymers Market Volume (K Tons) Forecast, by Application 2019 & 2032
- Table 139: France Resorbable Polymers Market Revenue (Million) Forecast, by Application 2019 & 2032
- Table 140: France Resorbable Polymers Market Volume (K Tons) Forecast, by Application 2019 & 2032
- Table 141: Rest of Europe Resorbable Polymers Market Revenue (Million) Forecast, by Application 2019 & 2032
- Table 142: Rest of Europe Resorbable Polymers Market Volume (K Tons) Forecast, by Application 2019 & 2032
- Table 143: Global Resorbable Polymers Market Revenue Million Forecast, by Material 2019 & 2032
- Table 144: Global Resorbable Polymers Market Volume K Tons Forecast, by Material 2019 & 2032
- Table 145: Global Resorbable Polymers Market Revenue Million Forecast, by Application 2019 & 2032
- Table 146: Global Resorbable Polymers Market Volume K Tons Forecast, by Application 2019 & 2032
- Table 147: Global Resorbable Polymers Market Revenue Million Forecast, by Country 2019 & 2032
- Table 148: Global Resorbable Polymers Market Volume K Tons Forecast, by Country 2019 & 2032
- Table 149: Brazil Resorbable Polymers Market Revenue (Million) Forecast, by Application 2019 & 2032
- Table 150: Brazil Resorbable Polymers Market Volume (K Tons) Forecast, by Application 2019 & 2032
- Table 151: Argentina Resorbable Polymers Market Revenue (Million) Forecast, by Application 2019 & 2032
- Table 152: Argentina Resorbable Polymers Market Volume (K Tons) Forecast, by Application 2019 & 2032
- Table 153: Rest of South America Resorbable Polymers Market Revenue (Million) Forecast, by Application 2019 & 2032
- Table 154: Rest of South America Resorbable Polymers Market Volume (K Tons) Forecast, by Application 2019 & 2032
- Table 155: Global Resorbable Polymers Market Revenue Million Forecast, by Material 2019 & 2032
- Table 156: Global Resorbable Polymers Market Volume K Tons Forecast, by Material 2019 & 2032
- Table 157: Global Resorbable Polymers Market Revenue Million Forecast, by Application 2019 & 2032
- Table 158: Global Resorbable Polymers Market Volume K Tons Forecast, by Application 2019 & 2032
- Table 159: Global Resorbable Polymers Market Revenue Million Forecast, by Country 2019 & 2032
- Table 160: Global Resorbable Polymers Market Volume K Tons Forecast, by Country 2019 & 2032
- Table 161: UAE Resorbable Polymers Market Revenue (Million) Forecast, by Application 2019 & 2032
- Table 162: UAE Resorbable Polymers Market Volume (K Tons) Forecast, by Application 2019 & 2032
- Table 163: Saudi Arabia Resorbable Polymers Market Revenue (Million) Forecast, by Application 2019 & 2032
- Table 164: Saudi Arabia Resorbable Polymers Market Volume (K Tons) Forecast, by Application 2019 & 2032
- Table 165: South Africa Resorbable Polymers Market Revenue (Million) Forecast, by Application 2019 & 2032
- Table 166: South Africa Resorbable Polymers Market Volume (K Tons) Forecast, by Application 2019 & 2032
- Table 167: Rest of Middle East & Africa Resorbable Polymers Market Revenue (Million) Forecast, by Application 2019 & 2032
- Table 168: Rest of Middle East & Africa Resorbable Polymers Market Volume (K Tons) Forecast, by Application 2019 & 2032
Frequently Asked Questions
1. What is the projected Compound Annual Growth Rate (CAGR) of the Resorbable Polymers Market?
The projected CAGR is approximately > 10.00%.
2. Which companies are prominent players in the Resorbable Polymers Market?
Key companies in the market include KLS Martin Group, Teknimed, Poly-Med Incorporated, Evonik Industries AG, Ashland, Biogeneral, Foster Corporation, CORBION.
3. What are the main segments of the Resorbable Polymers Market?
The market segments include Material, Application.
4. Can you provide details about the market size?
The market size is estimated to be USD XX Million as of 2022.
5. What are some drivers contributing to market growth?
Growing Demand from Medical Industry; Other Drivers.
6. What are the notable trends driving market growth?
Orthopedics to Dominate the Market.
7. Are there any restraints impacting market growth?
Other Restraints.
8. Can you provide examples of recent developments in the market?
In Jan 2021, Evonik announced the closing of the LACTEL Absorbable Polymers acquisition from DURECT Corporation.
9. What pricing options are available for accessing the report?
Pricing options include single-user, multi-user, and enterprise licenses priced at USD 4750, USD 5250, and USD 8750 respectively.
10. Is the market size provided in terms of value or volume?
The market size is provided in terms of value, measured in Million and volume, measured in K Tons.
11. Are there any specific market keywords associated with the report?
Yes, the market keyword associated with the report is "Resorbable Polymers Market," which aids in identifying and referencing the specific market segment covered.
12. How do I determine which pricing option suits my needs best?
The pricing options vary based on user requirements and access needs. Individual users may opt for single-user licenses, while businesses requiring broader access may choose multi-user or enterprise licenses for cost-effective access to the report.
13. Are there any additional resources or data provided in the Resorbable Polymers Market report?
While the report offers comprehensive insights, it's advisable to review the specific contents or supplementary materials provided to ascertain if additional resources or data are available.
14. How can I stay updated on further developments or reports in the Resorbable Polymers Market?
To stay informed about further developments, trends, and reports in the Resorbable Polymers Market, consider subscribing to industry newsletters, following relevant companies and organizations, or regularly checking reputable industry news sources and publications.
Methodology
Step 1 - Identification of Relevant Samples Size from Population Database


Step 2 - Approaches for Defining Global Market Size (Value, Volume* & Price*)

Note*: In applicable scenarios
Step 3 - Data Sources
Primary Research
- Web Analytics
- Survey Reports
- Research Institute
- Latest Research Reports
- Opinion Leaders
Secondary Research
- Annual Reports
- White Paper
- Latest Press Release
- Industry Association
- Paid Database
- Investor Presentations

Step 4 - Data Triangulation
Involves using different sources of information in order to increase the validity of a study
These sources are likely to be stakeholders in a program - participants, other researchers, program staff, other community members, and so on.
Then we put all data in single framework & apply various statistical tools to find out the dynamic on the market.
During the analysis stage, feedback from the stakeholder groups would be compared to determine areas of agreement as well as areas of divergence


