
Key Insights
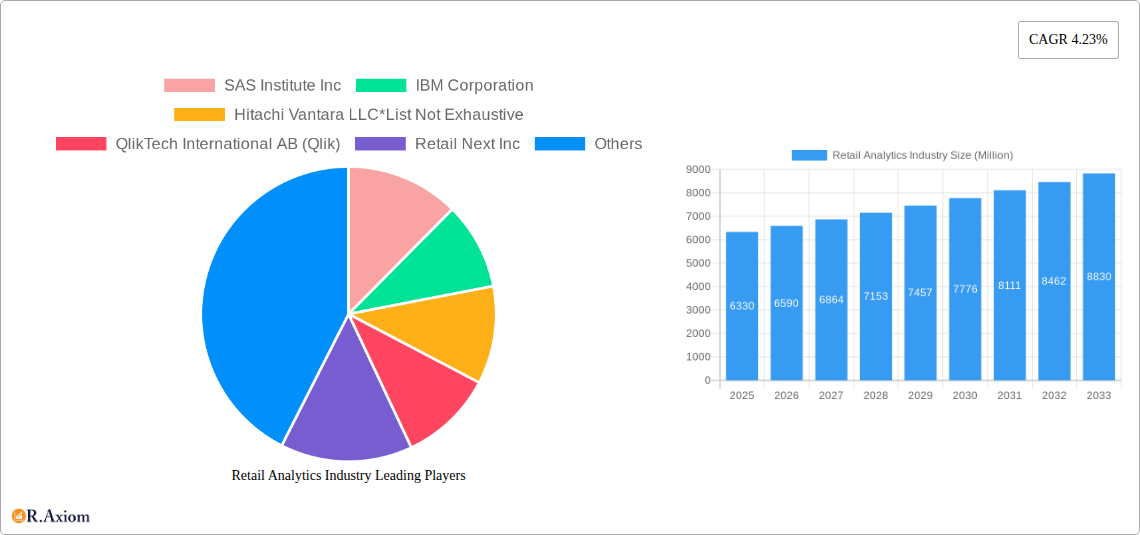
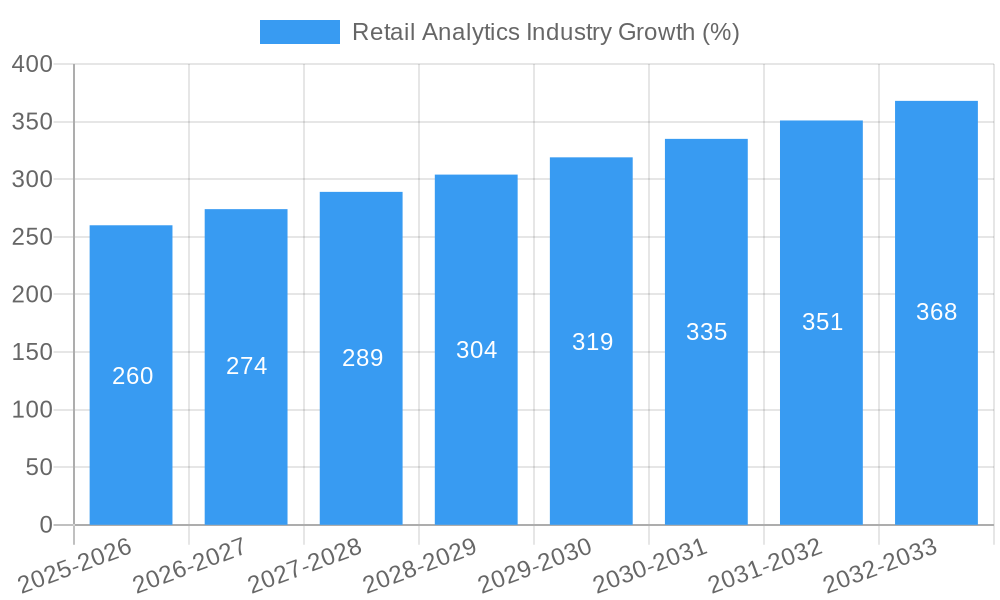
The global retail analytics market, valued at $6.33 billion in 2025, is projected to experience robust growth, driven by the increasing need for data-driven decision-making within the retail sector. The market's Compound Annual Growth Rate (CAGR) of 4.23% from 2025 to 2033 signifies a steady expansion, fueled by several key factors. The adoption of cloud-based solutions is accelerating, offering retailers scalability and cost-effectiveness in data storage and analysis. Furthermore, the growing importance of personalized customer experiences is pushing retailers to leverage advanced analytics to understand customer behavior, preferences, and purchasing patterns. This enables targeted marketing campaigns, optimized pricing strategies, and improved supply chain efficiency, leading to increased profitability and competitive advantage. The integration of artificial intelligence (AI) and machine learning (ML) into retail analytics solutions is also a significant trend, enabling predictive analytics and automation of various retail processes. While data security and privacy concerns present some restraints, the overall market outlook remains positive, with substantial growth expected across various segments, including software, services, and different deployment models (cloud and on-premise). The diverse functionalities covered by retail analytics, such as customer management, inventory management, supply chain optimization, and marketing & merchandising, contribute to its widespread adoption.
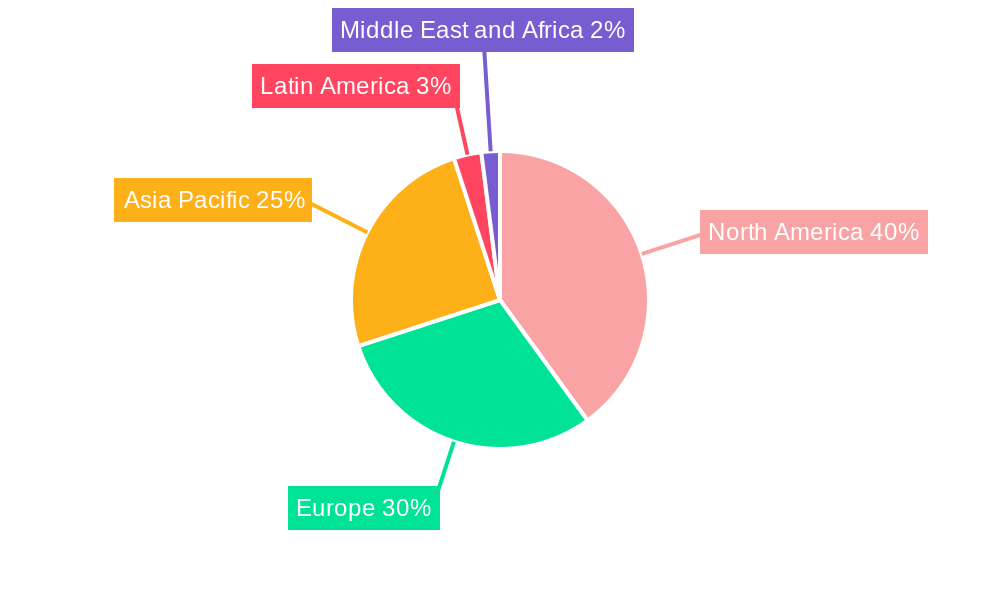
North America currently holds a significant market share, with the United States leading the way due to the high adoption of advanced technologies and the presence of major retail players. However, the Asia-Pacific region, particularly China and India, is poised for significant growth due to the expanding e-commerce sector and the increasing digitalization of retail operations. Europe also represents a substantial market, with countries like Germany and the UK showing strong adoption of retail analytics solutions. Competition is intense, with established players like SAS Institute, IBM, and Oracle competing alongside specialized retail analytics providers. The continued development of innovative solutions, coupled with the increasing demand for data-driven insights, will shape the future of the retail analytics market, ensuring its continued expansion in the coming years.
Retail Analytics Industry: A Comprehensive Market Report (2019-2033)
This detailed report provides a comprehensive analysis of the Retail Analytics industry, covering market size, segmentation, growth drivers, challenges, and key players. The study period spans from 2019 to 2033, with 2025 serving as the base and estimated year. The forecast period extends from 2025 to 2033, while the historical period encompasses 2019-2024. The report projects a market value exceeding xx Million by 2033, showcasing significant growth potential.
Retail Analytics Industry Market Concentration & Innovation
The Retail Analytics market exhibits a moderately concentrated landscape, with several major players vying for market share. Key players such as SAS Institute Inc, IBM Corporation, Hitachi Vantara LLC, QlikTech International AB (Qlik), Retail Next Inc, Altair Engineering Inc, Alteryx Inc, Oracle Corporation, Salesforce com Inc (Tableau Software Inc), and SAP SE collectively hold a significant portion (xx%) of the market, though their precise market share fluctuates based on segment and region. However, the market also supports numerous smaller, specialized firms, fostering competition and innovation.
- Market Share: The top 5 players command approximately xx% of the global market in 2025, with individual shares ranging from xx% to xx%.
- M&A Activity: The past five years have witnessed several notable mergers and acquisitions (M&A) within the industry, with deal values ranging from xx Million to xx Million. These activities reflect the strategic importance of retail analytics and the consolidation within the sector. For instance, the acquisition of Retailsoft by Priority Software in September 2023 demonstrates a push toward integrating robust retail management solutions.
- Innovation Drivers: Key innovation drivers include the rise of big data, advancements in artificial intelligence (AI), machine learning (ML), and cloud computing, along with the increasing demand for data-driven decision-making within the retail sector.
- Regulatory Frameworks: Data privacy regulations, such as GDPR and CCPA, significantly influence the development and deployment of retail analytics solutions. Compliance is crucial for market participation.
- Product Substitutes: Basic reporting tools and spreadsheet software can act as substitutes for some basic retail analytics functions; however, the advanced capabilities of dedicated retail analytics solutions provide a clear competitive advantage.
- End-User Trends: Retailers are increasingly focused on personalization, omnichannel strategies, and supply chain optimization, driving demand for sophisticated analytics solutions.
Retail Analytics Industry Trends & Insights
The Retail Analytics market is experiencing robust growth, fueled by several key trends. The market is expected to witness a Compound Annual Growth Rate (CAGR) of xx% during the forecast period (2025-2033). This growth is driven by several factors. First, the proliferation of data from various sources, including point-of-sale (POS) systems, customer relationship management (CRM) systems, and e-commerce platforms, is creating an immense opportunity for extracting actionable insights. Second, technological advancements, particularly in AI and ML, are enabling the development of more sophisticated analytics capabilities, including predictive modeling and prescriptive analytics. Third, increasing consumer demand for personalized experiences is pushing retailers to invest in data-driven strategies to understand and target their customer base more effectively.
Technological disruptions, such as the emergence of AI-powered solutions and cloud-based platforms, are significantly altering the competitive landscape. This includes the increased deployment of autonomous shopping technology. As market penetration for cloud-based solutions continues to grow, it becomes increasingly important for providers to prioritize security features and the seamless integration of data sources. The shift toward omnichannel strategies is also driving demand for integrated analytics solutions capable of providing a unified view of the customer across all touchpoints.
Dominant Markets & Segments in Retail Analytics Industry
The North American market currently holds the largest share of the global retail analytics market. This dominance stems from several factors, including:
- High technological adoption: The region has a strong technological infrastructure and high adoption of advanced technologies such as AI and cloud computing.
- High retail maturity: The North American retail sector is quite mature and boasts large retailers willing to invest significantly in data-driven initiatives.
- Strong economic growth: The generally strong economic conditions in the region provide significant financial resources for retailers to invest in improving operations through Retail Analytics.
Segment Dominance:
- By Solution: The software segment dominates, given the need for specialized applications to handle the complexity of retail data.
- By Deployment: Cloud deployment is increasingly prevalent due to scalability and cost-effectiveness.
- By Function: Customer management, supply chain management, and marketing/merchandising are currently the most prominent segments due to their critical impact on retail performance. In-store operation management is witnessing rapid growth, particularly Inventory and Performance Management solutions.
Retail Analytics Industry Product Developments
Recent product developments focus heavily on integrating AI and ML capabilities into retail analytics solutions. These advancements enable more accurate predictive modeling, improved customer segmentation, and more efficient inventory management. Cloud-based solutions are also gaining traction due to their scalability and cost-effectiveness. The market is witnessing a shift towards solutions that provide a unified view of the customer across all channels, enabling retailers to create seamless and personalized experiences. Smart Store Analytics, for example, as developed through the Microsoft and AiFi partnership, is a good example of this evolution.
Report Scope & Segmentation Analysis
This report segments the retail analytics market by solution (software, service), deployment (cloud, on-premise), and function (customer management, in-store operations, supply chain management, marketing and merchandising, other functions). Each segment is analyzed based on its current market size, growth projections, and competitive landscape. Software solutions currently hold the largest share, with growth projected to remain high due to the sophisticated capabilities of AI and ML-integrated tools. Cloud deployment is expected to gain significant market share driven by affordability, scalability and greater ease of access. Customer management, supply chain management, and marketing/merchandizing remain high-growth segments as businesses seek to use data to gain better business outcomes in these areas.
Key Drivers of Retail Analytics Industry Growth
The growth of the Retail Analytics industry is propelled by several key factors:
- Increasing data volume: The exponential growth of retail data from diverse sources creates a massive opportunity for extracting valuable insights.
- Advancements in AI/ML: These technologies enable the development of more sophisticated analytics capabilities, such as predictive modeling and real-time insights.
- Growing need for personalized customer experiences: Retailers are increasingly leveraging data to personalize their offerings and enhance customer loyalty.
- Rising demand for supply chain optimization: Analytics solutions contribute to enhancing supply chain efficiency and cost reduction.
- Government initiatives and regulations: Data privacy regulations and policies focusing on data usage and analytics are influencing the growth of the industry.
Challenges in the Retail Analytics Industry Sector
The Retail Analytics industry faces several significant challenges:
- Data security and privacy concerns: Protecting sensitive customer data is a paramount concern that affects implementation and adoption.
- Integration complexities: Integrating various data sources and systems can be technically challenging and expensive.
- Lack of skilled professionals: The scarcity of professionals with the required expertise to implement and manage sophisticated analytics solutions is a factor.
- High implementation costs: The costs associated with implementing and maintaining advanced analytics solutions can be prohibitive for some businesses.
- Competition: The intensely competitive nature of the retail sector means the development of solutions must be innovative and constantly evolve to maintain market share.
Emerging Opportunities in Retail Analytics Industry
Several emerging opportunities are driving growth in the Retail Analytics industry:
- Expansion into new markets: Emerging economies offer significant potential for growth, with increasing adoption of data-driven strategies.
- Development of specialized solutions: Specialized solutions catering to specific retail segments (e.g., grocery, apparel) are becoming increasingly popular.
- Adoption of edge computing: Real-time analytics at the edge is gaining traction for immediate action on data insights.
- Integration with IoT devices: Connecting retail analytics with IoT devices to generate new data streams and enhance decision-making offers promising potential.
Leading Players in the Retail Analytics Industry Market
- SAS Institute Inc
- IBM Corporation
- Hitachi Vantara LLC
- QlikTech International AB (Qlik)
- Retail Next Inc
- Altair Engineering Inc
- Alteryx Inc
- Oracle Corporation
- Salesforce com Inc (Tableau Software Inc)
- SAP SE
Key Developments in Retail Analytics Industry Industry
September 2023: Priority Software acquired Retailsoft, strengthening its retail management solutions portfolio and enhancing its ability to offer retailers comprehensive, data-driven tools for optimization and growth. This signals a trend towards consolidation and integration within the retail analytics ecosystem.
January 2023: AiFi partnered with Microsoft to launch Smart Store Analytics, a cloud-based service providing retailers with enhanced shopper and operational analytics for their smart stores. This collaboration showcases the increasing importance of cloud-based solutions and the integration of AI capabilities for optimized retail experiences.
Strategic Outlook for Retail Analytics Industry Market
The Retail Analytics market is poised for continued strong growth, driven by the increasing adoption of advanced technologies like AI and ML, the growing volume of retail data, and the need for personalized and omnichannel experiences. The strategic focus for businesses should be on developing robust, scalable, and secure solutions that can seamlessly integrate with existing retail infrastructure. Focus on user-friendly interfaces and tailored solutions for specific retail segments will be paramount in the competitive market landscape.
Retail Analytics Industry Segmentation
-
1. Solution
- 1.1. Software
- 1.2. Service
-
2. Deployment
- 2.1. Cloud
- 2.2. On-premise
-
3. Function
- 3.1. Customer Management
- 3.2. In-store
- 3.3. Supply Chain Management
- 3.4. Marketin
- 3.5. Other Fu
Retail Analytics Industry Segmentation By Geography
-
1. North America
- 1.1. United States
- 1.2. Canada
-
2. Europe
- 2.1. Germany
- 2.2. United Kingdom
- 2.3. France
- 2.4. Russia
- 2.5. Rest of Europe
-
3. Asia Pacific
- 3.1. China
- 3.2. Japan
- 3.3. India
- 3.4. Rest of Asia Pacific
- 4. Latin America
- 5. Middle East and Africa
Retail Analytics Industry REPORT HIGHLIGHTS
| Aspects | Details |
|---|---|
| Study Period | 2019-2033 |
| Base Year | 2024 |
| Estimated Year | 2025 |
| Forecast Period | 2025-2033 |
| Historical Period | 2019-2024 |
| Growth Rate | CAGR of 4.23% from 2019-2033 |
| Segmentation |
|
Table of Contents
- 1. Introduction
- 1.1. Research Scope
- 1.2. Market Segmentation
- 1.3. Research Methodology
- 1.4. Definitions and Assumptions
- 2. Executive Summary
- 2.1. Introduction
- 3. Market Dynamics
- 3.1. Introduction
- 3.2. Market Drivers
- 3.2.1. Increasing Volumes of Data and Technological Advancements in AI and AR/VR; Increasing E-retail Sales
- 3.3. Market Restrains
- 3.3.1. Lack of General Awareness and Expertise in Emerging Regions; Standardization and Integration Issues
- 3.4. Market Trends
- 3.4.1. In-store Operation Hold Major Share
- 4. Market Factor Analysis
- 4.1. Porters Five Forces
- 4.2. Supply/Value Chain
- 4.3. PESTEL analysis
- 4.4. Market Entropy
- 4.5. Patent/Trademark Analysis
- 5. Global Retail Analytics Industry Analysis, Insights and Forecast, 2019-2031
- 5.1. Market Analysis, Insights and Forecast - by Solution
- 5.1.1. Software
- 5.1.2. Service
- 5.2. Market Analysis, Insights and Forecast - by Deployment
- 5.2.1. Cloud
- 5.2.2. On-premise
- 5.3. Market Analysis, Insights and Forecast - by Function
- 5.3.1. Customer Management
- 5.3.2. In-store
- 5.3.3. Supply Chain Management
- 5.3.4. Marketin
- 5.3.5. Other Fu
- 5.4. Market Analysis, Insights and Forecast - by Region
- 5.4.1. North America
- 5.4.2. Europe
- 5.4.3. Asia Pacific
- 5.4.4. Latin America
- 5.4.5. Middle East and Africa
- 5.1. Market Analysis, Insights and Forecast - by Solution
- 6. North America Retail Analytics Industry Analysis, Insights and Forecast, 2019-2031
- 6.1. Market Analysis, Insights and Forecast - by Solution
- 6.1.1. Software
- 6.1.2. Service
- 6.2. Market Analysis, Insights and Forecast - by Deployment
- 6.2.1. Cloud
- 6.2.2. On-premise
- 6.3. Market Analysis, Insights and Forecast - by Function
- 6.3.1. Customer Management
- 6.3.2. In-store
- 6.3.3. Supply Chain Management
- 6.3.4. Marketin
- 6.3.5. Other Fu
- 6.1. Market Analysis, Insights and Forecast - by Solution
- 7. Europe Retail Analytics Industry Analysis, Insights and Forecast, 2019-2031
- 7.1. Market Analysis, Insights and Forecast - by Solution
- 7.1.1. Software
- 7.1.2. Service
- 7.2. Market Analysis, Insights and Forecast - by Deployment
- 7.2.1. Cloud
- 7.2.2. On-premise
- 7.3. Market Analysis, Insights and Forecast - by Function
- 7.3.1. Customer Management
- 7.3.2. In-store
- 7.3.3. Supply Chain Management
- 7.3.4. Marketin
- 7.3.5. Other Fu
- 7.1. Market Analysis, Insights and Forecast - by Solution
- 8. Asia Pacific Retail Analytics Industry Analysis, Insights and Forecast, 2019-2031
- 8.1. Market Analysis, Insights and Forecast - by Solution
- 8.1.1. Software
- 8.1.2. Service
- 8.2. Market Analysis, Insights and Forecast - by Deployment
- 8.2.1. Cloud
- 8.2.2. On-premise
- 8.3. Market Analysis, Insights and Forecast - by Function
- 8.3.1. Customer Management
- 8.3.2. In-store
- 8.3.3. Supply Chain Management
- 8.3.4. Marketin
- 8.3.5. Other Fu
- 8.1. Market Analysis, Insights and Forecast - by Solution
- 9. Latin America Retail Analytics Industry Analysis, Insights and Forecast, 2019-2031
- 9.1. Market Analysis, Insights and Forecast - by Solution
- 9.1.1. Software
- 9.1.2. Service
- 9.2. Market Analysis, Insights and Forecast - by Deployment
- 9.2.1. Cloud
- 9.2.2. On-premise
- 9.3. Market Analysis, Insights and Forecast - by Function
- 9.3.1. Customer Management
- 9.3.2. In-store
- 9.3.3. Supply Chain Management
- 9.3.4. Marketin
- 9.3.5. Other Fu
- 9.1. Market Analysis, Insights and Forecast - by Solution
- 10. Middle East and Africa Retail Analytics Industry Analysis, Insights and Forecast, 2019-2031
- 10.1. Market Analysis, Insights and Forecast - by Solution
- 10.1.1. Software
- 10.1.2. Service
- 10.2. Market Analysis, Insights and Forecast - by Deployment
- 10.2.1. Cloud
- 10.2.2. On-premise
- 10.3. Market Analysis, Insights and Forecast - by Function
- 10.3.1. Customer Management
- 10.3.2. In-store
- 10.3.3. Supply Chain Management
- 10.3.4. Marketin
- 10.3.5. Other Fu
- 10.1. Market Analysis, Insights and Forecast - by Solution
- 11. North America Retail Analytics Industry Analysis, Insights and Forecast, 2019-2031
- 11.1. Market Analysis, Insights and Forecast - By Country/Sub-region
- 11.1.1 United States
- 11.1.2 Canada
- 12. Europe Retail Analytics Industry Analysis, Insights and Forecast, 2019-2031
- 12.1. Market Analysis, Insights and Forecast - By Country/Sub-region
- 12.1.1 Germany
- 12.1.2 United Kingdom
- 12.1.3 France
- 12.1.4 Russia
- 12.1.5 Rest of Europe
- 13. Asia Pacific Retail Analytics Industry Analysis, Insights and Forecast, 2019-2031
- 13.1. Market Analysis, Insights and Forecast - By Country/Sub-region
- 13.1.1 China
- 13.1.2 Japan
- 13.1.3 India
- 13.1.4 Rest of Asia Pacific
- 14. Latin America Retail Analytics Industry Analysis, Insights and Forecast, 2019-2031
- 14.1. Market Analysis, Insights and Forecast - By Country/Sub-region
- 14.1.1.
- 15. Middle East and Africa Retail Analytics Industry Analysis, Insights and Forecast, 2019-2031
- 15.1. Market Analysis, Insights and Forecast - By Country/Sub-region
- 15.1.1.
- 16. Competitive Analysis
- 16.1. Global Market Share Analysis 2024
- 16.2. Company Profiles
- 16.2.1 SAS Institute Inc
- 16.2.1.1. Overview
- 16.2.1.2. Products
- 16.2.1.3. SWOT Analysis
- 16.2.1.4. Recent Developments
- 16.2.1.5. Financials (Based on Availability)
- 16.2.2 IBM Corporation
- 16.2.2.1. Overview
- 16.2.2.2. Products
- 16.2.2.3. SWOT Analysis
- 16.2.2.4. Recent Developments
- 16.2.2.5. Financials (Based on Availability)
- 16.2.3 Hitachi Vantara LLC*List Not Exhaustive
- 16.2.3.1. Overview
- 16.2.3.2. Products
- 16.2.3.3. SWOT Analysis
- 16.2.3.4. Recent Developments
- 16.2.3.5. Financials (Based on Availability)
- 16.2.4 QlikTech International AB (Qlik)
- 16.2.4.1. Overview
- 16.2.4.2. Products
- 16.2.4.3. SWOT Analysis
- 16.2.4.4. Recent Developments
- 16.2.4.5. Financials (Based on Availability)
- 16.2.5 Retail Next Inc
- 16.2.5.1. Overview
- 16.2.5.2. Products
- 16.2.5.3. SWOT Analysis
- 16.2.5.4. Recent Developments
- 16.2.5.5. Financials (Based on Availability)
- 16.2.6 Altair Engineering Inc
- 16.2.6.1. Overview
- 16.2.6.2. Products
- 16.2.6.3. SWOT Analysis
- 16.2.6.4. Recent Developments
- 16.2.6.5. Financials (Based on Availability)
- 16.2.7 Alteryx Inc
- 16.2.7.1. Overview
- 16.2.7.2. Products
- 16.2.7.3. SWOT Analysis
- 16.2.7.4. Recent Developments
- 16.2.7.5. Financials (Based on Availability)
- 16.2.8 Oracle Corporation
- 16.2.8.1. Overview
- 16.2.8.2. Products
- 16.2.8.3. SWOT Analysis
- 16.2.8.4. Recent Developments
- 16.2.8.5. Financials (Based on Availability)
- 16.2.9 Salesforce com Inc (Tableau Software Inc )
- 16.2.9.1. Overview
- 16.2.9.2. Products
- 16.2.9.3. SWOT Analysis
- 16.2.9.4. Recent Developments
- 16.2.9.5. Financials (Based on Availability)
- 16.2.10 SAP SE
- 16.2.10.1. Overview
- 16.2.10.2. Products
- 16.2.10.3. SWOT Analysis
- 16.2.10.4. Recent Developments
- 16.2.10.5. Financials (Based on Availability)
- 16.2.1 SAS Institute Inc
List of Figures
- Figure 1: Global Retail Analytics Industry Revenue Breakdown (Million, %) by Region 2024 & 2032
- Figure 2: North America Retail Analytics Industry Revenue (Million), by Country 2024 & 2032
- Figure 3: North America Retail Analytics Industry Revenue Share (%), by Country 2024 & 2032
- Figure 4: Europe Retail Analytics Industry Revenue (Million), by Country 2024 & 2032
- Figure 5: Europe Retail Analytics Industry Revenue Share (%), by Country 2024 & 2032
- Figure 6: Asia Pacific Retail Analytics Industry Revenue (Million), by Country 2024 & 2032
- Figure 7: Asia Pacific Retail Analytics Industry Revenue Share (%), by Country 2024 & 2032
- Figure 8: Latin America Retail Analytics Industry Revenue (Million), by Country 2024 & 2032
- Figure 9: Latin America Retail Analytics Industry Revenue Share (%), by Country 2024 & 2032
- Figure 10: Middle East and Africa Retail Analytics Industry Revenue (Million), by Country 2024 & 2032
- Figure 11: Middle East and Africa Retail Analytics Industry Revenue Share (%), by Country 2024 & 2032
- Figure 12: North America Retail Analytics Industry Revenue (Million), by Solution 2024 & 2032
- Figure 13: North America Retail Analytics Industry Revenue Share (%), by Solution 2024 & 2032
- Figure 14: North America Retail Analytics Industry Revenue (Million), by Deployment 2024 & 2032
- Figure 15: North America Retail Analytics Industry Revenue Share (%), by Deployment 2024 & 2032
- Figure 16: North America Retail Analytics Industry Revenue (Million), by Function 2024 & 2032
- Figure 17: North America Retail Analytics Industry Revenue Share (%), by Function 2024 & 2032
- Figure 18: North America Retail Analytics Industry Revenue (Million), by Country 2024 & 2032
- Figure 19: North America Retail Analytics Industry Revenue Share (%), by Country 2024 & 2032
- Figure 20: Europe Retail Analytics Industry Revenue (Million), by Solution 2024 & 2032
- Figure 21: Europe Retail Analytics Industry Revenue Share (%), by Solution 2024 & 2032
- Figure 22: Europe Retail Analytics Industry Revenue (Million), by Deployment 2024 & 2032
- Figure 23: Europe Retail Analytics Industry Revenue Share (%), by Deployment 2024 & 2032
- Figure 24: Europe Retail Analytics Industry Revenue (Million), by Function 2024 & 2032
- Figure 25: Europe Retail Analytics Industry Revenue Share (%), by Function 2024 & 2032
- Figure 26: Europe Retail Analytics Industry Revenue (Million), by Country 2024 & 2032
- Figure 27: Europe Retail Analytics Industry Revenue Share (%), by Country 2024 & 2032
- Figure 28: Asia Pacific Retail Analytics Industry Revenue (Million), by Solution 2024 & 2032
- Figure 29: Asia Pacific Retail Analytics Industry Revenue Share (%), by Solution 2024 & 2032
- Figure 30: Asia Pacific Retail Analytics Industry Revenue (Million), by Deployment 2024 & 2032
- Figure 31: Asia Pacific Retail Analytics Industry Revenue Share (%), by Deployment 2024 & 2032
- Figure 32: Asia Pacific Retail Analytics Industry Revenue (Million), by Function 2024 & 2032
- Figure 33: Asia Pacific Retail Analytics Industry Revenue Share (%), by Function 2024 & 2032
- Figure 34: Asia Pacific Retail Analytics Industry Revenue (Million), by Country 2024 & 2032
- Figure 35: Asia Pacific Retail Analytics Industry Revenue Share (%), by Country 2024 & 2032
- Figure 36: Latin America Retail Analytics Industry Revenue (Million), by Solution 2024 & 2032
- Figure 37: Latin America Retail Analytics Industry Revenue Share (%), by Solution 2024 & 2032
- Figure 38: Latin America Retail Analytics Industry Revenue (Million), by Deployment 2024 & 2032
- Figure 39: Latin America Retail Analytics Industry Revenue Share (%), by Deployment 2024 & 2032
- Figure 40: Latin America Retail Analytics Industry Revenue (Million), by Function 2024 & 2032
- Figure 41: Latin America Retail Analytics Industry Revenue Share (%), by Function 2024 & 2032
- Figure 42: Latin America Retail Analytics Industry Revenue (Million), by Country 2024 & 2032
- Figure 43: Latin America Retail Analytics Industry Revenue Share (%), by Country 2024 & 2032
- Figure 44: Middle East and Africa Retail Analytics Industry Revenue (Million), by Solution 2024 & 2032
- Figure 45: Middle East and Africa Retail Analytics Industry Revenue Share (%), by Solution 2024 & 2032
- Figure 46: Middle East and Africa Retail Analytics Industry Revenue (Million), by Deployment 2024 & 2032
- Figure 47: Middle East and Africa Retail Analytics Industry Revenue Share (%), by Deployment 2024 & 2032
- Figure 48: Middle East and Africa Retail Analytics Industry Revenue (Million), by Function 2024 & 2032
- Figure 49: Middle East and Africa Retail Analytics Industry Revenue Share (%), by Function 2024 & 2032
- Figure 50: Middle East and Africa Retail Analytics Industry Revenue (Million), by Country 2024 & 2032
- Figure 51: Middle East and Africa Retail Analytics Industry Revenue Share (%), by Country 2024 & 2032
List of Tables
- Table 1: Global Retail Analytics Industry Revenue Million Forecast, by Region 2019 & 2032
- Table 2: Global Retail Analytics Industry Revenue Million Forecast, by Solution 2019 & 2032
- Table 3: Global Retail Analytics Industry Revenue Million Forecast, by Deployment 2019 & 2032
- Table 4: Global Retail Analytics Industry Revenue Million Forecast, by Function 2019 & 2032
- Table 5: Global Retail Analytics Industry Revenue Million Forecast, by Region 2019 & 2032
- Table 6: Global Retail Analytics Industry Revenue Million Forecast, by Country 2019 & 2032
- Table 7: United States Retail Analytics Industry Revenue (Million) Forecast, by Application 2019 & 2032
- Table 8: Canada Retail Analytics Industry Revenue (Million) Forecast, by Application 2019 & 2032
- Table 9: Global Retail Analytics Industry Revenue Million Forecast, by Country 2019 & 2032
- Table 10: Germany Retail Analytics Industry Revenue (Million) Forecast, by Application 2019 & 2032
- Table 11: United Kingdom Retail Analytics Industry Revenue (Million) Forecast, by Application 2019 & 2032
- Table 12: France Retail Analytics Industry Revenue (Million) Forecast, by Application 2019 & 2032
- Table 13: Russia Retail Analytics Industry Revenue (Million) Forecast, by Application 2019 & 2032
- Table 14: Rest of Europe Retail Analytics Industry Revenue (Million) Forecast, by Application 2019 & 2032
- Table 15: Global Retail Analytics Industry Revenue Million Forecast, by Country 2019 & 2032
- Table 16: China Retail Analytics Industry Revenue (Million) Forecast, by Application 2019 & 2032
- Table 17: Japan Retail Analytics Industry Revenue (Million) Forecast, by Application 2019 & 2032
- Table 18: India Retail Analytics Industry Revenue (Million) Forecast, by Application 2019 & 2032
- Table 19: Rest of Asia Pacific Retail Analytics Industry Revenue (Million) Forecast, by Application 2019 & 2032
- Table 20: Global Retail Analytics Industry Revenue Million Forecast, by Country 2019 & 2032
- Table 21: Retail Analytics Industry Revenue (Million) Forecast, by Application 2019 & 2032
- Table 22: Global Retail Analytics Industry Revenue Million Forecast, by Country 2019 & 2032
- Table 23: Retail Analytics Industry Revenue (Million) Forecast, by Application 2019 & 2032
- Table 24: Global Retail Analytics Industry Revenue Million Forecast, by Solution 2019 & 2032
- Table 25: Global Retail Analytics Industry Revenue Million Forecast, by Deployment 2019 & 2032
- Table 26: Global Retail Analytics Industry Revenue Million Forecast, by Function 2019 & 2032
- Table 27: Global Retail Analytics Industry Revenue Million Forecast, by Country 2019 & 2032
- Table 28: United States Retail Analytics Industry Revenue (Million) Forecast, by Application 2019 & 2032
- Table 29: Canada Retail Analytics Industry Revenue (Million) Forecast, by Application 2019 & 2032
- Table 30: Global Retail Analytics Industry Revenue Million Forecast, by Solution 2019 & 2032
- Table 31: Global Retail Analytics Industry Revenue Million Forecast, by Deployment 2019 & 2032
- Table 32: Global Retail Analytics Industry Revenue Million Forecast, by Function 2019 & 2032
- Table 33: Global Retail Analytics Industry Revenue Million Forecast, by Country 2019 & 2032
- Table 34: Germany Retail Analytics Industry Revenue (Million) Forecast, by Application 2019 & 2032
- Table 35: United Kingdom Retail Analytics Industry Revenue (Million) Forecast, by Application 2019 & 2032
- Table 36: France Retail Analytics Industry Revenue (Million) Forecast, by Application 2019 & 2032
- Table 37: Russia Retail Analytics Industry Revenue (Million) Forecast, by Application 2019 & 2032
- Table 38: Rest of Europe Retail Analytics Industry Revenue (Million) Forecast, by Application 2019 & 2032
- Table 39: Global Retail Analytics Industry Revenue Million Forecast, by Solution 2019 & 2032
- Table 40: Global Retail Analytics Industry Revenue Million Forecast, by Deployment 2019 & 2032
- Table 41: Global Retail Analytics Industry Revenue Million Forecast, by Function 2019 & 2032
- Table 42: Global Retail Analytics Industry Revenue Million Forecast, by Country 2019 & 2032
- Table 43: China Retail Analytics Industry Revenue (Million) Forecast, by Application 2019 & 2032
- Table 44: Japan Retail Analytics Industry Revenue (Million) Forecast, by Application 2019 & 2032
- Table 45: India Retail Analytics Industry Revenue (Million) Forecast, by Application 2019 & 2032
- Table 46: Rest of Asia Pacific Retail Analytics Industry Revenue (Million) Forecast, by Application 2019 & 2032
- Table 47: Global Retail Analytics Industry Revenue Million Forecast, by Solution 2019 & 2032
- Table 48: Global Retail Analytics Industry Revenue Million Forecast, by Deployment 2019 & 2032
- Table 49: Global Retail Analytics Industry Revenue Million Forecast, by Function 2019 & 2032
- Table 50: Global Retail Analytics Industry Revenue Million Forecast, by Country 2019 & 2032
- Table 51: Global Retail Analytics Industry Revenue Million Forecast, by Solution 2019 & 2032
- Table 52: Global Retail Analytics Industry Revenue Million Forecast, by Deployment 2019 & 2032
- Table 53: Global Retail Analytics Industry Revenue Million Forecast, by Function 2019 & 2032
- Table 54: Global Retail Analytics Industry Revenue Million Forecast, by Country 2019 & 2032
Frequently Asked Questions
1. What is the projected Compound Annual Growth Rate (CAGR) of the Retail Analytics Industry?
The projected CAGR is approximately 4.23%.
2. Which companies are prominent players in the Retail Analytics Industry?
Key companies in the market include SAS Institute Inc, IBM Corporation, Hitachi Vantara LLC*List Not Exhaustive, QlikTech International AB (Qlik), Retail Next Inc, Altair Engineering Inc, Alteryx Inc, Oracle Corporation, Salesforce com Inc (Tableau Software Inc ), SAP SE.
3. What are the main segments of the Retail Analytics Industry?
The market segments include Solution, Deployment, Function.
4. Can you provide details about the market size?
The market size is estimated to be USD 6.33 Million as of 2022.
5. What are some drivers contributing to market growth?
Increasing Volumes of Data and Technological Advancements in AI and AR/VR; Increasing E-retail Sales.
6. What are the notable trends driving market growth?
In-store Operation Hold Major Share.
7. Are there any restraints impacting market growth?
Lack of General Awareness and Expertise in Emerging Regions; Standardization and Integration Issues.
8. Can you provide examples of recent developments in the market?
September 2023 - Priority Software acquired Retailsoft, a developer of innovative technology solutions for optimizing retail business efficiency and enhancing revenue growth. In addition, Priority is expanding the scope of its Retail Management Products and delivering significant value to Retailers by integrating Retailsoft's solutions. Retailsoft provides a dynamic platform with operational modules tailored to each organization's needs. These modules comprise work scheduling, communication tools, objective setting, and real-time access to POS data across all locations. Such features empower businesses with trend analysis, monitoring, and strategy optimization, facilitating data-driven decisions, sales goal setting, and fostering competition among branches.
9. What pricing options are available for accessing the report?
Pricing options include single-user, multi-user, and enterprise licenses priced at USD 4750, USD 5250, and USD 8750 respectively.
10. Is the market size provided in terms of value or volume?
The market size is provided in terms of value, measured in Million.
11. Are there any specific market keywords associated with the report?
Yes, the market keyword associated with the report is "Retail Analytics Industry," which aids in identifying and referencing the specific market segment covered.
12. How do I determine which pricing option suits my needs best?
The pricing options vary based on user requirements and access needs. Individual users may opt for single-user licenses, while businesses requiring broader access may choose multi-user or enterprise licenses for cost-effective access to the report.
13. Are there any additional resources or data provided in the Retail Analytics Industry report?
While the report offers comprehensive insights, it's advisable to review the specific contents or supplementary materials provided to ascertain if additional resources or data are available.
14. How can I stay updated on further developments or reports in the Retail Analytics Industry?
To stay informed about further developments, trends, and reports in the Retail Analytics Industry, consider subscribing to industry newsletters, following relevant companies and organizations, or regularly checking reputable industry news sources and publications.
Methodology
Step 1 - Identification of Relevant Samples Size from Population Database


Step 2 - Approaches for Defining Global Market Size (Value, Volume* & Price*)

Note*: In applicable scenarios
Step 3 - Data Sources
Primary Research
- Web Analytics
- Survey Reports
- Research Institute
- Latest Research Reports
- Opinion Leaders
Secondary Research
- Annual Reports
- White Paper
- Latest Press Release
- Industry Association
- Paid Database
- Investor Presentations

Step 4 - Data Triangulation
Involves using different sources of information in order to increase the validity of a study
These sources are likely to be stakeholders in a program - participants, other researchers, program staff, other community members, and so on.
Then we put all data in single framework & apply various statistical tools to find out the dynamic on the market.
During the analysis stage, feedback from the stakeholder groups would be compared to determine areas of agreement as well as areas of divergence


