

Key Insights
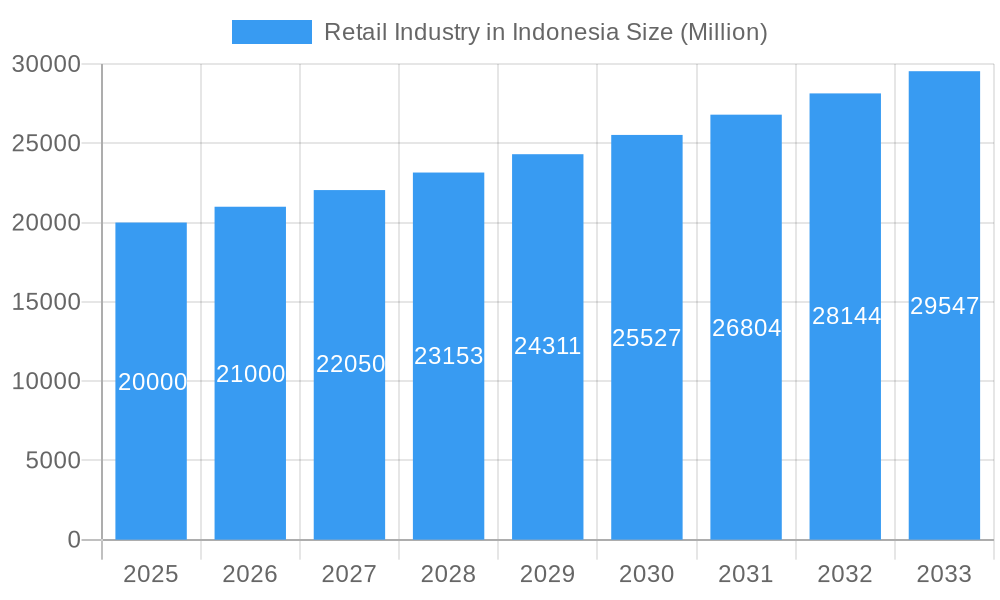
The Indonesian retail market, valued at $56.87 billion in 2025, is poised for substantial growth. Projections indicate a Compound Annual Growth Rate (CAGR) of 5.6% from 2025 to 2033. This upward trajectory is underpinned by a growing middle class with enhanced purchasing power, driving demand for diverse retail offerings. Rapid urbanization fuels the expansion of both physical and digital retail channels. Government initiatives promoting infrastructure and digitalization further bolster the sector. Enhanced logistics and supply chain efficiencies are also key contributors to market reach. Key industry players include PT Matahari Putra Prima Tbk, Ramayana Lestari Sentosa, and Mitra Adiperkasa, alongside a dynamic e-commerce ecosystem and localized retailers.
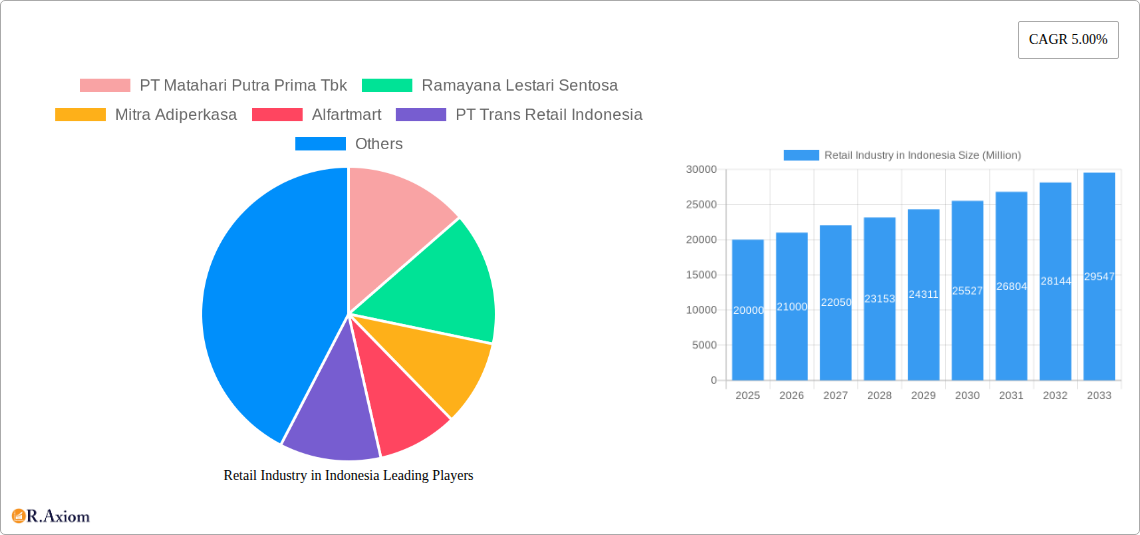
Retail Industry in Indonesia Market Size (In Billion)
Despite positive outlooks, the market faces challenges including inflationary pressures and currency volatility. Intense competition demands ongoing innovation and agility in response to evolving consumer behaviors. Integrating robust online and offline retail strategies is paramount for sustained success. Addressing logistical intricacies across Indonesia's vast archipelago, particularly in remote regions, remains a critical operational consideration. Future success will hinge on leveraging technology for superior customer experiences, optimized supply chains, and compelling value propositions. Market segmentation, encompassing hypermarkets, supermarkets, convenience stores, and specialty retailers, offers avenues for strategic targeting and niche market development.
Retail Industry in Indonesia Company Market Share
Retail Industry in Indonesia: A Comprehensive Market Report (2019-2033)
This comprehensive report provides an in-depth analysis of the Indonesian retail industry, covering market dynamics, key players, emerging trends, and future growth prospects from 2019 to 2033. The report leverages extensive market research and data analysis to offer actionable insights for industry stakeholders, investors, and businesses operating within or planning to enter this dynamic market. The study period spans 2019-2033, with 2025 serving as both the base and estimated year. The forecast period is 2025-2033, and the historical period encompasses 2019-2024.
Retail Industry in Indonesia: Market Concentration & Innovation
This section analyzes the Indonesian retail landscape's competitive intensity, innovation drivers, regulatory environment, and market dynamics. We examine market concentration through the lens of market share held by key players such as PT Matahari Putra Prima Tbk, Ramayana Lestari Sentosa, Mitra Adiperkasa, Alfamart, PT Trans Retail Indonesia, Hero Supermarket Group, Erajaya Swasembada, AEON Group, Lotte Mart, and Indomarket (list not exhaustive). While precise market share data for each player fluctuates and requires proprietary data, we estimate the top 5 players collectively hold approximately 60% of the market in 2025. The report also quantifies M&A activity within the sector, estimating a total deal value of xx Million in the historical period (2019-2024), driven by strategic expansions and consolidation.
- Market Concentration: High concentration amongst established players, with significant regional variations.
- Innovation Drivers: E-commerce growth, omnichannel strategies, and rising consumer expectations for personalized experiences.
- Regulatory Framework: Government policies on foreign investment, e-commerce regulations, and consumer protection laws influence market dynamics.
- Product Substitutes: The emergence of online marketplaces and direct-to-consumer brands presents a competitive challenge to traditional retail formats.
- End-User Trends: Shifting consumer preferences towards convenience, value, and digital experiences are reshaping the retail landscape.
- M&A Activities: Consolidation amongst players through mergers and acquisitions to enhance market share and operational efficiencies.
Retail Industry in Indonesia: Industry Trends & Insights
This section delves into the key trends driving growth and change in Indonesia's retail sector. The Indonesian retail market exhibits robust growth, fuelled by a large and expanding middle class, rising disposable incomes, and increasing urbanization. We project a Compound Annual Growth Rate (CAGR) of xx% during the forecast period (2025-2033). Technological disruptions, such as the proliferation of e-commerce and mobile payments, are significantly impacting market dynamics, enhancing accessibility and convenience for consumers. Furthermore, changing consumer preferences, including a focus on sustainable and ethical products, are shaping the competitive landscape. Market penetration of e-commerce is estimated at xx% in 2025, anticipated to rise significantly by 2033. The competitive intensity is characterized by both domestic and international players vying for market dominance.
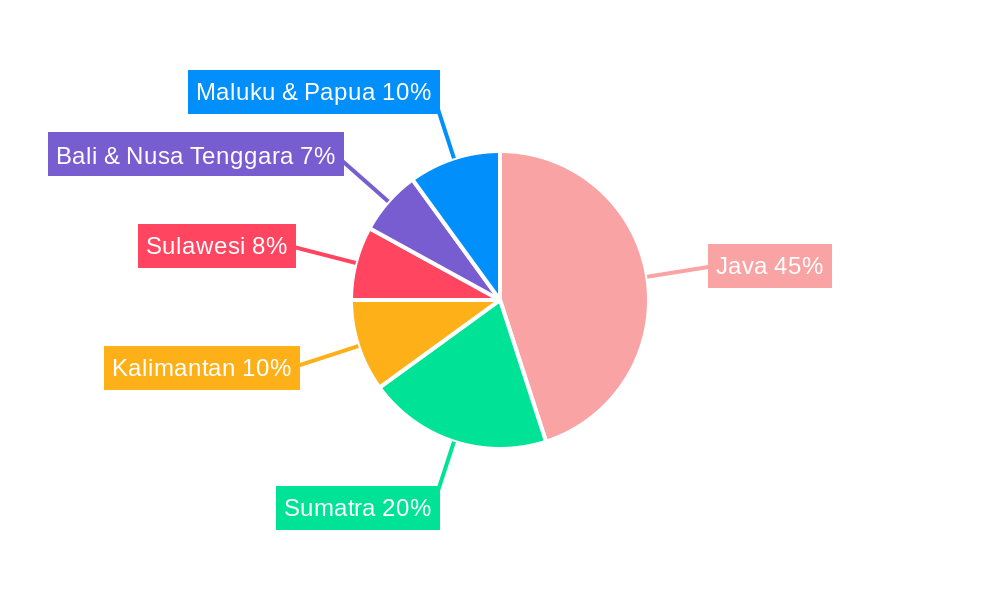
Dominant Markets & Segments in Retail Industry in Indonesia
Java Island holds the dominant position within the Indonesian retail market, owing to its high population density, established infrastructure, and robust economic activity. Other regions, such as Sumatra and Kalimantan, are witnessing substantial growth, although they lag behind Java in terms of overall retail sales. Key market segments include:
- Food & Grocery: Dominated by large supermarket chains and traditional wet markets, this segment experiences consistent growth driven by increasing household spending.
- Apparel & Footwear: This sector witnesses strong competition amongst international and local brands, with increasing demand for fashion-forward apparel.
- Electronics & Appliances: This segment shows steady growth, influenced by rising disposable incomes and increasing technology adoption rates.
- Pharmaceuticals & Cosmetics: This segment benefits from rising health consciousness and a growing middle class with increasing disposable income.
Key Drivers of Java's Dominance:
- High population density and strong purchasing power.
- Well-developed infrastructure, including transportation and logistics networks.
- High concentration of businesses and commercial activities.
- Supportive government policies promoting economic development.
Retail Industry in Indonesia: Product Developments
The Indonesian retail industry is witnessing significant product innovations, driven by technological advancements and evolving consumer preferences. The emphasis is on personalized experiences, omnichannel integration, and the adoption of advanced analytics to optimize inventory management and customer service. Technological trends, such as artificial intelligence (AI) and Internet of Things (IoT), are being adopted to enhance efficiency and provide value-added services. These innovations are crucial for maintaining competitiveness and meeting evolving consumer needs.
Report Scope & Segmentation Analysis
This comprehensive report meticulously segments the Indonesian retail market, offering granular insights across key dimensions. Segmentation is performed based on diverse product categories, including essential food & grocery, evolving apparel & footwear trends, rapidly growing electronics & appliances, and the consistently in-demand pharmaceuticals & cosmetics, among others. Furthermore, the analysis delves into various retail formats, scrutinizing the performance of hypermarkets, supermarkets, convenience stores, and the increasingly dominant online retail sector. Geographic segmentation focuses on key regions such as Java, Sumatra, Kalimantan, and other emerging economic hubs. Each identified segment is rigorously analyzed for its current market size, future growth projections, and the prevailing competitive dynamics. The report provides detailed, data-driven forecasts for the market size of each segment throughout the specified forecast period (2025-2033). These growth projections are underpinned by a thorough examination of a multitude of influencing factors, encompassing macroeconomic trends, intricate shifts in consumer behavior and preferences, and the transformative impact of ongoing technological innovations.
Key Drivers of Retail Industry in Indonesia Growth
The sustained and robust growth of the Indonesian retail sector is propelled by a synergistic interplay of potent economic, dynamic technological, and conducive regulatory factors. A continuously expanding economy translates directly into rising disposable incomes, acting as a primary catalyst for increased consumer spending across all retail segments. Technological advancements are revolutionizing the retail landscape; the unprecedented ascent of e-commerce platforms and the widespread adoption of mobile payment solutions are dramatically enhancing consumer accessibility, convenience, and the overall shopping experience. Concurrently, proactive and supportive government policies, such as significant investments in infrastructure development and streamlined initiatives aimed at promoting ease of doing business, are fostering a positive market sentiment and actively encouraging substantial domestic and international investment inflows, further energizing the retail ecosystem.
Challenges in the Retail Industry in Indonesia Sector
Despite the positive growth outlook, the Indonesian retail industry faces several challenges. These include intense competition amongst both domestic and international players, supply chain complexities that impact inventory management, and navigating regulations concerning e-commerce and foreign investment. These factors can influence profitability and overall market stability. The lack of a well-developed cold chain logistics network poses significant constraints, impacting the quality and availability of fresh food products.
Emerging Opportunities in Retail Industry in Indonesia
The Indonesian retail market presents several exciting opportunities. The rising middle class creates a significant market for higher-value goods and services. The growing adoption of e-commerce offers immense potential for online retailers. Expansion into less-developed regions creates opportunities for new market penetration. Furthermore, the increasing focus on sustainability and ethical consumerism presents opportunities for businesses adopting environmentally and socially responsible practices.
Leading Players in the Retail Industry in Indonesia Market
- PT Matahari Putra Prima Tbk - A prominent player known for its diverse fashion and lifestyle offerings.
- Ramayana Lestari Sentosa - A well-established retailer with a strong presence in department stores and supermarkets.
- Mitra Adiperkasa (MAP) - A leading lifestyle retailer with a portfolio of international brands across fashion, F&B, and sports.
- Alfamart - A dominant force in the convenience store segment, widely recognized for its accessibility.
- PT Trans Retail Indonesia (Carrefour) - Operates large-format hypermarkets offering a wide range of products.
- Hero Supermarket Group - A significant player in the supermarket segment with a focus on fresh produce and groceries.
- Erajaya Swasembada - A leading retailer specializing in mobile devices, electronics, and related accessories.
- AEON Group - A Japanese conglomerate with a growing presence in Indonesia, offering department stores and shopping malls.
- Lotte Mart - A Korean retail giant with hypermarkets and department stores offering a broad assortment of goods.
- Indomaret - Another major convenience store chain, widely distributed across the archipelago.
Key Developments in Retail Industry in Indonesia Industry
- February 2021: Global apparel retailer Giordano strategically expanded its footprint by opening a significant, large-scale store in Bumi Raya City Mall, Pontianak. This milestone highlights the evolving retail landscape, signifying successful expansion into new and developing regional markets and underscoring the growing sophistication of retail infrastructure and consumer demand beyond the primary metropolitan centers.
- Ongoing Trend: Digital Transformation Acceleration - Retailers are increasingly investing in omnichannel strategies, integrating online and offline experiences to enhance customer engagement and convenience. This includes the adoption of advanced data analytics for personalized marketing and improved inventory management.
- Emergence of Specialized Retail Formats - Beyond traditional categories, there's a noticeable growth in specialized retail concepts, such as health and wellness stores, pet care centers, and experience-driven retail spaces, catering to niche consumer demands.
- Focus on Sustainability and Ethical Sourcing - Leading retailers are placing a greater emphasis on sustainable practices, ethical sourcing of products, and reducing their environmental impact, aligning with growing consumer awareness and demand for responsible consumption.
Strategic Outlook for Retail Industry in Indonesia Market
The Indonesian retail market presents a compelling landscape of significant long-term growth potential, fueled by an inherently favorable demographic profile characterized by a large, young, and increasingly affluent population. The continuous upward trajectory of consumer spending power, coupled with the relentless pace of technological advancements, creates a fertile ground for innovation and expansion. The accelerated and sustained expansion of the e-commerce sector, synergistically supported by ongoing, robust infrastructure development initiatives and a proactive, supportive government policy framework, is set to cultivate a vibrant, dynamic, and highly competitive retail ecosystem. Consequently, retail enterprises that strategically embrace and leverage cutting-edge technology, demonstrate a strong commitment to sustainability principles, and proactively cater to the ever-evolving needs and aspirations of the diverse Indonesian consumer base are exceptionally well-positioned to achieve sustained success and thrive in this exceptionally dynamic and promising market environment.
Retail Industry in Indonesia Segmentation
-
1. Product
- 1.1. Food and Beverages
- 1.2. Personal and Household Care
- 1.3. Apparel, Footwear, and Accessories
- 1.4. Furniture, Toys, and Hobby
- 1.5. Electronic and Household Appliances
- 1.6. Other Products
-
2. Distribution Channel
- 2.1. Supermar
- 2.2. Specialty Stores
- 2.3. Online
- 2.4. Other Distribution Channels
Retail Industry in Indonesia Segmentation By Geography
-
1. North America
- 1.1. United States
- 1.2. Canada
- 1.3. Mexico
-
2. South America
- 2.1. Brazil
- 2.2. Argentina
- 2.3. Rest of South America
-
3. Europe
- 3.1. United Kingdom
- 3.2. Germany
- 3.3. France
- 3.4. Italy
- 3.5. Spain
- 3.6. Russia
- 3.7. Benelux
- 3.8. Nordics
- 3.9. Rest of Europe
-
4. Middle East & Africa
- 4.1. Turkey
- 4.2. Israel
- 4.3. GCC
- 4.4. North Africa
- 4.5. South Africa
- 4.6. Rest of Middle East & Africa
-
5. Asia Pacific
- 5.1. China
- 5.2. India
- 5.3. Japan
- 5.4. South Korea
- 5.5. ASEAN
- 5.6. Oceania
- 5.7. Rest of Asia Pacific
Retail Industry in Indonesia Regional Market Share
Geographic Coverage of Retail Industry in Indonesia
Retail Industry in Indonesia REPORT HIGHLIGHTS
| Aspects | Details |
|---|---|
| Study Period | 2020-2034 |
| Base Year | 2025 |
| Estimated Year | 2026 |
| Forecast Period | 2026-2034 |
| Historical Period | 2020-2025 |
| Growth Rate | CAGR of 5.6% from 2020-2034 |
| Segmentation |
|
Table of Contents
- 1. Introduction
- 1.1. Research Scope
- 1.2. Market Segmentation
- 1.3. Research Objective
- 1.4. Definitions and Assumptions
- 2. Executive Summary
- 2.1. Market Snapshot
- 3. Market Dynamics
- 3.1. Market Drivers
- 3.2. Market Restrains
- 3.3. Market Trends
- 3.4. Market Opportunities
- 4. Market Factor Analysis
- 4.1. Porters Five Forces
- 4.1.1. Bargaining Power of Suppliers
- 4.1.2. Bargaining Power of Buyers
- 4.1.3. Threat of New Entrants
- 4.1.4. Threat of Substitutes
- 4.1.5. Competitive Rivalry
- 4.2. PESTEL analysis
- 4.3. BCG Analysis
- 4.3.1. Stars (High Growth, High Market Share)
- 4.3.2. Cash Cows (Low Growth, High Market Share)
- 4.3.3. Question Mark (High Growth, Low Market Share)
- 4.3.4. Dogs (Low Growth, Low Market Share)
- 4.4. Ansoff Matrix Analysis
- 4.5. Supply Chain Analysis
- 4.6. Regulatory Landscape
- 4.7. Current Market Potential and Opportunity Assessment (TAM–SAM–SOM Framework)
- 4.8. RAX Analyst Note
- 4.1. Porters Five Forces
- 5. Market Analysis, Insights and Forecast 2021-2033
- 5.1. Market Analysis, Insights and Forecast - by Product
- 5.1.1. Food and Beverages
- 5.1.2. Personal and Household Care
- 5.1.3. Apparel, Footwear, and Accessories
- 5.1.4. Furniture, Toys, and Hobby
- 5.1.5. Electronic and Household Appliances
- 5.1.6. Other Products
- 5.2. Market Analysis, Insights and Forecast - by Distribution Channel
- 5.2.1. Supermar
- 5.2.2. Specialty Stores
- 5.2.3. Online
- 5.2.4. Other Distribution Channels
- 5.3. Market Analysis, Insights and Forecast - by Region
- 5.3.1. North America
- 5.3.2. South America
- 5.3.3. Europe
- 5.3.4. Middle East & Africa
- 5.3.5. Asia Pacific
- 5.1. Market Analysis, Insights and Forecast - by Product
- 6. Global Retail Industry in Indonesia Analysis, Insights and Forecast, 2021-2033
- 6.1. Market Analysis, Insights and Forecast - by Product
- 6.1.1. Food and Beverages
- 6.1.2. Personal and Household Care
- 6.1.3. Apparel, Footwear, and Accessories
- 6.1.4. Furniture, Toys, and Hobby
- 6.1.5. Electronic and Household Appliances
- 6.1.6. Other Products
- 6.2. Market Analysis, Insights and Forecast - by Distribution Channel
- 6.2.1. Supermar
- 6.2.2. Specialty Stores
- 6.2.3. Online
- 6.2.4. Other Distribution Channels
- 6.1. Market Analysis, Insights and Forecast - by Product
- 7. North America Retail Industry in Indonesia Analysis, Insights and Forecast, 2020-2032
- 7.1. Market Analysis, Insights and Forecast - by Product
- 7.1.1. Food and Beverages
- 7.1.2. Personal and Household Care
- 7.1.3. Apparel, Footwear, and Accessories
- 7.1.4. Furniture, Toys, and Hobby
- 7.1.5. Electronic and Household Appliances
- 7.1.6. Other Products
- 7.2. Market Analysis, Insights and Forecast - by Distribution Channel
- 7.2.1. Supermar
- 7.2.2. Specialty Stores
- 7.2.3. Online
- 7.2.4. Other Distribution Channels
- 7.1. Market Analysis, Insights and Forecast - by Product
- 8. South America Retail Industry in Indonesia Analysis, Insights and Forecast, 2020-2032
- 8.1. Market Analysis, Insights and Forecast - by Product
- 8.1.1. Food and Beverages
- 8.1.2. Personal and Household Care
- 8.1.3. Apparel, Footwear, and Accessories
- 8.1.4. Furniture, Toys, and Hobby
- 8.1.5. Electronic and Household Appliances
- 8.1.6. Other Products
- 8.2. Market Analysis, Insights and Forecast - by Distribution Channel
- 8.2.1. Supermar
- 8.2.2. Specialty Stores
- 8.2.3. Online
- 8.2.4. Other Distribution Channels
- 8.1. Market Analysis, Insights and Forecast - by Product
- 9. Europe Retail Industry in Indonesia Analysis, Insights and Forecast, 2020-2032
- 9.1. Market Analysis, Insights and Forecast - by Product
- 9.1.1. Food and Beverages
- 9.1.2. Personal and Household Care
- 9.1.3. Apparel, Footwear, and Accessories
- 9.1.4. Furniture, Toys, and Hobby
- 9.1.5. Electronic and Household Appliances
- 9.1.6. Other Products
- 9.2. Market Analysis, Insights and Forecast - by Distribution Channel
- 9.2.1. Supermar
- 9.2.2. Specialty Stores
- 9.2.3. Online
- 9.2.4. Other Distribution Channels
- 9.1. Market Analysis, Insights and Forecast - by Product
- 10. Middle East & Africa Retail Industry in Indonesia Analysis, Insights and Forecast, 2020-2032
- 10.1. Market Analysis, Insights and Forecast - by Product
- 10.1.1. Food and Beverages
- 10.1.2. Personal and Household Care
- 10.1.3. Apparel, Footwear, and Accessories
- 10.1.4. Furniture, Toys, and Hobby
- 10.1.5. Electronic and Household Appliances
- 10.1.6. Other Products
- 10.2. Market Analysis, Insights and Forecast - by Distribution Channel
- 10.2.1. Supermar
- 10.2.2. Specialty Stores
- 10.2.3. Online
- 10.2.4. Other Distribution Channels
- 10.1. Market Analysis, Insights and Forecast - by Product
- 11. Asia Pacific Retail Industry in Indonesia Analysis, Insights and Forecast, 2020-2032
- 11.1. Market Analysis, Insights and Forecast - by Product
- 11.1.1. Food and Beverages
- 11.1.2. Personal and Household Care
- 11.1.3. Apparel, Footwear, and Accessories
- 11.1.4. Furniture, Toys, and Hobby
- 11.1.5. Electronic and Household Appliances
- 11.1.6. Other Products
- 11.2. Market Analysis, Insights and Forecast - by Distribution Channel
- 11.2.1. Supermar
- 11.2.2. Specialty Stores
- 11.2.3. Online
- 11.2.4. Other Distribution Channels
- 11.1. Market Analysis, Insights and Forecast - by Product
- 12. Competitive Analysis
- 12.1. Company Profiles
- 12.1.1 PT Matahari Putra Prima Tbk
- 12.1.1.1. Company Overview
- 12.1.1.2. Products
- 12.1.1.3. Company Financials
- 12.1.1.4. SWOT Analysis
- 12.1.2 Ramayana Lestari Sentosa
- 12.1.2.1. Company Overview
- 12.1.2.2. Products
- 12.1.2.3. Company Financials
- 12.1.2.4. SWOT Analysis
- 12.1.3 Mitra Adiperkasa
- 12.1.3.1. Company Overview
- 12.1.3.2. Products
- 12.1.3.3. Company Financials
- 12.1.3.4. SWOT Analysis
- 12.1.4 Alfartmart
- 12.1.4.1. Company Overview
- 12.1.4.2. Products
- 12.1.4.3. Company Financials
- 12.1.4.4. SWOT Analysis
- 12.1.5 PT Trans Retail Indonesia
- 12.1.5.1. Company Overview
- 12.1.5.2. Products
- 12.1.5.3. Company Financials
- 12.1.5.4. SWOT Analysis
- 12.1.6 Hero Supermarket Group
- 12.1.6.1. Company Overview
- 12.1.6.2. Products
- 12.1.6.3. Company Financials
- 12.1.6.4. SWOT Analysis
- 12.1.7 Erajaya Swasembada
- 12.1.7.1. Company Overview
- 12.1.7.2. Products
- 12.1.7.3. Company Financials
- 12.1.7.4. SWOT Analysis
- 12.1.8 AEON Group
- 12.1.8.1. Company Overview
- 12.1.8.2. Products
- 12.1.8.3. Company Financials
- 12.1.8.4. SWOT Analysis
- 12.1.9 Lotte Mart
- 12.1.9.1. Company Overview
- 12.1.9.2. Products
- 12.1.9.3. Company Financials
- 12.1.9.4. SWOT Analysis
- 12.1.10 Indomarket**List Not Exhaustive
- 12.1.10.1. Company Overview
- 12.1.10.2. Products
- 12.1.10.3. Company Financials
- 12.1.10.4. SWOT Analysis
- 12.1.1 PT Matahari Putra Prima Tbk
- 12.2. Market Entropy
- 12.2.1 Company's Key Areas Served
- 12.2.2 Recent Developments
- 12.3. Company Market Share Analysis 2025
- 12.3.1 Top 5 Companies Market Share Analysis
- 12.3.2 Top 3 Companies Market Share Analysis
- 12.4. List of Potential Customers
- 13. Research Methodology
List of Figures
- Figure 1: Global Retail Industry in Indonesia Revenue Breakdown (billion, %) by Region 2025 & 2033
- Figure 2: North America Retail Industry in Indonesia Revenue (billion), by Product 2025 & 2033
- Figure 3: North America Retail Industry in Indonesia Revenue Share (%), by Product 2025 & 2033
- Figure 4: North America Retail Industry in Indonesia Revenue (billion), by Distribution Channel 2025 & 2033
- Figure 5: North America Retail Industry in Indonesia Revenue Share (%), by Distribution Channel 2025 & 2033
- Figure 6: North America Retail Industry in Indonesia Revenue (billion), by Country 2025 & 2033
- Figure 7: North America Retail Industry in Indonesia Revenue Share (%), by Country 2025 & 2033
- Figure 8: South America Retail Industry in Indonesia Revenue (billion), by Product 2025 & 2033
- Figure 9: South America Retail Industry in Indonesia Revenue Share (%), by Product 2025 & 2033
- Figure 10: South America Retail Industry in Indonesia Revenue (billion), by Distribution Channel 2025 & 2033
- Figure 11: South America Retail Industry in Indonesia Revenue Share (%), by Distribution Channel 2025 & 2033
- Figure 12: South America Retail Industry in Indonesia Revenue (billion), by Country 2025 & 2033
- Figure 13: South America Retail Industry in Indonesia Revenue Share (%), by Country 2025 & 2033
- Figure 14: Europe Retail Industry in Indonesia Revenue (billion), by Product 2025 & 2033
- Figure 15: Europe Retail Industry in Indonesia Revenue Share (%), by Product 2025 & 2033
- Figure 16: Europe Retail Industry in Indonesia Revenue (billion), by Distribution Channel 2025 & 2033
- Figure 17: Europe Retail Industry in Indonesia Revenue Share (%), by Distribution Channel 2025 & 2033
- Figure 18: Europe Retail Industry in Indonesia Revenue (billion), by Country 2025 & 2033
- Figure 19: Europe Retail Industry in Indonesia Revenue Share (%), by Country 2025 & 2033
- Figure 20: Middle East & Africa Retail Industry in Indonesia Revenue (billion), by Product 2025 & 2033
- Figure 21: Middle East & Africa Retail Industry in Indonesia Revenue Share (%), by Product 2025 & 2033
- Figure 22: Middle East & Africa Retail Industry in Indonesia Revenue (billion), by Distribution Channel 2025 & 2033
- Figure 23: Middle East & Africa Retail Industry in Indonesia Revenue Share (%), by Distribution Channel 2025 & 2033
- Figure 24: Middle East & Africa Retail Industry in Indonesia Revenue (billion), by Country 2025 & 2033
- Figure 25: Middle East & Africa Retail Industry in Indonesia Revenue Share (%), by Country 2025 & 2033
- Figure 26: Asia Pacific Retail Industry in Indonesia Revenue (billion), by Product 2025 & 2033
- Figure 27: Asia Pacific Retail Industry in Indonesia Revenue Share (%), by Product 2025 & 2033
- Figure 28: Asia Pacific Retail Industry in Indonesia Revenue (billion), by Distribution Channel 2025 & 2033
- Figure 29: Asia Pacific Retail Industry in Indonesia Revenue Share (%), by Distribution Channel 2025 & 2033
- Figure 30: Asia Pacific Retail Industry in Indonesia Revenue (billion), by Country 2025 & 2033
- Figure 31: Asia Pacific Retail Industry in Indonesia Revenue Share (%), by Country 2025 & 2033
List of Tables
- Table 1: Global Retail Industry in Indonesia Revenue billion Forecast, by Product 2020 & 2033
- Table 2: Global Retail Industry in Indonesia Revenue billion Forecast, by Distribution Channel 2020 & 2033
- Table 3: Global Retail Industry in Indonesia Revenue billion Forecast, by Region 2020 & 2033
- Table 4: Global Retail Industry in Indonesia Revenue billion Forecast, by Product 2020 & 2033
- Table 5: Global Retail Industry in Indonesia Revenue billion Forecast, by Distribution Channel 2020 & 2033
- Table 6: Global Retail Industry in Indonesia Revenue billion Forecast, by Country 2020 & 2033
- Table 7: United States Retail Industry in Indonesia Revenue (billion) Forecast, by Application 2020 & 2033
- Table 8: Canada Retail Industry in Indonesia Revenue (billion) Forecast, by Application 2020 & 2033
- Table 9: Mexico Retail Industry in Indonesia Revenue (billion) Forecast, by Application 2020 & 2033
- Table 10: Global Retail Industry in Indonesia Revenue billion Forecast, by Product 2020 & 2033
- Table 11: Global Retail Industry in Indonesia Revenue billion Forecast, by Distribution Channel 2020 & 2033
- Table 12: Global Retail Industry in Indonesia Revenue billion Forecast, by Country 2020 & 2033
- Table 13: Brazil Retail Industry in Indonesia Revenue (billion) Forecast, by Application 2020 & 2033
- Table 14: Argentina Retail Industry in Indonesia Revenue (billion) Forecast, by Application 2020 & 2033
- Table 15: Rest of South America Retail Industry in Indonesia Revenue (billion) Forecast, by Application 2020 & 2033
- Table 16: Global Retail Industry in Indonesia Revenue billion Forecast, by Product 2020 & 2033
- Table 17: Global Retail Industry in Indonesia Revenue billion Forecast, by Distribution Channel 2020 & 2033
- Table 18: Global Retail Industry in Indonesia Revenue billion Forecast, by Country 2020 & 2033
- Table 19: United Kingdom Retail Industry in Indonesia Revenue (billion) Forecast, by Application 2020 & 2033
- Table 20: Germany Retail Industry in Indonesia Revenue (billion) Forecast, by Application 2020 & 2033
- Table 21: France Retail Industry in Indonesia Revenue (billion) Forecast, by Application 2020 & 2033
- Table 22: Italy Retail Industry in Indonesia Revenue (billion) Forecast, by Application 2020 & 2033
- Table 23: Spain Retail Industry in Indonesia Revenue (billion) Forecast, by Application 2020 & 2033
- Table 24: Russia Retail Industry in Indonesia Revenue (billion) Forecast, by Application 2020 & 2033
- Table 25: Benelux Retail Industry in Indonesia Revenue (billion) Forecast, by Application 2020 & 2033
- Table 26: Nordics Retail Industry in Indonesia Revenue (billion) Forecast, by Application 2020 & 2033
- Table 27: Rest of Europe Retail Industry in Indonesia Revenue (billion) Forecast, by Application 2020 & 2033
- Table 28: Global Retail Industry in Indonesia Revenue billion Forecast, by Product 2020 & 2033
- Table 29: Global Retail Industry in Indonesia Revenue billion Forecast, by Distribution Channel 2020 & 2033
- Table 30: Global Retail Industry in Indonesia Revenue billion Forecast, by Country 2020 & 2033
- Table 31: Turkey Retail Industry in Indonesia Revenue (billion) Forecast, by Application 2020 & 2033
- Table 32: Israel Retail Industry in Indonesia Revenue (billion) Forecast, by Application 2020 & 2033
- Table 33: GCC Retail Industry in Indonesia Revenue (billion) Forecast, by Application 2020 & 2033
- Table 34: North Africa Retail Industry in Indonesia Revenue (billion) Forecast, by Application 2020 & 2033
- Table 35: South Africa Retail Industry in Indonesia Revenue (billion) Forecast, by Application 2020 & 2033
- Table 36: Rest of Middle East & Africa Retail Industry in Indonesia Revenue (billion) Forecast, by Application 2020 & 2033
- Table 37: Global Retail Industry in Indonesia Revenue billion Forecast, by Product 2020 & 2033
- Table 38: Global Retail Industry in Indonesia Revenue billion Forecast, by Distribution Channel 2020 & 2033
- Table 39: Global Retail Industry in Indonesia Revenue billion Forecast, by Country 2020 & 2033
- Table 40: China Retail Industry in Indonesia Revenue (billion) Forecast, by Application 2020 & 2033
- Table 41: India Retail Industry in Indonesia Revenue (billion) Forecast, by Application 2020 & 2033
- Table 42: Japan Retail Industry in Indonesia Revenue (billion) Forecast, by Application 2020 & 2033
- Table 43: South Korea Retail Industry in Indonesia Revenue (billion) Forecast, by Application 2020 & 2033
- Table 44: ASEAN Retail Industry in Indonesia Revenue (billion) Forecast, by Application 2020 & 2033
- Table 45: Oceania Retail Industry in Indonesia Revenue (billion) Forecast, by Application 2020 & 2033
- Table 46: Rest of Asia Pacific Retail Industry in Indonesia Revenue (billion) Forecast, by Application 2020 & 2033
Frequently Asked Questions
1. What is the projected Compound Annual Growth Rate (CAGR) of the Retail Industry in Indonesia?
The projected CAGR is approximately 5.6%.
2. Which companies are prominent players in the Retail Industry in Indonesia?
Key companies in the market include PT Matahari Putra Prima Tbk, Ramayana Lestari Sentosa, Mitra Adiperkasa, Alfartmart, PT Trans Retail Indonesia, Hero Supermarket Group, Erajaya Swasembada, AEON Group, Lotte Mart, Indomarket**List Not Exhaustive.
3. What are the main segments of the Retail Industry in Indonesia?
The market segments include Product, Distribution Channel.
4. Can you provide details about the market size?
The market size is estimated to be USD 56.87 billion as of 2022.
5. What are some drivers contributing to market growth?
N/A
6. What are the notable trends driving market growth?
Online Retailing is Gaining More Traction. Yet Physical Retailing is Dominating the Market.
7. Are there any restraints impacting market growth?
N/A
8. Can you provide examples of recent developments in the market?
In February 2021, Apparel retailer Giordano unveiled a large-scale store in the newly opened Bumi Raya City Mall in Pontianak, Indonesia.
9. What pricing options are available for accessing the report?
Pricing options include single-user, multi-user, and enterprise licenses priced at USD 3800, USD 4500, and USD 5800 respectively.
10. Is the market size provided in terms of value or volume?
The market size is provided in terms of value, measured in billion.
11. Are there any specific market keywords associated with the report?
Yes, the market keyword associated with the report is "Retail Industry in Indonesia," which aids in identifying and referencing the specific market segment covered.
12. How do I determine which pricing option suits my needs best?
The pricing options vary based on user requirements and access needs. Individual users may opt for single-user licenses, while businesses requiring broader access may choose multi-user or enterprise licenses for cost-effective access to the report.
13. Are there any additional resources or data provided in the Retail Industry in Indonesia report?
While the report offers comprehensive insights, it's advisable to review the specific contents or supplementary materials provided to ascertain if additional resources or data are available.
14. How can I stay updated on further developments or reports in the Retail Industry in Indonesia?
To stay informed about further developments, trends, and reports in the Retail Industry in Indonesia, consider subscribing to industry newsletters, following relevant companies and organizations, or regularly checking reputable industry news sources and publications.
Methodology
Step 1 - Identification of Relevant Samples Size from Population Database


Step 2 - Approaches for Defining Global Market Size (Value, Volume* & Price*)

Note*: In applicable scenarios
Step 3 - Data Sources
Primary Research
- Web Analytics
- Survey Reports
- Research Institute
- Latest Research Reports
- Opinion Leaders
Secondary Research
- Annual Reports
- White Paper
- Latest Press Release
- Industry Association
- Paid Database
- Investor Presentations

Step 4 - Data Triangulation
Involves using different sources of information in order to increase the validity of a study
These sources are likely to be stakeholders in a program - participants, other researchers, program staff, other community members, and so on.
Then we put all data in single framework & apply various statistical tools to find out the dynamic on the market.
During the analysis stage, feedback from the stakeholder groups would be compared to determine areas of agreement as well as areas of divergence