Key Insights
The global Reverse Osmosis Cleaner market is projected for substantial growth, with an estimated market size of USD 7.87 billion in 2025, poised to expand at a Compound Annual Growth Rate (CAGR) of 8.2% through 2033. This robust expansion is fueled by escalating global demand for clean and potable water, driven by rapid industrialization and increasing population density. A significant contributor is the burgeoning need for efficient industrial wastewater treatment solutions, as regulatory pressures and environmental consciousness compel industries to adopt advanced purification technologies. Furthermore, the growing scarcity of freshwater resources worldwide, particularly in arid and semi-arid regions, is propelling the adoption of seawater desalination, a key application area for reverse osmosis cleaners. The market is segmented by type, with acidic, alkaline, and neutral cleaners all playing crucial roles depending on the specific RO membrane and contaminant profile. Innovations in cleaner formulations, focusing on enhanced efficacy, reduced environmental impact, and improved membrane longevity, are also acting as significant market drivers.
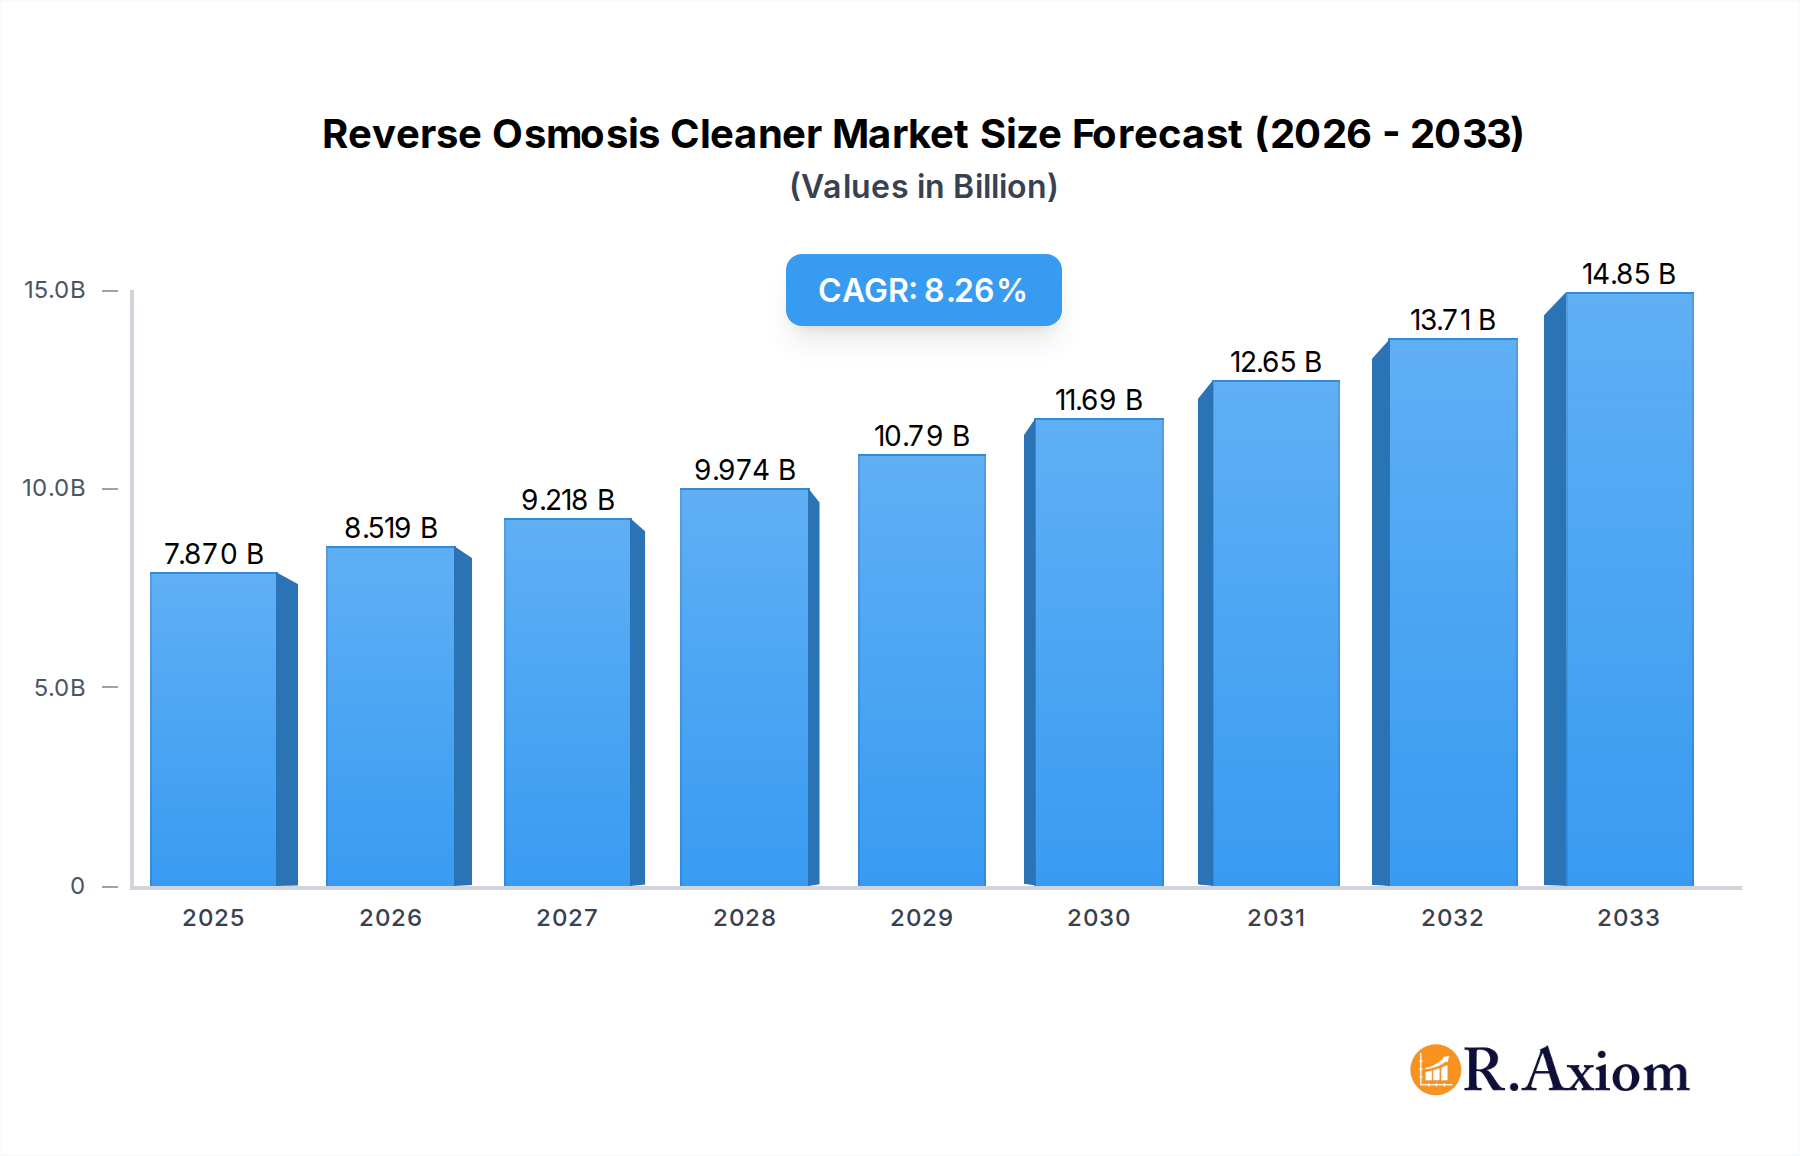
Reverse Osmosis Cleaner Market Size (In Billion)
The market's trajectory is further shaped by prevailing trends such as the increasing focus on sustainable water management practices and the development of smart RO systems that optimize cleaning cycles and chemical usage. The demand for specialized cleaners tailored for various industrial applications, including power generation, food and beverage, and pharmaceuticals, is also on the rise. While the market exhibits strong growth potential, certain restraints, such as the high initial investment for RO systems and the fluctuating costs of raw materials used in cleaner production, could pose challenges. However, the ongoing technological advancements in cleaner formulations and the increasing global emphasis on water security are expected to outweigh these limitations, ensuring a dynamic and expanding market landscape for reverse osmosis cleaners in the coming years. Leading companies like BASF, Dow, and Kemira are actively investing in research and development to introduce next-generation cleaning solutions.

Reverse Osmosis Cleaner Company Market Share
Comprehensive Report on the Global Reverse Osmosis Cleaner Market: Forecast to 2033
This in-depth market research report provides a thorough analysis of the global Reverse Osmosis (RO) Cleaner market, offering critical insights into its growth trajectory, segmentation, competitive landscape, and future potential. The study covers the historical period from 2019 to 2024, with the base year set at 2025, and projects market dynamics through 2033. This report is an indispensable resource for industry stakeholders seeking to understand market concentration, innovation drivers, regulatory frameworks, and emerging opportunities in the RO cleaner sector.
Reverse Osmosis Cleaner Market Concentration & Innovation
The global Reverse Osmosis Cleaner market exhibits a moderate level of concentration, with key players like BASF, Dow, American Water Chemicals, Accepta, and Kemira holding significant market share. Innovation remains a primary driver, fueled by increasing demand for high-purity water and stringent environmental regulations. Technological advancements focus on developing more effective, eco-friendly, and cost-efficient RO cleaning solutions. Regulatory frameworks, particularly concerning wastewater discharge and water quality standards, continue to shape product development and market entry. Product substitutes, such as alternative membrane cleaning technologies, pose a competitive challenge, but the specialized efficacy of RO cleaners in maintaining membrane performance ensures their continued relevance. End-user trends reveal a growing preference for automated cleaning solutions and customized formulations for specific water treatment challenges. Mergers and acquisitions (M&A) activities, with an estimated deal value of over one billion dollars, indicate strategic consolidation and expansion efforts by leading companies to enhance their product portfolios and market reach. Market share distribution is constantly evolving, with companies investing heavily in R&D to gain a competitive edge. The M&A landscape is expected to continue influencing market dynamics, with potential for further consolidation in the coming years.
Reverse Osmosis Cleaner Industry Trends & Insights
The Reverse Osmosis Cleaner industry is poised for substantial growth, driven by a confluence of accelerating factors and evolving market demands. The increasing global need for pure water for potable, industrial, and pharmaceutical applications is a primary growth catalyst, propelling the demand for effective RO membrane cleaning agents. Industrial wastewater treatment, a critical component of environmental sustainability, is witnessing a surge in the adoption of RO technologies, thereby augmenting the market for RO cleaners. Seawater desalination projects, particularly in water-scarce regions, are expanding rapidly, creating significant opportunities for specialized RO cleaning chemicals that ensure optimal membrane performance and longevity. The market is experiencing a Compound Annual Growth Rate (CAGR) of approximately six billion dollars, indicating robust expansion. Technological disruptions are a constant feature, with continuous advancements in the formulation of RO cleaners to enhance their efficacy against scaling, fouling, and biofouling. There is a growing consumer preference for environmentally friendly and biodegradable cleaning solutions, pushing manufacturers to invest in green chemistry. The competitive dynamics are intensifying, with both established players and emerging companies vying for market share through product differentiation, strategic partnerships, and aggressive marketing campaigns. Market penetration is increasing across various end-use industries, reflecting the growing awareness of the importance of regular membrane maintenance for efficient and cost-effective RO operations. The global market size for RO cleaners is projected to reach over twenty billion dollars by the end of the forecast period, underscoring its economic significance.
Dominant Markets & Segments in Reverse Osmosis Cleaner
The Asia Pacific region currently dominates the global Reverse Osmosis Cleaner market, driven by rapid industrialization, significant investments in water infrastructure, and stringent environmental regulations in countries like China and India. Economic policies promoting water recycling and reuse, coupled with substantial government initiatives to address water scarcity, are key drivers. The Industrial Wastewater Treatment application segment holds the largest market share, estimated at over ten billion dollars, due to the escalating need for industries to comply with discharge regulations and minimize their environmental footprint.
- Pure Water Production: This segment is experiencing robust growth, driven by the demand for ultrapure water in the electronics, pharmaceutical, and food & beverage industries. Economic growth and rising consumer awareness regarding water quality contribute to its expansion.
- Industrial Wastewater Treatment: This segment's dominance is attributed to increasing industrial output and stricter environmental laws. Investments in advanced wastewater treatment technologies, including RO, are substantial, leading to high demand for RO cleaners.
- Seawater Desalination: This segment is crucial for regions facing chronic water shortages. Significant infrastructure development and technological advancements in desalination plants are fueling the demand for specialized RO cleaners. Government investments and international aid play a vital role.
- Others: This segment includes niche applications such as medical device sterilization and laboratory water purification, which, while smaller individually, collectively represent a growing market.
Within the Type segmentation, Alkaline RO cleaners are witnessing the highest demand, estimated at over eight billion dollars, owing to their effectiveness in removing organic foulants and mineral scales. However, Acidic cleaners remain crucial for tackling inorganic scales and are expected to maintain a significant market share. The Neutral type caters to specific membrane sensitivities.
Reverse Osmosis Cleaner Product Developments
Recent product developments in the Reverse Osmosis Cleaner market are characterized by a focus on enhanced efficacy and environmental sustainability. Innovations include the introduction of low-foaming, biodegradable cleaning agents that minimize environmental impact while effectively removing complex foulants like silica and metal oxides. Companies are also developing specialized cleaners for high-pressure RO systems and membranes used in challenging water conditions, such as high-salinity seawater. These advanced formulations offer competitive advantages by extending membrane lifespan, improving flux rates, and reducing overall operational costs for end-users.
Report Scope & Segmentation Analysis
The global Reverse Osmosis Cleaner market is segmented based on application and type. The Application segments include Pure Water Production, Industrial Wastewater Treatment, Seawater Desalination, and Others. Pure Water Production is projected to grow at a CAGR of approximately six billion dollars, driven by the burgeoning semiconductor and pharmaceutical industries. Industrial Wastewater Treatment, estimated at over ten billion dollars, is expected to witness steady growth due to tightening environmental regulations. Seawater Desalination, with an estimated market size of over five billion dollars, is set to expand significantly in arid regions. The Type segments comprise Acidic, Alkaline, and Neutral RO cleaners. Alkaline cleaners, estimated at over eight billion dollars, currently hold the largest share, followed by Acidic cleaners, projected at over seven billion dollars. Neutral cleaners cater to specific membrane requirements.
Key Drivers of Reverse Osmosis Cleaner Growth
The growth of the Reverse Osmosis Cleaner market is propelled by several key factors. Firstly, the escalating global demand for clean and potable water, driven by population growth and increasing industrialization, necessitates efficient water treatment processes, including RO. Secondly, stringent environmental regulations mandating the treatment of industrial wastewater and the discharge of cleaner effluents are compelling industries to adopt advanced RO technologies, thereby increasing the demand for RO cleaners. Thirdly, technological advancements in RO membrane materials and cleaning formulations are leading to more effective and cost-efficient solutions. For example, the development of enzyme-based cleaners offers a more sustainable approach to biofouling removal. Finally, the expanding desalination capacity worldwide to combat water scarcity is a significant growth catalyst.
Challenges in the Reverse Osmosis Cleaner Sector
Despite the positive growth outlook, the Reverse Osmosis Cleaner sector faces several challenges. Regulatory hurdles, particularly concerning the disposal of cleaning wastewater and the approval of new chemical formulations, can impede market entry and product development. Supply chain disruptions, exacerbated by geopolitical events and raw material price volatility, can impact the availability and cost of key cleaning agents. Furthermore, the presence of numerous product substitutes and the increasing availability of in-house cleaning solutions by large industrial users can exert competitive pressure and limit market share expansion. The cost-effectiveness of RO cleaning solutions compared to membrane replacement also presents a consideration for end-users.
Emerging Opportunities in Reverse Osmosis Cleaner
Emerging opportunities in the Reverse Osmosis Cleaner market lie in the development of advanced, bio-based cleaning agents that cater to the growing demand for sustainable solutions. The expanding market for portable and modular RO systems in remote or disaster-stricken areas presents a new avenue for specialized cleaning products. Furthermore, the increasing adoption of smart water management technologies and the integration of IoT sensors for real-time monitoring of membrane performance are creating opportunities for intelligent RO cleaning solutions that can predict and prevent fouling. The focus on circular economy principles also opens doors for recyclable or regenerable cleaning agents.
Leading Players in the Reverse Osmosis Cleaner Market
- BASF
- Dow
- American Water Chemicals
- Accepta
- Kemira
- Pacific Water Technology
- Snowate
- Shandong Kairui Chemistry
- Shandong Taihe Technologies
- Beijing Bluestar Cleaning
- Prio
- JESDE
- Jiangsu Jiuwu Hi-Tech
- Zaozhuang Jialu Chemical
- Haideneng (Tianjin) Environmental Protection Technology
- Jiangsu Chaoran Chemical
Key Developments in Reverse Osmosis Cleaner Industry
- 2023/01: BASF launches a new line of bio-based RO cleaners focused on enhanced biodegradability and reduced environmental impact.
- 2022/07: Dow announces a strategic partnership with a leading membrane manufacturer to develop integrated cleaning solutions for advanced RO systems.
- 2021/11: American Water Chemicals expands its product portfolio with the introduction of specialized cleaners for high-salinity desalination applications.
- 2020/05: Kemira invests significantly in R&D to develop novel RO cleaning formulations targeting difficult-to-remove foulants.
Strategic Outlook for Reverse Osmosis Cleaner Market
The strategic outlook for the Reverse Osmosis Cleaner market is exceptionally strong, driven by the fundamental and escalating need for clean water across the globe. Future growth will be shaped by continued innovation in developing environmentally sustainable and highly efficient cleaning agents. Strategic partnerships between chemical manufacturers and membrane producers will be crucial for offering comprehensive solutions. The increasing adoption of advanced analytics and predictive maintenance in water treatment facilities will create demand for intelligent RO cleaning programs. Companies that can effectively address regulatory complexities and capitalize on emerging markets, particularly in developing economies, will be well-positioned for significant market expansion. The projected market size of over thirty billion dollars by 2033 underscores the immense future potential.
Reverse Osmosis Cleaner Segmentation
-
1. Application
- 1.1. Pure Water Production
- 1.2. Industrial Wastewater Treatment
- 1.3. Seawater Desalination
- 1.4. Others
-
2. Type
- 2.1. Acidic
- 2.2. Alkaline
- 2.3. Neutral
Reverse Osmosis Cleaner Segmentation By Geography
-
1. North America
- 1.1. United States
- 1.2. Canada
- 1.3. Mexico
-
2. South America
- 2.1. Brazil
- 2.2. Argentina
- 2.3. Rest of South America
-
3. Europe
- 3.1. United Kingdom
- 3.2. Germany
- 3.3. France
- 3.4. Italy
- 3.5. Spain
- 3.6. Russia
- 3.7. Benelux
- 3.8. Nordics
- 3.9. Rest of Europe
-
4. Middle East & Africa
- 4.1. Turkey
- 4.2. Israel
- 4.3. GCC
- 4.4. North Africa
- 4.5. South Africa
- 4.6. Rest of Middle East & Africa
-
5. Asia Pacific
- 5.1. China
- 5.2. India
- 5.3. Japan
- 5.4. South Korea
- 5.5. ASEAN
- 5.6. Oceania
- 5.7. Rest of Asia Pacific
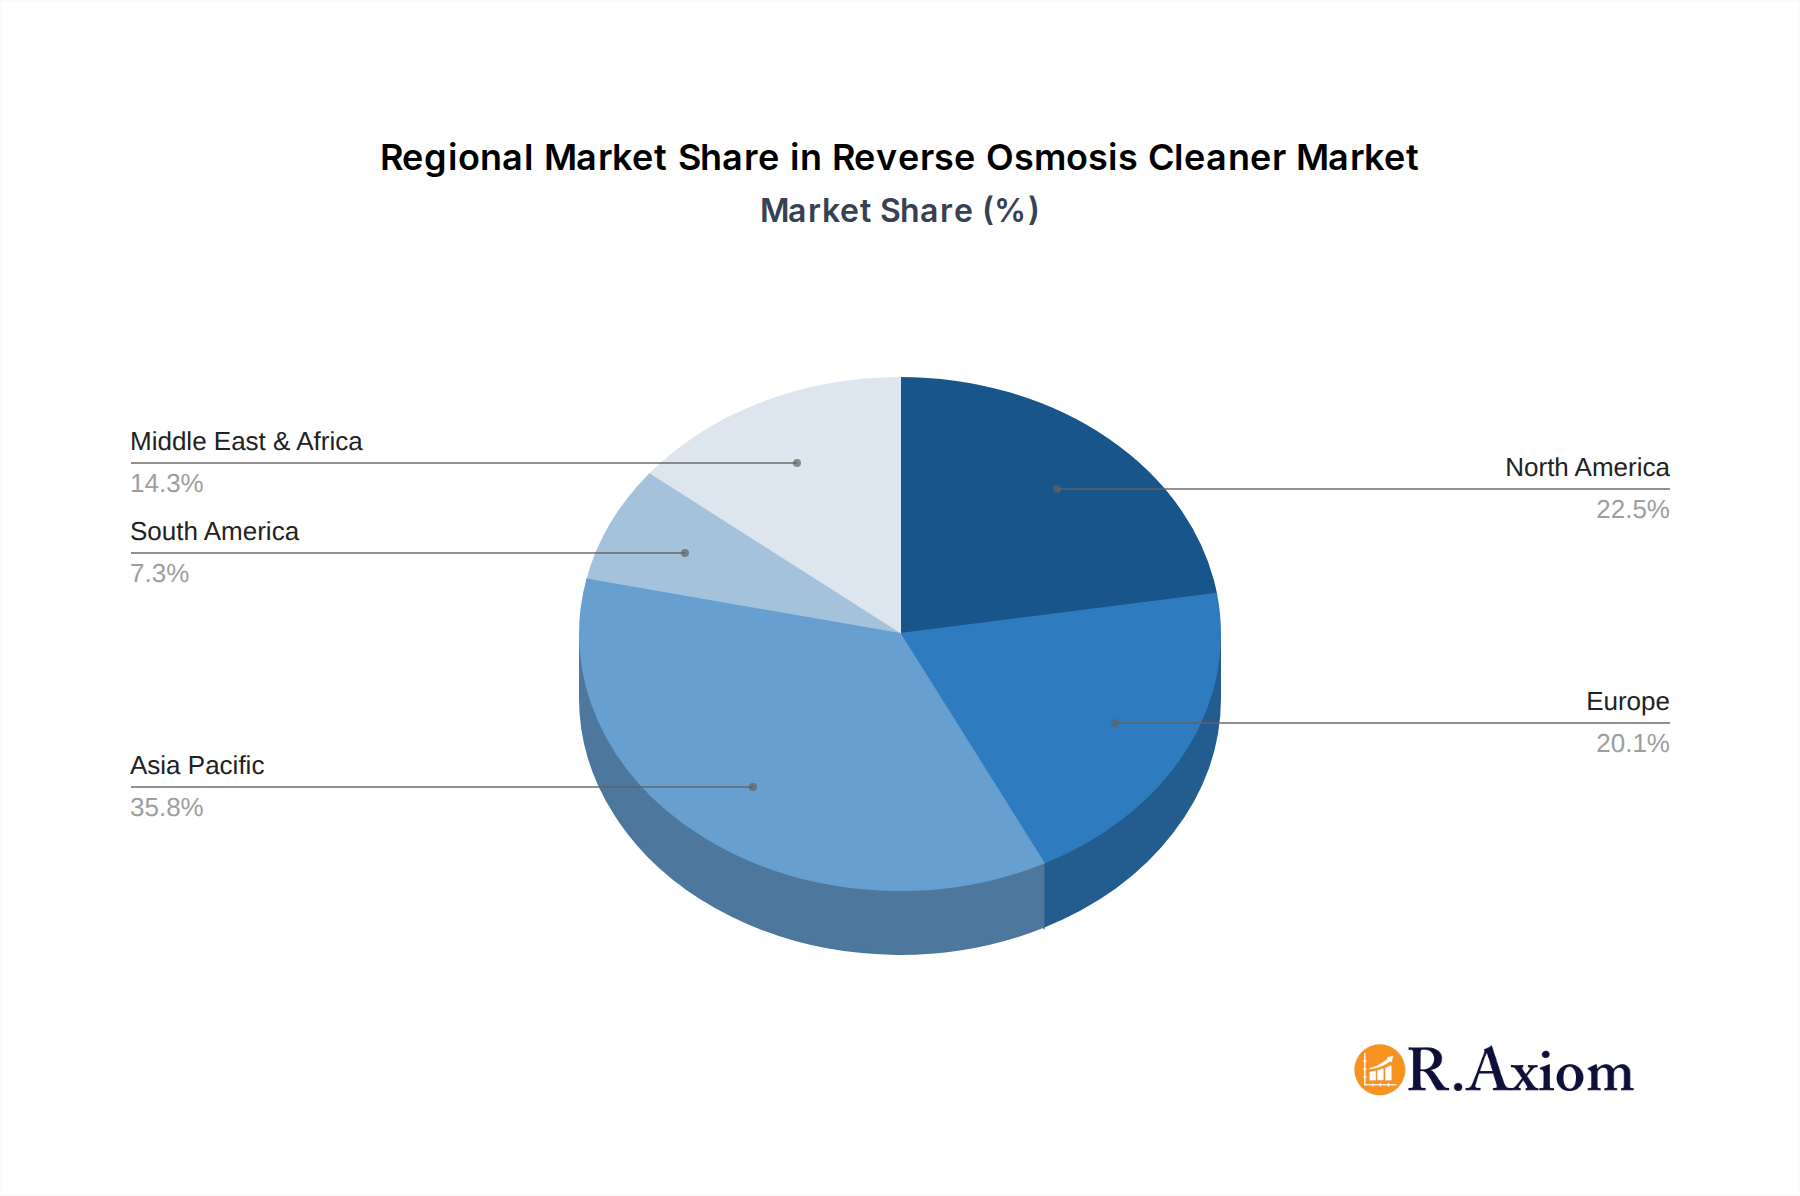
Reverse Osmosis Cleaner Regional Market Share
Geographic Coverage of Reverse Osmosis Cleaner
Reverse Osmosis Cleaner REPORT HIGHLIGHTS
| Aspects | Details |
|---|---|
| Study Period | 2020-2034 |
| Base Year | 2025 |
| Estimated Year | 2026 |
| Forecast Period | 2026-2034 |
| Historical Period | 2020-2025 |
| Growth Rate | CAGR of 8.2% from 2020-2034 |
| Segmentation |
|
Table of Contents
- 1. Introduction
- 1.1. Research Scope
- 1.2. Market Segmentation
- 1.3. Research Objective
- 1.4. Definitions and Assumptions
- 2. Executive Summary
- 2.1. Market Snapshot
- 3. Market Dynamics
- 3.1. Market Drivers
- 3.2. Market Restrains
- 3.3. Market Trends
- 3.4. Market Opportunities
- 4. Market Factor Analysis
- 4.1. Porters Five Forces
- 4.1.1. Bargaining Power of Suppliers
- 4.1.2. Bargaining Power of Buyers
- 4.1.3. Threat of New Entrants
- 4.1.4. Threat of Substitutes
- 4.1.5. Competitive Rivalry
- 4.2. PESTEL analysis
- 4.3. BCG Analysis
- 4.3.1. Stars (High Growth, High Market Share)
- 4.3.2. Cash Cows (Low Growth, High Market Share)
- 4.3.3. Question Mark (High Growth, Low Market Share)
- 4.3.4. Dogs (Low Growth, Low Market Share)
- 4.4. Ansoff Matrix Analysis
- 4.5. Supply Chain Analysis
- 4.6. Regulatory Landscape
- 4.7. Current Market Potential and Opportunity Assessment (TAM–SAM–SOM Framework)
- 4.8. RAX Analyst Note
- 4.1. Porters Five Forces
- 5. Market Analysis, Insights and Forecast 2021-2033
- 5.1. Market Analysis, Insights and Forecast - by Application
- 5.1.1. Pure Water Production
- 5.1.2. Industrial Wastewater Treatment
- 5.1.3. Seawater Desalination
- 5.1.4. Others
- 5.2. Market Analysis, Insights and Forecast - by Type
- 5.2.1. Acidic
- 5.2.2. Alkaline
- 5.2.3. Neutral
- 5.3. Market Analysis, Insights and Forecast - by Region
- 5.3.1. North America
- 5.3.2. South America
- 5.3.3. Europe
- 5.3.4. Middle East & Africa
- 5.3.5. Asia Pacific
- 5.1. Market Analysis, Insights and Forecast - by Application
- 6. Global Reverse Osmosis Cleaner Analysis, Insights and Forecast, 2021-2033
- 6.1. Market Analysis, Insights and Forecast - by Application
- 6.1.1. Pure Water Production
- 6.1.2. Industrial Wastewater Treatment
- 6.1.3. Seawater Desalination
- 6.1.4. Others
- 6.2. Market Analysis, Insights and Forecast - by Type
- 6.2.1. Acidic
- 6.2.2. Alkaline
- 6.2.3. Neutral
- 6.1. Market Analysis, Insights and Forecast - by Application
- 7. North America Reverse Osmosis Cleaner Analysis, Insights and Forecast, 2020-2032
- 7.1. Market Analysis, Insights and Forecast - by Application
- 7.1.1. Pure Water Production
- 7.1.2. Industrial Wastewater Treatment
- 7.1.3. Seawater Desalination
- 7.1.4. Others
- 7.2. Market Analysis, Insights and Forecast - by Type
- 7.2.1. Acidic
- 7.2.2. Alkaline
- 7.2.3. Neutral
- 7.1. Market Analysis, Insights and Forecast - by Application
- 8. South America Reverse Osmosis Cleaner Analysis, Insights and Forecast, 2020-2032
- 8.1. Market Analysis, Insights and Forecast - by Application
- 8.1.1. Pure Water Production
- 8.1.2. Industrial Wastewater Treatment
- 8.1.3. Seawater Desalination
- 8.1.4. Others
- 8.2. Market Analysis, Insights and Forecast - by Type
- 8.2.1. Acidic
- 8.2.2. Alkaline
- 8.2.3. Neutral
- 8.1. Market Analysis, Insights and Forecast - by Application
- 9. Europe Reverse Osmosis Cleaner Analysis, Insights and Forecast, 2020-2032
- 9.1. Market Analysis, Insights and Forecast - by Application
- 9.1.1. Pure Water Production
- 9.1.2. Industrial Wastewater Treatment
- 9.1.3. Seawater Desalination
- 9.1.4. Others
- 9.2. Market Analysis, Insights and Forecast - by Type
- 9.2.1. Acidic
- 9.2.2. Alkaline
- 9.2.3. Neutral
- 9.1. Market Analysis, Insights and Forecast - by Application
- 10. Middle East & Africa Reverse Osmosis Cleaner Analysis, Insights and Forecast, 2020-2032
- 10.1. Market Analysis, Insights and Forecast - by Application
- 10.1.1. Pure Water Production
- 10.1.2. Industrial Wastewater Treatment
- 10.1.3. Seawater Desalination
- 10.1.4. Others
- 10.2. Market Analysis, Insights and Forecast - by Type
- 10.2.1. Acidic
- 10.2.2. Alkaline
- 10.2.3. Neutral
- 10.1. Market Analysis, Insights and Forecast - by Application
- 11. Asia Pacific Reverse Osmosis Cleaner Analysis, Insights and Forecast, 2020-2032
- 11.1. Market Analysis, Insights and Forecast - by Application
- 11.1.1. Pure Water Production
- 11.1.2. Industrial Wastewater Treatment
- 11.1.3. Seawater Desalination
- 11.1.4. Others
- 11.2. Market Analysis, Insights and Forecast - by Type
- 11.2.1. Acidic
- 11.2.2. Alkaline
- 11.2.3. Neutral
- 11.1. Market Analysis, Insights and Forecast - by Application
- 12. Competitive Analysis
- 12.1. Company Profiles
- 12.1.1 BASF
- 12.1.1.1. Company Overview
- 12.1.1.2. Products
- 12.1.1.3. Company Financials
- 12.1.1.4. SWOT Analysis
- 12.1.2 Dow
- 12.1.2.1. Company Overview
- 12.1.2.2. Products
- 12.1.2.3. Company Financials
- 12.1.2.4. SWOT Analysis
- 12.1.3 American Water Chemicals
- 12.1.3.1. Company Overview
- 12.1.3.2. Products
- 12.1.3.3. Company Financials
- 12.1.3.4. SWOT Analysis
- 12.1.4 Accepta
- 12.1.4.1. Company Overview
- 12.1.4.2. Products
- 12.1.4.3. Company Financials
- 12.1.4.4. SWOT Analysis
- 12.1.5 Kemira
- 12.1.5.1. Company Overview
- 12.1.5.2. Products
- 12.1.5.3. Company Financials
- 12.1.5.4. SWOT Analysis
- 12.1.6 Pacific Water Technology
- 12.1.6.1. Company Overview
- 12.1.6.2. Products
- 12.1.6.3. Company Financials
- 12.1.6.4. SWOT Analysis
- 12.1.7 Snowate
- 12.1.7.1. Company Overview
- 12.1.7.2. Products
- 12.1.7.3. Company Financials
- 12.1.7.4. SWOT Analysis
- 12.1.8 Shandong Kairui Chemistry
- 12.1.8.1. Company Overview
- 12.1.8.2. Products
- 12.1.8.3. Company Financials
- 12.1.8.4. SWOT Analysis
- 12.1.9 Shandong Taihe Technologies
- 12.1.9.1. Company Overview
- 12.1.9.2. Products
- 12.1.9.3. Company Financials
- 12.1.9.4. SWOT Analysis
- 12.1.10 Beijing Bluestar Cleaning
- 12.1.10.1. Company Overview
- 12.1.10.2. Products
- 12.1.10.3. Company Financials
- 12.1.10.4. SWOT Analysis
- 12.1.11 Prio
- 12.1.11.1. Company Overview
- 12.1.11.2. Products
- 12.1.11.3. Company Financials
- 12.1.11.4. SWOT Analysis
- 12.1.12 JESDE
- 12.1.12.1. Company Overview
- 12.1.12.2. Products
- 12.1.12.3. Company Financials
- 12.1.12.4. SWOT Analysis
- 12.1.13 Jiangsu Jiuwu Hi-Tech
- 12.1.13.1. Company Overview
- 12.1.13.2. Products
- 12.1.13.3. Company Financials
- 12.1.13.4. SWOT Analysis
- 12.1.14 Zaozhuang Jialu Chemical
- 12.1.14.1. Company Overview
- 12.1.14.2. Products
- 12.1.14.3. Company Financials
- 12.1.14.4. SWOT Analysis
- 12.1.15 Haideneng (Tianjin) Environmental Protection Technology
- 12.1.15.1. Company Overview
- 12.1.15.2. Products
- 12.1.15.3. Company Financials
- 12.1.15.4. SWOT Analysis
- 12.1.16 Jiangsu Chaoran Chemical
- 12.1.16.1. Company Overview
- 12.1.16.2. Products
- 12.1.16.3. Company Financials
- 12.1.16.4. SWOT Analysis
- 12.1.1 BASF
- 12.2. Market Entropy
- 12.2.1 Company's Key Areas Served
- 12.2.2 Recent Developments
- 12.3. Company Market Share Analysis 2025
- 12.3.1 Top 5 Companies Market Share Analysis
- 12.3.2 Top 3 Companies Market Share Analysis
- 12.4. List of Potential Customers
- 13. Research Methodology
List of Figures
- Figure 1: Global Reverse Osmosis Cleaner Revenue Breakdown (billion, %) by Region 2025 & 2033
- Figure 2: Global Reverse Osmosis Cleaner Volume Breakdown (K, %) by Region 2025 & 2033
- Figure 3: North America Reverse Osmosis Cleaner Revenue (billion), by Application 2025 & 2033
- Figure 4: North America Reverse Osmosis Cleaner Volume (K), by Application 2025 & 2033
- Figure 5: North America Reverse Osmosis Cleaner Revenue Share (%), by Application 2025 & 2033
- Figure 6: North America Reverse Osmosis Cleaner Volume Share (%), by Application 2025 & 2033
- Figure 7: North America Reverse Osmosis Cleaner Revenue (billion), by Type 2025 & 2033
- Figure 8: North America Reverse Osmosis Cleaner Volume (K), by Type 2025 & 2033
- Figure 9: North America Reverse Osmosis Cleaner Revenue Share (%), by Type 2025 & 2033
- Figure 10: North America Reverse Osmosis Cleaner Volume Share (%), by Type 2025 & 2033
- Figure 11: North America Reverse Osmosis Cleaner Revenue (billion), by Country 2025 & 2033
- Figure 12: North America Reverse Osmosis Cleaner Volume (K), by Country 2025 & 2033
- Figure 13: North America Reverse Osmosis Cleaner Revenue Share (%), by Country 2025 & 2033
- Figure 14: North America Reverse Osmosis Cleaner Volume Share (%), by Country 2025 & 2033
- Figure 15: South America Reverse Osmosis Cleaner Revenue (billion), by Application 2025 & 2033
- Figure 16: South America Reverse Osmosis Cleaner Volume (K), by Application 2025 & 2033
- Figure 17: South America Reverse Osmosis Cleaner Revenue Share (%), by Application 2025 & 2033
- Figure 18: South America Reverse Osmosis Cleaner Volume Share (%), by Application 2025 & 2033
- Figure 19: South America Reverse Osmosis Cleaner Revenue (billion), by Type 2025 & 2033
- Figure 20: South America Reverse Osmosis Cleaner Volume (K), by Type 2025 & 2033
- Figure 21: South America Reverse Osmosis Cleaner Revenue Share (%), by Type 2025 & 2033
- Figure 22: South America Reverse Osmosis Cleaner Volume Share (%), by Type 2025 & 2033
- Figure 23: South America Reverse Osmosis Cleaner Revenue (billion), by Country 2025 & 2033
- Figure 24: South America Reverse Osmosis Cleaner Volume (K), by Country 2025 & 2033
- Figure 25: South America Reverse Osmosis Cleaner Revenue Share (%), by Country 2025 & 2033
- Figure 26: South America Reverse Osmosis Cleaner Volume Share (%), by Country 2025 & 2033
- Figure 27: Europe Reverse Osmosis Cleaner Revenue (billion), by Application 2025 & 2033
- Figure 28: Europe Reverse Osmosis Cleaner Volume (K), by Application 2025 & 2033
- Figure 29: Europe Reverse Osmosis Cleaner Revenue Share (%), by Application 2025 & 2033
- Figure 30: Europe Reverse Osmosis Cleaner Volume Share (%), by Application 2025 & 2033
- Figure 31: Europe Reverse Osmosis Cleaner Revenue (billion), by Type 2025 & 2033
- Figure 32: Europe Reverse Osmosis Cleaner Volume (K), by Type 2025 & 2033
- Figure 33: Europe Reverse Osmosis Cleaner Revenue Share (%), by Type 2025 & 2033
- Figure 34: Europe Reverse Osmosis Cleaner Volume Share (%), by Type 2025 & 2033
- Figure 35: Europe Reverse Osmosis Cleaner Revenue (billion), by Country 2025 & 2033
- Figure 36: Europe Reverse Osmosis Cleaner Volume (K), by Country 2025 & 2033
- Figure 37: Europe Reverse Osmosis Cleaner Revenue Share (%), by Country 2025 & 2033
- Figure 38: Europe Reverse Osmosis Cleaner Volume Share (%), by Country 2025 & 2033
- Figure 39: Middle East & Africa Reverse Osmosis Cleaner Revenue (billion), by Application 2025 & 2033
- Figure 40: Middle East & Africa Reverse Osmosis Cleaner Volume (K), by Application 2025 & 2033
- Figure 41: Middle East & Africa Reverse Osmosis Cleaner Revenue Share (%), by Application 2025 & 2033
- Figure 42: Middle East & Africa Reverse Osmosis Cleaner Volume Share (%), by Application 2025 & 2033
- Figure 43: Middle East & Africa Reverse Osmosis Cleaner Revenue (billion), by Type 2025 & 2033
- Figure 44: Middle East & Africa Reverse Osmosis Cleaner Volume (K), by Type 2025 & 2033
- Figure 45: Middle East & Africa Reverse Osmosis Cleaner Revenue Share (%), by Type 2025 & 2033
- Figure 46: Middle East & Africa Reverse Osmosis Cleaner Volume Share (%), by Type 2025 & 2033
- Figure 47: Middle East & Africa Reverse Osmosis Cleaner Revenue (billion), by Country 2025 & 2033
- Figure 48: Middle East & Africa Reverse Osmosis Cleaner Volume (K), by Country 2025 & 2033
- Figure 49: Middle East & Africa Reverse Osmosis Cleaner Revenue Share (%), by Country 2025 & 2033
- Figure 50: Middle East & Africa Reverse Osmosis Cleaner Volume Share (%), by Country 2025 & 2033
- Figure 51: Asia Pacific Reverse Osmosis Cleaner Revenue (billion), by Application 2025 & 2033
- Figure 52: Asia Pacific Reverse Osmosis Cleaner Volume (K), by Application 2025 & 2033
- Figure 53: Asia Pacific Reverse Osmosis Cleaner Revenue Share (%), by Application 2025 & 2033
- Figure 54: Asia Pacific Reverse Osmosis Cleaner Volume Share (%), by Application 2025 & 2033
- Figure 55: Asia Pacific Reverse Osmosis Cleaner Revenue (billion), by Type 2025 & 2033
- Figure 56: Asia Pacific Reverse Osmosis Cleaner Volume (K), by Type 2025 & 2033
- Figure 57: Asia Pacific Reverse Osmosis Cleaner Revenue Share (%), by Type 2025 & 2033
- Figure 58: Asia Pacific Reverse Osmosis Cleaner Volume Share (%), by Type 2025 & 2033
- Figure 59: Asia Pacific Reverse Osmosis Cleaner Revenue (billion), by Country 2025 & 2033
- Figure 60: Asia Pacific Reverse Osmosis Cleaner Volume (K), by Country 2025 & 2033
- Figure 61: Asia Pacific Reverse Osmosis Cleaner Revenue Share (%), by Country 2025 & 2033
- Figure 62: Asia Pacific Reverse Osmosis Cleaner Volume Share (%), by Country 2025 & 2033
List of Tables
- Table 1: Global Reverse Osmosis Cleaner Revenue billion Forecast, by Application 2020 & 2033
- Table 2: Global Reverse Osmosis Cleaner Volume K Forecast, by Application 2020 & 2033
- Table 3: Global Reverse Osmosis Cleaner Revenue billion Forecast, by Type 2020 & 2033
- Table 4: Global Reverse Osmosis Cleaner Volume K Forecast, by Type 2020 & 2033
- Table 5: Global Reverse Osmosis Cleaner Revenue billion Forecast, by Region 2020 & 2033
- Table 6: Global Reverse Osmosis Cleaner Volume K Forecast, by Region 2020 & 2033
- Table 7: Global Reverse Osmosis Cleaner Revenue billion Forecast, by Application 2020 & 2033
- Table 8: Global Reverse Osmosis Cleaner Volume K Forecast, by Application 2020 & 2033
- Table 9: Global Reverse Osmosis Cleaner Revenue billion Forecast, by Type 2020 & 2033
- Table 10: Global Reverse Osmosis Cleaner Volume K Forecast, by Type 2020 & 2033
- Table 11: Global Reverse Osmosis Cleaner Revenue billion Forecast, by Country 2020 & 2033
- Table 12: Global Reverse Osmosis Cleaner Volume K Forecast, by Country 2020 & 2033
- Table 13: United States Reverse Osmosis Cleaner Revenue (billion) Forecast, by Application 2020 & 2033
- Table 14: United States Reverse Osmosis Cleaner Volume (K) Forecast, by Application 2020 & 2033
- Table 15: Canada Reverse Osmosis Cleaner Revenue (billion) Forecast, by Application 2020 & 2033
- Table 16: Canada Reverse Osmosis Cleaner Volume (K) Forecast, by Application 2020 & 2033
- Table 17: Mexico Reverse Osmosis Cleaner Revenue (billion) Forecast, by Application 2020 & 2033
- Table 18: Mexico Reverse Osmosis Cleaner Volume (K) Forecast, by Application 2020 & 2033
- Table 19: Global Reverse Osmosis Cleaner Revenue billion Forecast, by Application 2020 & 2033
- Table 20: Global Reverse Osmosis Cleaner Volume K Forecast, by Application 2020 & 2033
- Table 21: Global Reverse Osmosis Cleaner Revenue billion Forecast, by Type 2020 & 2033
- Table 22: Global Reverse Osmosis Cleaner Volume K Forecast, by Type 2020 & 2033
- Table 23: Global Reverse Osmosis Cleaner Revenue billion Forecast, by Country 2020 & 2033
- Table 24: Global Reverse Osmosis Cleaner Volume K Forecast, by Country 2020 & 2033
- Table 25: Brazil Reverse Osmosis Cleaner Revenue (billion) Forecast, by Application 2020 & 2033
- Table 26: Brazil Reverse Osmosis Cleaner Volume (K) Forecast, by Application 2020 & 2033
- Table 27: Argentina Reverse Osmosis Cleaner Revenue (billion) Forecast, by Application 2020 & 2033
- Table 28: Argentina Reverse Osmosis Cleaner Volume (K) Forecast, by Application 2020 & 2033
- Table 29: Rest of South America Reverse Osmosis Cleaner Revenue (billion) Forecast, by Application 2020 & 2033
- Table 30: Rest of South America Reverse Osmosis Cleaner Volume (K) Forecast, by Application 2020 & 2033
- Table 31: Global Reverse Osmosis Cleaner Revenue billion Forecast, by Application 2020 & 2033
- Table 32: Global Reverse Osmosis Cleaner Volume K Forecast, by Application 2020 & 2033
- Table 33: Global Reverse Osmosis Cleaner Revenue billion Forecast, by Type 2020 & 2033
- Table 34: Global Reverse Osmosis Cleaner Volume K Forecast, by Type 2020 & 2033
- Table 35: Global Reverse Osmosis Cleaner Revenue billion Forecast, by Country 2020 & 2033
- Table 36: Global Reverse Osmosis Cleaner Volume K Forecast, by Country 2020 & 2033
- Table 37: United Kingdom Reverse Osmosis Cleaner Revenue (billion) Forecast, by Application 2020 & 2033
- Table 38: United Kingdom Reverse Osmosis Cleaner Volume (K) Forecast, by Application 2020 & 2033
- Table 39: Germany Reverse Osmosis Cleaner Revenue (billion) Forecast, by Application 2020 & 2033
- Table 40: Germany Reverse Osmosis Cleaner Volume (K) Forecast, by Application 2020 & 2033
- Table 41: France Reverse Osmosis Cleaner Revenue (billion) Forecast, by Application 2020 & 2033
- Table 42: France Reverse Osmosis Cleaner Volume (K) Forecast, by Application 2020 & 2033
- Table 43: Italy Reverse Osmosis Cleaner Revenue (billion) Forecast, by Application 2020 & 2033
- Table 44: Italy Reverse Osmosis Cleaner Volume (K) Forecast, by Application 2020 & 2033
- Table 45: Spain Reverse Osmosis Cleaner Revenue (billion) Forecast, by Application 2020 & 2033
- Table 46: Spain Reverse Osmosis Cleaner Volume (K) Forecast, by Application 2020 & 2033
- Table 47: Russia Reverse Osmosis Cleaner Revenue (billion) Forecast, by Application 2020 & 2033
- Table 48: Russia Reverse Osmosis Cleaner Volume (K) Forecast, by Application 2020 & 2033
- Table 49: Benelux Reverse Osmosis Cleaner Revenue (billion) Forecast, by Application 2020 & 2033
- Table 50: Benelux Reverse Osmosis Cleaner Volume (K) Forecast, by Application 2020 & 2033
- Table 51: Nordics Reverse Osmosis Cleaner Revenue (billion) Forecast, by Application 2020 & 2033
- Table 52: Nordics Reverse Osmosis Cleaner Volume (K) Forecast, by Application 2020 & 2033
- Table 53: Rest of Europe Reverse Osmosis Cleaner Revenue (billion) Forecast, by Application 2020 & 2033
- Table 54: Rest of Europe Reverse Osmosis Cleaner Volume (K) Forecast, by Application 2020 & 2033
- Table 55: Global Reverse Osmosis Cleaner Revenue billion Forecast, by Application 2020 & 2033
- Table 56: Global Reverse Osmosis Cleaner Volume K Forecast, by Application 2020 & 2033
- Table 57: Global Reverse Osmosis Cleaner Revenue billion Forecast, by Type 2020 & 2033
- Table 58: Global Reverse Osmosis Cleaner Volume K Forecast, by Type 2020 & 2033
- Table 59: Global Reverse Osmosis Cleaner Revenue billion Forecast, by Country 2020 & 2033
- Table 60: Global Reverse Osmosis Cleaner Volume K Forecast, by Country 2020 & 2033
- Table 61: Turkey Reverse Osmosis Cleaner Revenue (billion) Forecast, by Application 2020 & 2033
- Table 62: Turkey Reverse Osmosis Cleaner Volume (K) Forecast, by Application 2020 & 2033
- Table 63: Israel Reverse Osmosis Cleaner Revenue (billion) Forecast, by Application 2020 & 2033
- Table 64: Israel Reverse Osmosis Cleaner Volume (K) Forecast, by Application 2020 & 2033
- Table 65: GCC Reverse Osmosis Cleaner Revenue (billion) Forecast, by Application 2020 & 2033
- Table 66: GCC Reverse Osmosis Cleaner Volume (K) Forecast, by Application 2020 & 2033
- Table 67: North Africa Reverse Osmosis Cleaner Revenue (billion) Forecast, by Application 2020 & 2033
- Table 68: North Africa Reverse Osmosis Cleaner Volume (K) Forecast, by Application 2020 & 2033
- Table 69: South Africa Reverse Osmosis Cleaner Revenue (billion) Forecast, by Application 2020 & 2033
- Table 70: South Africa Reverse Osmosis Cleaner Volume (K) Forecast, by Application 2020 & 2033
- Table 71: Rest of Middle East & Africa Reverse Osmosis Cleaner Revenue (billion) Forecast, by Application 2020 & 2033
- Table 72: Rest of Middle East & Africa Reverse Osmosis Cleaner Volume (K) Forecast, by Application 2020 & 2033
- Table 73: Global Reverse Osmosis Cleaner Revenue billion Forecast, by Application 2020 & 2033
- Table 74: Global Reverse Osmosis Cleaner Volume K Forecast, by Application 2020 & 2033
- Table 75: Global Reverse Osmosis Cleaner Revenue billion Forecast, by Type 2020 & 2033
- Table 76: Global Reverse Osmosis Cleaner Volume K Forecast, by Type 2020 & 2033
- Table 77: Global Reverse Osmosis Cleaner Revenue billion Forecast, by Country 2020 & 2033
- Table 78: Global Reverse Osmosis Cleaner Volume K Forecast, by Country 2020 & 2033
- Table 79: China Reverse Osmosis Cleaner Revenue (billion) Forecast, by Application 2020 & 2033
- Table 80: China Reverse Osmosis Cleaner Volume (K) Forecast, by Application 2020 & 2033
- Table 81: India Reverse Osmosis Cleaner Revenue (billion) Forecast, by Application 2020 & 2033
- Table 82: India Reverse Osmosis Cleaner Volume (K) Forecast, by Application 2020 & 2033
- Table 83: Japan Reverse Osmosis Cleaner Revenue (billion) Forecast, by Application 2020 & 2033
- Table 84: Japan Reverse Osmosis Cleaner Volume (K) Forecast, by Application 2020 & 2033
- Table 85: South Korea Reverse Osmosis Cleaner Revenue (billion) Forecast, by Application 2020 & 2033
- Table 86: South Korea Reverse Osmosis Cleaner Volume (K) Forecast, by Application 2020 & 2033
- Table 87: ASEAN Reverse Osmosis Cleaner Revenue (billion) Forecast, by Application 2020 & 2033
- Table 88: ASEAN Reverse Osmosis Cleaner Volume (K) Forecast, by Application 2020 & 2033
- Table 89: Oceania Reverse Osmosis Cleaner Revenue (billion) Forecast, by Application 2020 & 2033
- Table 90: Oceania Reverse Osmosis Cleaner Volume (K) Forecast, by Application 2020 & 2033
- Table 91: Rest of Asia Pacific Reverse Osmosis Cleaner Revenue (billion) Forecast, by Application 2020 & 2033
- Table 92: Rest of Asia Pacific Reverse Osmosis Cleaner Volume (K) Forecast, by Application 2020 & 2033
Frequently Asked Questions
1. What is the projected Compound Annual Growth Rate (CAGR) of the Reverse Osmosis Cleaner?
The projected CAGR is approximately 8.2%.
2. Which companies are prominent players in the Reverse Osmosis Cleaner?
Key companies in the market include BASF, Dow, American Water Chemicals, Accepta, Kemira, Pacific Water Technology, Snowate, Shandong Kairui Chemistry, Shandong Taihe Technologies, Beijing Bluestar Cleaning, Prio, JESDE, Jiangsu Jiuwu Hi-Tech, Zaozhuang Jialu Chemical, Haideneng (Tianjin) Environmental Protection Technology, Jiangsu Chaoran Chemical.
3. What are the main segments of the Reverse Osmosis Cleaner?
The market segments include Application, Type.
4. Can you provide details about the market size?
The market size is estimated to be USD 7.87 billion as of 2022.
5. What are some drivers contributing to market growth?
N/A
6. What are the notable trends driving market growth?
N/A
7. Are there any restraints impacting market growth?
N/A
8. Can you provide examples of recent developments in the market?
N/A
9. What pricing options are available for accessing the report?
Pricing options include single-user, multi-user, and enterprise licenses priced at USD 3950.00, USD 5925.00, and USD 7900.00 respectively.
10. Is the market size provided in terms of value or volume?
The market size is provided in terms of value, measured in billion and volume, measured in K.
11. Are there any specific market keywords associated with the report?
Yes, the market keyword associated with the report is "Reverse Osmosis Cleaner," which aids in identifying and referencing the specific market segment covered.
12. How do I determine which pricing option suits my needs best?
The pricing options vary based on user requirements and access needs. Individual users may opt for single-user licenses, while businesses requiring broader access may choose multi-user or enterprise licenses for cost-effective access to the report.
13. Are there any additional resources or data provided in the Reverse Osmosis Cleaner report?
While the report offers comprehensive insights, it's advisable to review the specific contents or supplementary materials provided to ascertain if additional resources or data are available.
14. How can I stay updated on further developments or reports in the Reverse Osmosis Cleaner?
To stay informed about further developments, trends, and reports in the Reverse Osmosis Cleaner, consider subscribing to industry newsletters, following relevant companies and organizations, or regularly checking reputable industry news sources and publications.
Methodology
Step 1 - Identification of Relevant Samples Size from Population Database


Step 2 - Approaches for Defining Global Market Size (Value, Volume* & Price*)

Note*: In applicable scenarios
Step 3 - Data Sources
Primary Research
- Web Analytics
- Survey Reports
- Research Institute
- Latest Research Reports
- Opinion Leaders
Secondary Research
- Annual Reports
- White Paper
- Latest Press Release
- Industry Association
- Paid Database
- Investor Presentations

Step 4 - Data Triangulation
Involves using different sources of information in order to increase the validity of a study
These sources are likely to be stakeholders in a program - participants, other researchers, program staff, other community members, and so on.
Then we put all data in single framework & apply various statistical tools to find out the dynamic on the market.
During the analysis stage, feedback from the stakeholder groups would be compared to determine areas of agreement as well as areas of divergence

