

Key Insights
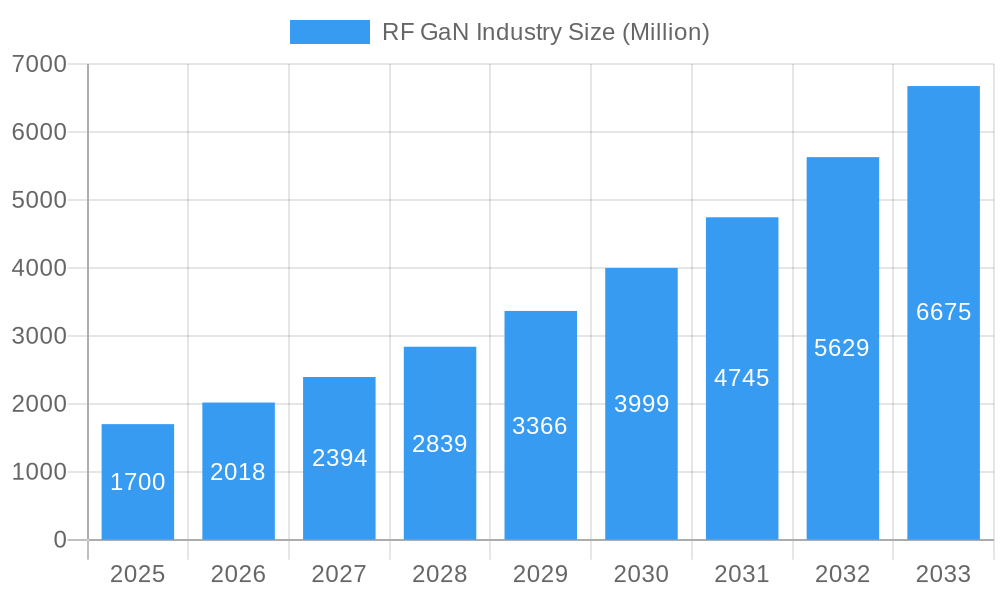
The RF GaN (Gallium Nitride) market is poised for substantial growth, with a current market size estimated at 1.70 Million and projected to expand at a robust Compound Annual Growth Rate (CAGR) of 18.76% through 2033. This rapid expansion is primarily fueled by the increasing demand for high-performance components in critical sectors such as military applications, telecommunications (especially 5G infrastructure), and satellite communication. The superior power efficiency, higher operating frequencies, and increased reliability of GaN-based devices compared to traditional silicon counterparts make them indispensable for next-generation technologies. The widespread adoption of GaN-on-SiC and GaN-on-Si substrates, along with emerging other material types, indicates a continuous drive for innovation and performance enhancement across various applications.
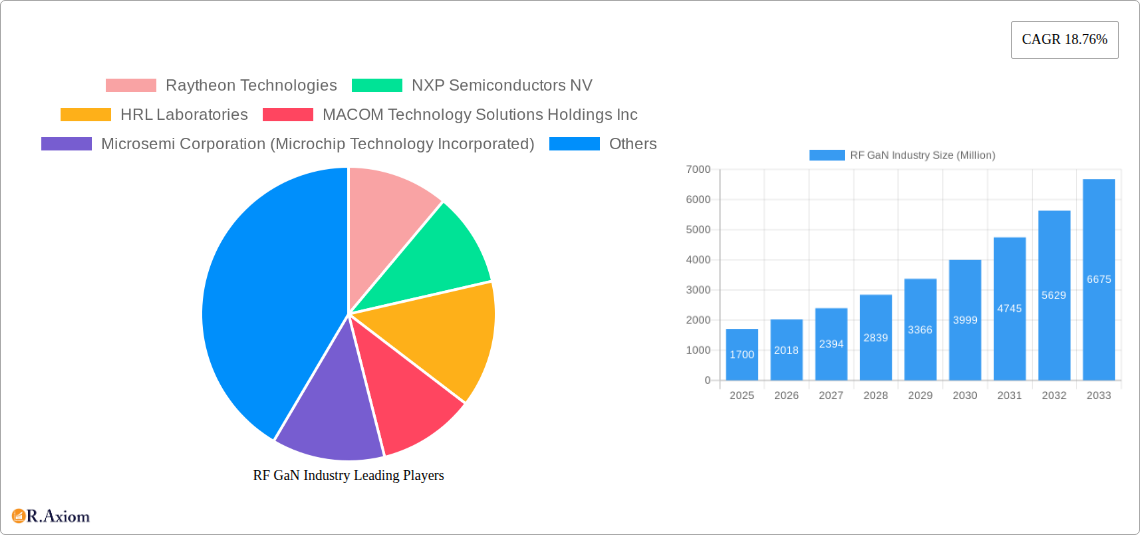
RF GaN Industry Market Size (In Billion)
Key drivers underpinning this market surge include the escalating need for faster data transmission, advanced radar systems for defense and automotive, and the burgeoning satellite internet services. While the market benefits from these strong tailwinds, potential restraints such as the high cost of raw materials and manufacturing complexities need to be carefully managed by industry players. Emerging trends like the integration of GaN in emerging technologies such as RF energy and advanced avionics systems further highlight the expanding scope and potential of this dynamic industry. Geographically, North America and Asia Pacific are expected to lead market growth due to significant investments in defense and telecommunications infrastructure.
RF GaN Industry Company Market Share
This in-depth report provides a detailed analysis of the RF GaN (Gallium Nitride) market, a critical technology powering advanced electronic systems across numerous high-growth sectors. Covering the historical period from 2019-2024 and a forecast period from 2025-2033, with a base year of 2025, this report is essential for stakeholders seeking to understand market dynamics, competitive landscapes, and future opportunities. We delve into intricate details of 5G infrastructure, satellite communication, military electronics, automotive radar, and RF energy applications, examining the pervasive influence of GaN-on-SiC and GaN-on-Si materials. With an estimated market size poised for significant expansion, this report is your definitive guide to navigating the lucrative Gallium Nitride RF devices market.
RF GaN Industry Market Concentration & Innovation
The RF GaN industry exhibits a moderate to high degree of market concentration, driven by the substantial R&D investment required and the specialized manufacturing processes involved. Key innovation drivers include the insatiable demand for higher frequencies, increased power efficiency, and miniaturization in applications such as 5G base stations, advanced radar systems, and satellite communication payloads. Regulatory frameworks, particularly those pertaining to defense and telecommunications, play a crucial role in shaping market access and product development. While direct product substitutes for GaN in high-performance RF applications are limited, advancements in alternative materials or competing semiconductor technologies could present future challenges. End-user trends are strongly leaning towards wireless connectivity expansion, enhanced defense capabilities, and the proliferation of connected devices, all of which directly fuel GaN adoption. Merger and acquisition (M&A) activities are a significant feature, with strategic consolidation aimed at acquiring intellectual property, expanding manufacturing capabilities, and achieving economies of scale. For instance, recent M&A deals in the broader semiconductor space, often involving RF component manufacturers, indicate a strong appetite for acquiring GaN expertise. Expected M&A deal values in the RF GaN sector are projected to reach hundreds of millions of dollars annually, reflecting the strategic importance of this technology. Market share is currently fragmented but is consolidating around key players with robust GaN fabrication capabilities.
RF GaN Industry Industry Trends & Insights
The RF GaN industry is experiencing robust growth, propelled by several transformative trends. A primary growth driver is the global rollout of 5G networks, demanding higher power and efficiency in base stations and user equipment, where GaN transistors excel. This translates into substantial market penetration of GaN in the telecom segment. The escalating defense budgets worldwide and the increasing sophistication of electronic warfare, radar, and communication systems are further accelerating the adoption of RF GaN devices, particularly in military applications. The burgeoning satellite communication market, driven by the demand for global internet coverage and increased data throughput, is another significant contributor to market expansion. Technological disruptions are continuously emerging, with ongoing research and development focused on improving GaN material quality, developing novel device architectures, and enhancing manufacturing yields. Consumer preferences, indirectly, are driving the demand for faster and more reliable wireless communication, pushing the boundaries of RF performance, which GaN is uniquely positioned to meet. The competitive dynamics are intensifying, with established semiconductor giants and specialized GaN manufacturers vying for market share. The compound annual growth rate (CAGR) for the RF GaN market is projected to be in the high single digits to low double digits over the forecast period, reflecting its strategic importance. Market penetration is steadily increasing across all key application segments as performance advantages become more evident and cost barriers diminish.
Dominant Markets & Segments in RF GaN Industry
The Telecommunications segment is currently the dominant market within the RF GaN industry, primarily driven by the massive global deployment of 5G infrastructure. This dominance is fueled by several factors, including:
- Economic Policies: Government initiatives and investments aimed at boosting digital infrastructure and connectivity, particularly in emerging economies, create a strong demand for 5G base stations and associated RF components.
- Infrastructure Requirements: The need for higher data rates, lower latency, and increased capacity in 5G networks necessitates the use of highly efficient and powerful RF transistors, a role where GaN excels over traditional silicon-based technologies.
- Technological Advancements: The evolution of 5G standards, such as the increasing use of millimeter-wave frequencies, further amplifies the advantages of GaN's high-frequency performance and power handling capabilities.
Within the Material Type segmentation, GaN-on-SiC (Silicon Carbide) holds a significant leading position. Its dominance is attributed to:
- Superior Thermal Conductivity: SiC's excellent thermal management properties allow GaN devices to operate at higher power densities and temperatures, crucial for demanding applications like high-power amplifiers in base stations and radar systems.
- High Breakdown Electric Field: This characteristic of GaN-on-SiC enables devices to withstand higher voltages, leading to improved efficiency and reliability in power-intensive applications.
- Established Manufacturing Ecosystem: The supply chain and manufacturing processes for GaN-on-SiC are more mature compared to other GaN substrates, leading to better yields and more competitive pricing.
Geographically, North America and Asia-Pacific are leading regions for RF GaN adoption, driven by significant investments in defense modernization programs in North America and rapid 5G network build-outs and expanding consumer electronics markets in Asia-Pacific. The Military application segment also represents a substantial and consistently growing market, characterized by the demand for advanced electronic warfare systems, radar, and secure communication devices.
RF GaN Industry Product Developments
Recent product developments in the RF GaN industry showcase a clear trend towards higher power, increased efficiency, and tailored solutions for specific applications. Companies are continuously innovating to push the performance envelope, enabling next-generation communication systems, advanced defense platforms, and expanded RF energy applications. The competitive advantage lies in achieving superior linearity, reduced noise figures, and enhanced thermal management in compact form factors, catering to the stringent requirements of modern electronic systems.
Report Scope & Segmentation Analysis
This report segments the RF GaN market across key applications, including Military, Telecom, Satellite Communication, Wired Broadband, Commercial Radar and Avionics, and RF Energy. Each segment is analyzed for its specific growth trajectory, market size projections, and competitive dynamics. In terms of material types, the analysis covers GaN-on-Si, GaN-on-SiC, and Other Material Types (GaN-on-GaN, GaN-on-Diamond), detailing their respective market shares, technological advantages, and anticipated growth rates. The competitive landscape within each segment is examined to provide a holistic understanding of the market's structure and key players' strategies.
Key Drivers of RF GaN Industry Growth
The RF GaN industry's growth is primarily propelled by several interconnected factors. The relentless global expansion of 5G and future wireless communication technologies demands higher power-efficient RF components, a niche where GaN excels. Increasing defense spending worldwide, coupled with the need for advanced radar and electronic warfare capabilities, is a significant driver. The rapid growth in satellite communication services, including broadband internet and Earth observation, also fuels demand for high-performance GaN devices. Furthermore, advancements in RF energy applications, such as industrial heating and medical devices, present a burgeoning market. Regulatory support for advanced technology deployment and ongoing technological innovation in GaN material science and fabrication are also critical growth catalysts.
Challenges in the RF GaN Industry Sector
Despite its promising growth, the RF GaN industry faces several challenges. The high manufacturing costs associated with GaN substrates and fabrication processes can be a barrier to widespread adoption, particularly in cost-sensitive consumer applications. Supply chain constraints for critical raw materials and specialized manufacturing equipment can lead to production delays and price volatility. Intense competitive pressures from established semiconductor players and emerging GaN manufacturers necessitate continuous innovation and cost optimization. Navigating complex and evolving regulatory landscapes, especially in defense and aerospace, can also pose challenges.
Emerging Opportunities in RF GaN Industry
Emerging opportunities in the RF GaN industry are abundant and span across multiple high-growth sectors. The expansion of 6G wireless communication technologies promises to unlock new frontiers for GaN's superior performance characteristics. The increasing adoption of GaN in automotive radar systems for advanced driver-assistance systems (ADAS) and autonomous driving represents a significant growth avenue. The development of solid-state power amplifiers (SSPAs) for various industrial and commercial applications, such as high-power lighting and industrial processing, is another area of significant potential. Furthermore, the miniaturization and enhanced performance capabilities of GaN devices are opening doors for novel applications in areas like medical imaging and scientific instrumentation.
Leading Players in the RF GaN Industry Market
- Raytheon Technologies
- NXP Semiconductors NV
- HRL Laboratories
- MACOM Technology Solutions Holdings Inc
- Microsemi Corporation (Microchip Technology Incorporated)
- Wolfspeed Inc (Cree Inc )
- Integra Technologies Inc
- Mitsubishi Electric Corporation
- STMicroelectronics NV
- Aethercomm Inc
- Mercury Systems Inc
- Qorvo Inc
- Analog Devices Inc
- Sumitomo Electric Device Innovations Inc
Key Developments in RF GaN Industry Industry
- September 2022: MaxLinear Inc. and RFHIC announced a collaboration to deliver a production-ready 400MHz Power Amplifier solution for 5G Macrocell radios, utilizing MaxLinear MaxLIN Digital Predistortion and Crest Factor Reduction technologies to optimize the performance of RFHIC's latest ID-400W series GaN RF Transistors. Combining RFHIC's dual-reverse GaN RF transistor ID41411DR with MaxLIN DPD and making it available as a pre-verified solution would allow Radio Access Network (RAN) product developers to quickly deliver ultra-wideband 400MHz Macro PAs for all global 5G mid-band deployments with high power efficiency and low emissions.
- June 2022: For their line of 100 V RF GaN products, Integra announced the inclusion of seven more devices with power levels up to 5 kW in a single transistor for the avionics, directed energy, electronic warfare, radar, and scientific application areas. These items use Integra's 100 V RF GaN technology, which is designed to give the maximum power and efficiency possible in a single transistor while maintaining stable operating junction temperatures.
Strategic Outlook for RF GaN Industry Market
The strategic outlook for the RF GaN industry market is exceptionally positive, driven by sustained demand across its core application segments and the emergence of new technological frontiers. Continued advancements in 5G, the burgeoning satellite communication sector, and the increasing complexity of defense systems will remain primary growth catalysts. The development of novel GaN materials and fabrication techniques will further enhance device performance and reduce costs, expanding market reach. Strategic partnerships and potential M&A activities will continue to shape the competitive landscape, with a focus on acquiring intellectual property and expanding manufacturing capabilities to meet escalating global demand for high-performance RF solutions. The industry is poised for significant growth and innovation in the coming years.
RF GaN Industry Segmentation
-
1. Application
- 1.1. Military
- 1.2. Telecom
- 1.3. Satellite Communication
- 1.4. Wired Broadband
- 1.5. Commercial Radar and Avionics
- 1.6. RF Energy
-
2. Material Type
- 2.1. GaN-on-Si
- 2.2. GaN-on-SiC
- 2.3. Other Material Types (GaN-on-GaN, GaN-on-Diamond)
RF GaN Industry Segmentation By Geography
- 1. North America
- 2. Europe
- 3. Asia Pacific
- 4. Middle East and Africa
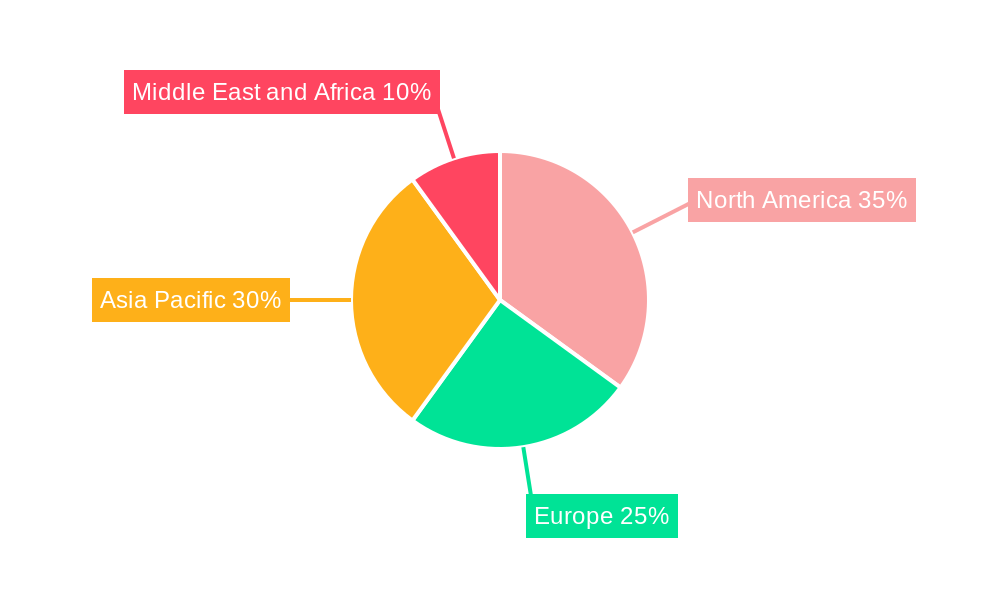
RF GaN Industry Regional Market Share
Geographic Coverage of RF GaN Industry
RF GaN Industry REPORT HIGHLIGHTS
| Aspects | Details |
|---|---|
| Study Period | 2020-2034 |
| Base Year | 2025 |
| Estimated Year | 2026 |
| Forecast Period | 2026-2034 |
| Historical Period | 2020-2025 |
| Growth Rate | CAGR of 18.76% from 2020-2034 |
| Segmentation |
|
Table of Contents
- 1. Introduction
- 1.1. Research Scope
- 1.2. Market Segmentation
- 1.3. Research Objective
- 1.4. Definitions and Assumptions
- 2. Executive Summary
- 2.1. Market Snapshot
- 3. Market Dynamics
- 3.1. Market Drivers
- 3.2. Market Restrains
- 3.3. Market Trends
- 3.4. Market Opportunities
- 4. Market Factor Analysis
- 4.1. Porters Five Forces
- 4.1.1. Bargaining Power of Suppliers
- 4.1.2. Bargaining Power of Buyers
- 4.1.3. Threat of New Entrants
- 4.1.4. Threat of Substitutes
- 4.1.5. Competitive Rivalry
- 4.2. PESTEL analysis
- 4.3. BCG Analysis
- 4.3.1. Stars (High Growth, High Market Share)
- 4.3.2. Cash Cows (Low Growth, High Market Share)
- 4.3.3. Question Mark (High Growth, Low Market Share)
- 4.3.4. Dogs (Low Growth, Low Market Share)
- 4.4. Ansoff Matrix Analysis
- 4.5. Supply Chain Analysis
- 4.6. Regulatory Landscape
- 4.7. Current Market Potential and Opportunity Assessment (TAM–SAM–SOM Framework)
- 4.8. RAX Analyst Note
- 4.1. Porters Five Forces
- 5. Market Analysis, Insights and Forecast 2021-2033
- 5.1. Market Analysis, Insights and Forecast - by Application
- 5.1.1. Military
- 5.1.2. Telecom
- 5.1.3. Satellite Communication
- 5.1.4. Wired Broadband
- 5.1.5. Commercial Radar and Avionics
- 5.1.6. RF Energy
- 5.2. Market Analysis, Insights and Forecast - by Material Type
- 5.2.1. GaN-on-Si
- 5.2.2. GaN-on-SiC
- 5.2.3. Other Material Types (GaN-on-GaN, GaN-on-Diamond)
- 5.3. Market Analysis, Insights and Forecast - by Region
- 5.3.1. North America
- 5.3.2. Europe
- 5.3.3. Asia Pacific
- 5.3.4. Middle East and Africa
- 5.1. Market Analysis, Insights and Forecast - by Application
- 6. Global RF GaN Industry Analysis, Insights and Forecast, 2021-2033
- 6.1. Market Analysis, Insights and Forecast - by Application
- 6.1.1. Military
- 6.1.2. Telecom
- 6.1.3. Satellite Communication
- 6.1.4. Wired Broadband
- 6.1.5. Commercial Radar and Avionics
- 6.1.6. RF Energy
- 6.2. Market Analysis, Insights and Forecast - by Material Type
- 6.2.1. GaN-on-Si
- 6.2.2. GaN-on-SiC
- 6.2.3. Other Material Types (GaN-on-GaN, GaN-on-Diamond)
- 6.1. Market Analysis, Insights and Forecast - by Application
- 7. North America RF GaN Industry Analysis, Insights and Forecast, 2020-2032
- 7.1. Market Analysis, Insights and Forecast - by Application
- 7.1.1. Military
- 7.1.2. Telecom
- 7.1.3. Satellite Communication
- 7.1.4. Wired Broadband
- 7.1.5. Commercial Radar and Avionics
- 7.1.6. RF Energy
- 7.2. Market Analysis, Insights and Forecast - by Material Type
- 7.2.1. GaN-on-Si
- 7.2.2. GaN-on-SiC
- 7.2.3. Other Material Types (GaN-on-GaN, GaN-on-Diamond)
- 7.1. Market Analysis, Insights and Forecast - by Application
- 8. Europe RF GaN Industry Analysis, Insights and Forecast, 2020-2032
- 8.1. Market Analysis, Insights and Forecast - by Application
- 8.1.1. Military
- 8.1.2. Telecom
- 8.1.3. Satellite Communication
- 8.1.4. Wired Broadband
- 8.1.5. Commercial Radar and Avionics
- 8.1.6. RF Energy
- 8.2. Market Analysis, Insights and Forecast - by Material Type
- 8.2.1. GaN-on-Si
- 8.2.2. GaN-on-SiC
- 8.2.3. Other Material Types (GaN-on-GaN, GaN-on-Diamond)
- 8.1. Market Analysis, Insights and Forecast - by Application
- 9. Asia Pacific RF GaN Industry Analysis, Insights and Forecast, 2020-2032
- 9.1. Market Analysis, Insights and Forecast - by Application
- 9.1.1. Military
- 9.1.2. Telecom
- 9.1.3. Satellite Communication
- 9.1.4. Wired Broadband
- 9.1.5. Commercial Radar and Avionics
- 9.1.6. RF Energy
- 9.2. Market Analysis, Insights and Forecast - by Material Type
- 9.2.1. GaN-on-Si
- 9.2.2. GaN-on-SiC
- 9.2.3. Other Material Types (GaN-on-GaN, GaN-on-Diamond)
- 9.1. Market Analysis, Insights and Forecast - by Application
- 10. Middle East and Africa RF GaN Industry Analysis, Insights and Forecast, 2020-2032
- 10.1. Market Analysis, Insights and Forecast - by Application
- 10.1.1. Military
- 10.1.2. Telecom
- 10.1.3. Satellite Communication
- 10.1.4. Wired Broadband
- 10.1.5. Commercial Radar and Avionics
- 10.1.6. RF Energy
- 10.2. Market Analysis, Insights and Forecast - by Material Type
- 10.2.1. GaN-on-Si
- 10.2.2. GaN-on-SiC
- 10.2.3. Other Material Types (GaN-on-GaN, GaN-on-Diamond)
- 10.1. Market Analysis, Insights and Forecast - by Application
- 11. Competitive Analysis
- 11.1. Company Profiles
- 11.1.1 Raytheon Technologies
- 11.1.1.1. Company Overview
- 11.1.1.2. Products
- 11.1.1.3. Company Financials
- 11.1.1.4. SWOT Analysis
- 11.1.2 NXP Semiconductors NV
- 11.1.2.1. Company Overview
- 11.1.2.2. Products
- 11.1.2.3. Company Financials
- 11.1.2.4. SWOT Analysis
- 11.1.3 HRL Laboratories
- 11.1.3.1. Company Overview
- 11.1.3.2. Products
- 11.1.3.3. Company Financials
- 11.1.3.4. SWOT Analysis
- 11.1.4 MACOM Technology Solutions Holdings Inc
- 11.1.4.1. Company Overview
- 11.1.4.2. Products
- 11.1.4.3. Company Financials
- 11.1.4.4. SWOT Analysis
- 11.1.5 Microsemi Corporation (Microchip Technology Incorporated)
- 11.1.5.1. Company Overview
- 11.1.5.2. Products
- 11.1.5.3. Company Financials
- 11.1.5.4. SWOT Analysis
- 11.1.6 Wolfspeed Inc (Cree Inc )
- 11.1.6.1. Company Overview
- 11.1.6.2. Products
- 11.1.6.3. Company Financials
- 11.1.6.4. SWOT Analysis
- 11.1.7 Integra Technologies Inc
- 11.1.7.1. Company Overview
- 11.1.7.2. Products
- 11.1.7.3. Company Financials
- 11.1.7.4. SWOT Analysis
- 11.1.8 Mitsubishi Electric Corporation
- 11.1.8.1. Company Overview
- 11.1.8.2. Products
- 11.1.8.3. Company Financials
- 11.1.8.4. SWOT Analysis
- 11.1.9 STMicroelectronics NV
- 11.1.9.1. Company Overview
- 11.1.9.2. Products
- 11.1.9.3. Company Financials
- 11.1.9.4. SWOT Analysis
- 11.1.10 Aethercomm Inc
- 11.1.10.1. Company Overview
- 11.1.10.2. Products
- 11.1.10.3. Company Financials
- 11.1.10.4. SWOT Analysis
- 11.1.11 Mercury Systems Inc
- 11.1.11.1. Company Overview
- 11.1.11.2. Products
- 11.1.11.3. Company Financials
- 11.1.11.4. SWOT Analysis
- 11.1.12 Qorvo Inc
- 11.1.12.1. Company Overview
- 11.1.12.2. Products
- 11.1.12.3. Company Financials
- 11.1.12.4. SWOT Analysis
- 11.1.13 Analog Devices Inc
- 11.1.13.1. Company Overview
- 11.1.13.2. Products
- 11.1.13.3. Company Financials
- 11.1.13.4. SWOT Analysis
- 11.1.14 Sumitomo Electric Device Innovations Inc
- 11.1.14.1. Company Overview
- 11.1.14.2. Products
- 11.1.14.3. Company Financials
- 11.1.14.4. SWOT Analysis
- 11.1.1 Raytheon Technologies
- 11.2. Market Entropy
- 11.2.1 Company's Key Areas Served
- 11.2.2 Recent Developments
- 11.3. Company Market Share Analysis 2025
- 11.3.1 Top 5 Companies Market Share Analysis
- 11.3.2 Top 3 Companies Market Share Analysis
- 11.4. List of Potential Customers
- 12. Research Methodology
List of Figures
- Figure 1: Global RF GaN Industry Revenue Breakdown (Million, %) by Region 2025 & 2033
- Figure 2: Global RF GaN Industry Volume Breakdown (K Unit, %) by Region 2025 & 2033
- Figure 3: North America RF GaN Industry Revenue (Million), by Application 2025 & 2033
- Figure 4: North America RF GaN Industry Volume (K Unit), by Application 2025 & 2033
- Figure 5: North America RF GaN Industry Revenue Share (%), by Application 2025 & 2033
- Figure 6: North America RF GaN Industry Volume Share (%), by Application 2025 & 2033
- Figure 7: North America RF GaN Industry Revenue (Million), by Material Type 2025 & 2033
- Figure 8: North America RF GaN Industry Volume (K Unit), by Material Type 2025 & 2033
- Figure 9: North America RF GaN Industry Revenue Share (%), by Material Type 2025 & 2033
- Figure 10: North America RF GaN Industry Volume Share (%), by Material Type 2025 & 2033
- Figure 11: North America RF GaN Industry Revenue (Million), by Country 2025 & 2033
- Figure 12: North America RF GaN Industry Volume (K Unit), by Country 2025 & 2033
- Figure 13: North America RF GaN Industry Revenue Share (%), by Country 2025 & 2033
- Figure 14: North America RF GaN Industry Volume Share (%), by Country 2025 & 2033
- Figure 15: Europe RF GaN Industry Revenue (Million), by Application 2025 & 2033
- Figure 16: Europe RF GaN Industry Volume (K Unit), by Application 2025 & 2033
- Figure 17: Europe RF GaN Industry Revenue Share (%), by Application 2025 & 2033
- Figure 18: Europe RF GaN Industry Volume Share (%), by Application 2025 & 2033
- Figure 19: Europe RF GaN Industry Revenue (Million), by Material Type 2025 & 2033
- Figure 20: Europe RF GaN Industry Volume (K Unit), by Material Type 2025 & 2033
- Figure 21: Europe RF GaN Industry Revenue Share (%), by Material Type 2025 & 2033
- Figure 22: Europe RF GaN Industry Volume Share (%), by Material Type 2025 & 2033
- Figure 23: Europe RF GaN Industry Revenue (Million), by Country 2025 & 2033
- Figure 24: Europe RF GaN Industry Volume (K Unit), by Country 2025 & 2033
- Figure 25: Europe RF GaN Industry Revenue Share (%), by Country 2025 & 2033
- Figure 26: Europe RF GaN Industry Volume Share (%), by Country 2025 & 2033
- Figure 27: Asia Pacific RF GaN Industry Revenue (Million), by Application 2025 & 2033
- Figure 28: Asia Pacific RF GaN Industry Volume (K Unit), by Application 2025 & 2033
- Figure 29: Asia Pacific RF GaN Industry Revenue Share (%), by Application 2025 & 2033
- Figure 30: Asia Pacific RF GaN Industry Volume Share (%), by Application 2025 & 2033
- Figure 31: Asia Pacific RF GaN Industry Revenue (Million), by Material Type 2025 & 2033
- Figure 32: Asia Pacific RF GaN Industry Volume (K Unit), by Material Type 2025 & 2033
- Figure 33: Asia Pacific RF GaN Industry Revenue Share (%), by Material Type 2025 & 2033
- Figure 34: Asia Pacific RF GaN Industry Volume Share (%), by Material Type 2025 & 2033
- Figure 35: Asia Pacific RF GaN Industry Revenue (Million), by Country 2025 & 2033
- Figure 36: Asia Pacific RF GaN Industry Volume (K Unit), by Country 2025 & 2033
- Figure 37: Asia Pacific RF GaN Industry Revenue Share (%), by Country 2025 & 2033
- Figure 38: Asia Pacific RF GaN Industry Volume Share (%), by Country 2025 & 2033
- Figure 39: Middle East and Africa RF GaN Industry Revenue (Million), by Application 2025 & 2033
- Figure 40: Middle East and Africa RF GaN Industry Volume (K Unit), by Application 2025 & 2033
- Figure 41: Middle East and Africa RF GaN Industry Revenue Share (%), by Application 2025 & 2033
- Figure 42: Middle East and Africa RF GaN Industry Volume Share (%), by Application 2025 & 2033
- Figure 43: Middle East and Africa RF GaN Industry Revenue (Million), by Material Type 2025 & 2033
- Figure 44: Middle East and Africa RF GaN Industry Volume (K Unit), by Material Type 2025 & 2033
- Figure 45: Middle East and Africa RF GaN Industry Revenue Share (%), by Material Type 2025 & 2033
- Figure 46: Middle East and Africa RF GaN Industry Volume Share (%), by Material Type 2025 & 2033
- Figure 47: Middle East and Africa RF GaN Industry Revenue (Million), by Country 2025 & 2033
- Figure 48: Middle East and Africa RF GaN Industry Volume (K Unit), by Country 2025 & 2033
- Figure 49: Middle East and Africa RF GaN Industry Revenue Share (%), by Country 2025 & 2033
- Figure 50: Middle East and Africa RF GaN Industry Volume Share (%), by Country 2025 & 2033
List of Tables
- Table 1: Global RF GaN Industry Revenue Million Forecast, by Application 2020 & 2033
- Table 2: Global RF GaN Industry Volume K Unit Forecast, by Application 2020 & 2033
- Table 3: Global RF GaN Industry Revenue Million Forecast, by Material Type 2020 & 2033
- Table 4: Global RF GaN Industry Volume K Unit Forecast, by Material Type 2020 & 2033
- Table 5: Global RF GaN Industry Revenue Million Forecast, by Region 2020 & 2033
- Table 6: Global RF GaN Industry Volume K Unit Forecast, by Region 2020 & 2033
- Table 7: Global RF GaN Industry Revenue Million Forecast, by Application 2020 & 2033
- Table 8: Global RF GaN Industry Volume K Unit Forecast, by Application 2020 & 2033
- Table 9: Global RF GaN Industry Revenue Million Forecast, by Material Type 2020 & 2033
- Table 10: Global RF GaN Industry Volume K Unit Forecast, by Material Type 2020 & 2033
- Table 11: Global RF GaN Industry Revenue Million Forecast, by Country 2020 & 2033
- Table 12: Global RF GaN Industry Volume K Unit Forecast, by Country 2020 & 2033
- Table 13: Global RF GaN Industry Revenue Million Forecast, by Application 2020 & 2033
- Table 14: Global RF GaN Industry Volume K Unit Forecast, by Application 2020 & 2033
- Table 15: Global RF GaN Industry Revenue Million Forecast, by Material Type 2020 & 2033
- Table 16: Global RF GaN Industry Volume K Unit Forecast, by Material Type 2020 & 2033
- Table 17: Global RF GaN Industry Revenue Million Forecast, by Country 2020 & 2033
- Table 18: Global RF GaN Industry Volume K Unit Forecast, by Country 2020 & 2033
- Table 19: Global RF GaN Industry Revenue Million Forecast, by Application 2020 & 2033
- Table 20: Global RF GaN Industry Volume K Unit Forecast, by Application 2020 & 2033
- Table 21: Global RF GaN Industry Revenue Million Forecast, by Material Type 2020 & 2033
- Table 22: Global RF GaN Industry Volume K Unit Forecast, by Material Type 2020 & 2033
- Table 23: Global RF GaN Industry Revenue Million Forecast, by Country 2020 & 2033
- Table 24: Global RF GaN Industry Volume K Unit Forecast, by Country 2020 & 2033
- Table 25: Global RF GaN Industry Revenue Million Forecast, by Application 2020 & 2033
- Table 26: Global RF GaN Industry Volume K Unit Forecast, by Application 2020 & 2033
- Table 27: Global RF GaN Industry Revenue Million Forecast, by Material Type 2020 & 2033
- Table 28: Global RF GaN Industry Volume K Unit Forecast, by Material Type 2020 & 2033
- Table 29: Global RF GaN Industry Revenue Million Forecast, by Country 2020 & 2033
- Table 30: Global RF GaN Industry Volume K Unit Forecast, by Country 2020 & 2033
Frequently Asked Questions
1. What is the projected Compound Annual Growth Rate (CAGR) of the RF GaN Industry?
The projected CAGR is approximately 18.76%.
2. Which companies are prominent players in the RF GaN Industry?
Key companies in the market include Raytheon Technologies, NXP Semiconductors NV, HRL Laboratories, MACOM Technology Solutions Holdings Inc, Microsemi Corporation (Microchip Technology Incorporated), Wolfspeed Inc (Cree Inc ), Integra Technologies Inc, Mitsubishi Electric Corporation, STMicroelectronics NV, Aethercomm Inc, Mercury Systems Inc, Qorvo Inc, Analog Devices Inc, Sumitomo Electric Device Innovations Inc.
3. What are the main segments of the RF GaN Industry?
The market segments include Application, Material Type.
4. Can you provide details about the market size?
The market size is estimated to be USD 1.70 Million as of 2022.
5. What are some drivers contributing to market growth?
Strong Demand from Telecom Infrastructure Segment Driven by Advancements in 5G Implementation; Favorable Attributes Such As High-performance and Small Form Factor to.
6. What are the notable trends driving market growth?
Strong Demand from Telecom Infrastructure Segment Driven by Advancements in 5G Implementation.
7. Are there any restraints impacting market growth?
Cost & Operational Challenges.
8. Can you provide examples of recent developments in the market?
September 2022: MaxLinear Inc. and RFHIC announced a collaboration to deliver a production-ready 400MHz Power Amplifier solution for 5G Macrocell radios, utilizing MaxLinear MaxLIN Digital Predistortion and Crest Factor Reduction technologies to optimize the performance of RFHIC's latest ID-400W series GaN RF Transistors. Combining RFHIC's dual-reverse GaN RF transistor ID41411DR with MaxLIN DPD and making it available as a pre-verified solution would allow Radio Access Network (RAN) product developers to quickly deliver ultra-wideband 400MHz Macro PAs for all global 5G mid-band deployments with high power efficiency and low emissions.
9. What pricing options are available for accessing the report?
Pricing options include single-user, multi-user, and enterprise licenses priced at USD 4750, USD 5250, and USD 8750 respectively.
10. Is the market size provided in terms of value or volume?
The market size is provided in terms of value, measured in Million and volume, measured in K Unit.
11. Are there any specific market keywords associated with the report?
Yes, the market keyword associated with the report is "RF GaN Industry," which aids in identifying and referencing the specific market segment covered.
12. How do I determine which pricing option suits my needs best?
The pricing options vary based on user requirements and access needs. Individual users may opt for single-user licenses, while businesses requiring broader access may choose multi-user or enterprise licenses for cost-effective access to the report.
13. Are there any additional resources or data provided in the RF GaN Industry report?
While the report offers comprehensive insights, it's advisable to review the specific contents or supplementary materials provided to ascertain if additional resources or data are available.
14. How can I stay updated on further developments or reports in the RF GaN Industry?
To stay informed about further developments, trends, and reports in the RF GaN Industry, consider subscribing to industry newsletters, following relevant companies and organizations, or regularly checking reputable industry news sources and publications.
Methodology
Step 1 - Identification of Relevant Samples Size from Population Database


Step 2 - Approaches for Defining Global Market Size (Value, Volume* & Price*)

Note*: In applicable scenarios
Step 3 - Data Sources
Primary Research
- Web Analytics
- Survey Reports
- Research Institute
- Latest Research Reports
- Opinion Leaders
Secondary Research
- Annual Reports
- White Paper
- Latest Press Release
- Industry Association
- Paid Database
- Investor Presentations

Step 4 - Data Triangulation
Involves using different sources of information in order to increase the validity of a study
These sources are likely to be stakeholders in a program - participants, other researchers, program staff, other community members, and so on.
Then we put all data in single framework & apply various statistical tools to find out the dynamic on the market.
During the analysis stage, feedback from the stakeholder groups would be compared to determine areas of agreement as well as areas of divergence