

Key Insights
The RF Power Semiconductor market is experiencing robust growth, projected to reach a substantial size driven by the expanding adoption of 5G technology, advancements in satellite communication, and the increasing demand for electric vehicles. The market's Compound Annual Growth Rate (CAGR) of 13.25% from 2019 to 2024 indicates significant momentum. This growth is fueled by several key factors. The proliferation of 5G infrastructure globally necessitates high-power, efficient RF semiconductors for base stations and mobile devices. Similarly, the burgeoning satellite communication sector, with its focus on high-throughput and low-latency applications, demands advanced RF power solutions. Furthermore, the automotive industry's shift towards electric and autonomous vehicles is creating a significant demand for RF power semiconductors in applications such as radar systems and vehicle-to-everything (V2X) communication. GaN and GaAs technologies are emerging as dominant players, offering superior performance compared to LDMOS in terms of efficiency and power density, thereby driving market segmentation. While regulatory compliance and material costs pose some challenges, the overall market outlook remains exceptionally positive, promising continued expansion throughout the forecast period (2025-2033).
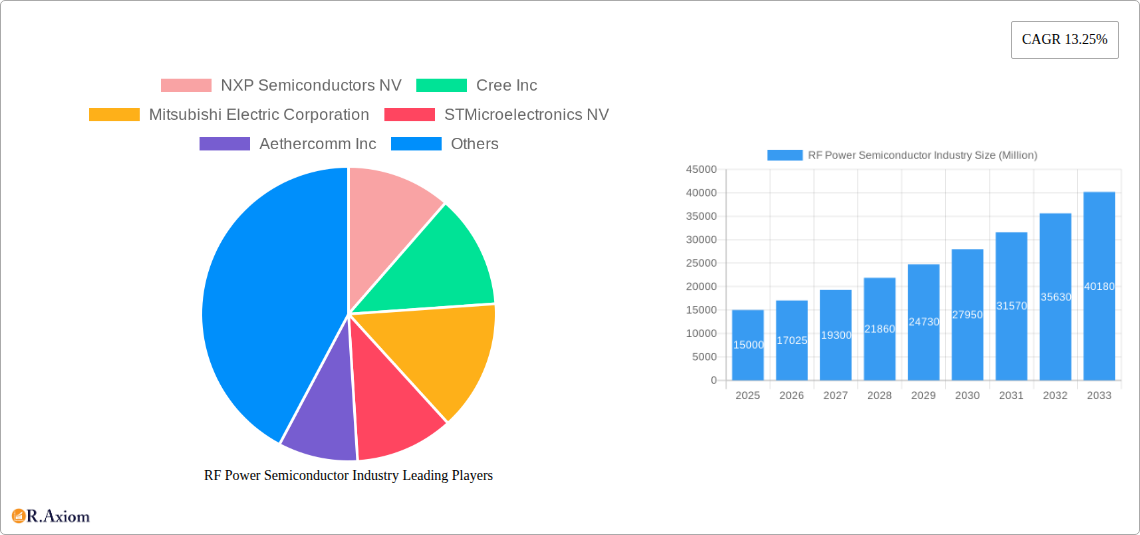
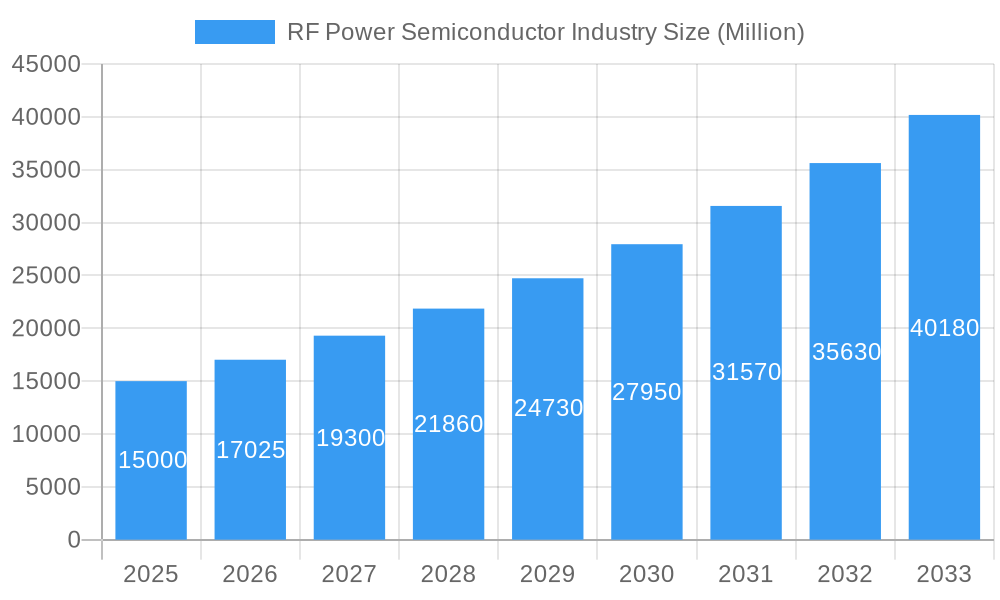
RF Power Semiconductor Industry Market Size (In Billion)
The geographic distribution of the RF Power Semiconductor market reflects the concentration of technological advancements and infrastructure development. North America and Asia Pacific currently hold significant market shares, driven by strong presence of major players and substantial investments in telecom and automotive sectors. Europe also contributes substantially, particularly in the defense and aerospace segment. However, emerging economies in Asia Pacific and South America present lucrative growth opportunities, fueled by increasing infrastructure spending and rising disposable income. Market segmentation by application reveals telecom infrastructure as a dominant segment, followed by aerospace and defense, further emphasizing the key drivers identified above. The competitive landscape is characterized by a mix of established players like NXP, Infineon, and Qorvo, along with emerging companies specializing in niche applications and technologies. Strategic partnerships, mergers, and acquisitions are expected to shape the competitive dynamics in the coming years.
RF Power Semiconductor Industry Company Market Share
RF Power Semiconductor Industry: A Comprehensive Market Analysis (2019-2033)
This comprehensive report provides a detailed analysis of the RF Power Semiconductor industry, covering market size, segmentation, growth drivers, challenges, and key players. The report utilizes data from the historical period (2019-2024), the base year (2025), and forecasts the market's trajectory through the forecast period (2025-2033). The study period encompasses 2019-2033. This in-depth analysis is crucial for industry stakeholders, investors, and businesses seeking to understand the current landscape and future prospects of this dynamic sector. The total market size in 2025 is estimated at $XX Million.
RF Power Semiconductor Industry Market Concentration & Innovation
The RF Power Semiconductor market exhibits a moderately concentrated landscape, with a few major players holding significant market share. In 2025, the top five companies – NXP Semiconductors NV, STMicroelectronics NV, Qorvo Inc, Infineon Technologies AG, and Analog Devices Inc – are projected to collectively account for approximately 60% of the global market. However, the industry also witnesses considerable innovation, driven by the demand for higher efficiency, improved performance, and miniaturization in various applications.
- Market Share: NXP Semiconductors NV (15%), STMicroelectronics NV (12%), Qorvo Inc (10%), Infineon Technologies AG (10%), Analog Devices Inc (8%), Others (45%). These figures are estimates for 2025.
- Innovation Drivers: Advancements in GaN and SiC technologies, increased demand for 5G infrastructure, and the proliferation of IoT devices are key innovation drivers.
- Regulatory Frameworks: Stringent regulatory compliance requirements related to energy efficiency and electromagnetic interference (EMI) influence industry practices.
- Product Substitutes: While few direct substitutes exist, alternative technologies like optical communication are indirectly impacting market growth in specific niche segments.
- End-User Trends: The growing adoption of 5G, the expansion of satellite communication networks, and the rise of electric vehicles are shaping end-user demand.
- M&A Activities: The industry has witnessed several mergers and acquisitions in recent years, with deal values exceeding $XX Million annually, reflecting the strategic importance of consolidating market share and acquiring innovative technologies.
RF Power Semiconductor Industry Industry Trends & Insights
The RF Power Semiconductor market is experiencing robust growth, driven by the increasing demand for higher data rates, improved energy efficiency, and miniaturization across diverse applications. The market is projected to exhibit a Compound Annual Growth Rate (CAGR) of xx% during the forecast period (2025-2033). This growth is fueled by several key trends:
- Technological Disruptions: The adoption of GaN and SiC technologies is revolutionizing the industry, offering significant improvements in power density and efficiency compared to traditional LDMOS technology.
- Market Growth Drivers: The proliferation of 5G networks, the expansion of satellite communication systems, and the growing demand for high-power applications in the automotive and aerospace & defense sectors are major growth catalysts.
- Consumer Preferences: End-users increasingly demand devices with enhanced performance, longer battery life, and improved reliability, driving the adoption of more efficient RF power semiconductors.
- Competitive Dynamics: The industry is highly competitive, with both established players and emerging companies vying for market share through continuous innovation and strategic partnerships. Market penetration for GaN technology is projected to reach xx% by 2033.
Dominant Markets & Segments in RF Power Semiconductor Industry
The Telecom Infrastructure segment is the dominant application segment, accounting for approximately 40% of the total market revenue in 2025. The Asia-Pacific region is expected to be the leading geographic market, driven by significant investments in 5G infrastructure and the rapid expansion of the electronics industry. Within technologies, GaN is showing the fastest growth rate, projected to capture xx% market share by 2033.
- Key Drivers for Telecom Infrastructure Dominance:
- Massive investment in 5G infrastructure globally.
- Growing demand for high-speed data transmission.
- Increasing adoption of cloud-based services.
- Key Drivers for Asia-Pacific Regional Dominance:
- Rapid growth of the electronics manufacturing industry.
- Significant investments in telecommunication infrastructure.
- Growing adoption of smartphones and other connected devices.
- Technology Segment Analysis: GaN is experiencing rapid adoption due to its superior efficiency and power density, while LDMOS remains dominant in mature applications. GaAs holds a niche market share.
RF Power Semiconductor Industry Product Developments
Recent product developments focus on enhancing power efficiency, integrating multiple functionalities, and reducing size and cost. The market is witnessing the emergence of highly integrated RF power modules that incorporate multiple components, simplifying design and reducing complexity for end-users. This trend is further driven by the increasing demand for miniaturized and energy-efficient solutions in portable devices and wearable electronics. The development of wide bandgap materials like GaN and SiC is significantly improving power density and efficiency in high-frequency applications.
Report Scope & Segmentation Analysis
This report segments the RF Power Semiconductor market by technology (LDMOS, GaAs, GaN) and by application (Telecom Infrastructure, Aerospace and Defense, Wired Broadband, Satellite Communication, RF Energy (Automotive), Other Applications). Each segment is analyzed based on its market size, growth rate, and competitive landscape. The report provides detailed market size projections for each segment throughout the forecast period (2025-2033). Growth projections vary by segment, with GaN and the Telecom Infrastructure segments exhibiting the fastest expansion. The competitive dynamics within each segment are also analyzed, highlighting key players and their market positions.
Key Drivers of RF Power Semiconductor Industry Growth
Several factors are driving growth in the RF Power Semiconductor industry. The ongoing rollout of 5G networks globally is a significant catalyst, requiring high-performance RF components. The increasing demand for high-speed data transmission and wireless connectivity is also fueling market expansion. Government investments in infrastructure projects, particularly in developing economies, further accelerate industry growth. Finally, advancements in semiconductor technology, such as GaN and SiC, offer significant improvements in efficiency and power density, creating further demand.
Challenges in the RF Power Semiconductor Industry Sector
The RF Power Semiconductor industry faces several challenges, including stringent regulatory compliance requirements, a complex supply chain, and intense competition. Supply chain disruptions can lead to significant cost increases and delays in product delivery. The increasing complexity of RF systems and the need for high precision in manufacturing processes can pose significant technological hurdles. The intense competition among established players and emerging companies requires continuous innovation and cost optimization.
Emerging Opportunities in RF Power Semiconductor Industry
Emerging opportunities abound in the RF Power Semiconductor industry, driven by several factors. The growth of IoT devices, the expansion of autonomous vehicles, and advancements in renewable energy technologies present significant new market segments. The adoption of GaN and SiC technologies offers exciting opportunities to develop high-efficiency and high-power density solutions. Further research and development in wide-bandgap materials could unlock even greater potential in the coming years.
Leading Players in the RF Power Semiconductor Industry Market
Key Developments in RF Power Semiconductor Industry Industry
- Q4 2022: Qorvo Inc announced a new line of GaN-based RF power amplifiers for 5G infrastructure applications.
- Q1 2023: STMicroelectronics NV partnered with a leading telecom equipment manufacturer to develop a new generation of high-power RF modules.
- Q2 2023: NXP Semiconductors NV launched a new series of LDMOS transistors optimized for automotive radar applications.
- Q3 2023: Analog Devices acquired a smaller RF semiconductor company specializing in millimeter-wave technology, expanding their portfolio.
- (Further key developments will be included in the full report)
Strategic Outlook for RF Power Semiconductor Industry Market
The RF Power Semiconductor market is poised for continued strong growth, driven by ongoing technological advancements, increased demand from various sectors, and supportive government policies. The adoption of wide bandgap semiconductors, particularly GaN and SiC, will reshape the industry's competitive landscape. Companies with strong research and development capabilities and the ability to adapt to evolving market demands will be best positioned for success. The market's potential for expansion into emerging applications like renewable energy and autonomous vehicles promises exciting opportunities for innovation and growth in the years to come.
RF Power Semiconductor Industry Segmentation
-
1. Technology
- 1.1. LDMOS
- 1.2. GaAs
- 1.3. GaN
-
2. Application
- 2.1. Telecom Infrastructure
- 2.2. Aerospace and Defense
- 2.3. Wired Broadband
- 2.4. Satellite Communication
- 2.5. RF Energy (Automotive)
- 2.6. Other Applications
RF Power Semiconductor Industry Segmentation By Geography
-
1. North America
- 1.1. United States
- 1.2. Canada
-
2. Europe
- 2.1. United Kingdom
- 2.2. Germany
- 2.3. France
- 2.4. Rest of Europe
-
3. Asia Pacific
- 3.1. China
- 3.2. India
- 3.3. South Korea
- 3.4. Japan
- 3.5. Rest of Asia Pacific
-
4. Rest of the World
- 4.1. Latin America
- 4.2. Middle East
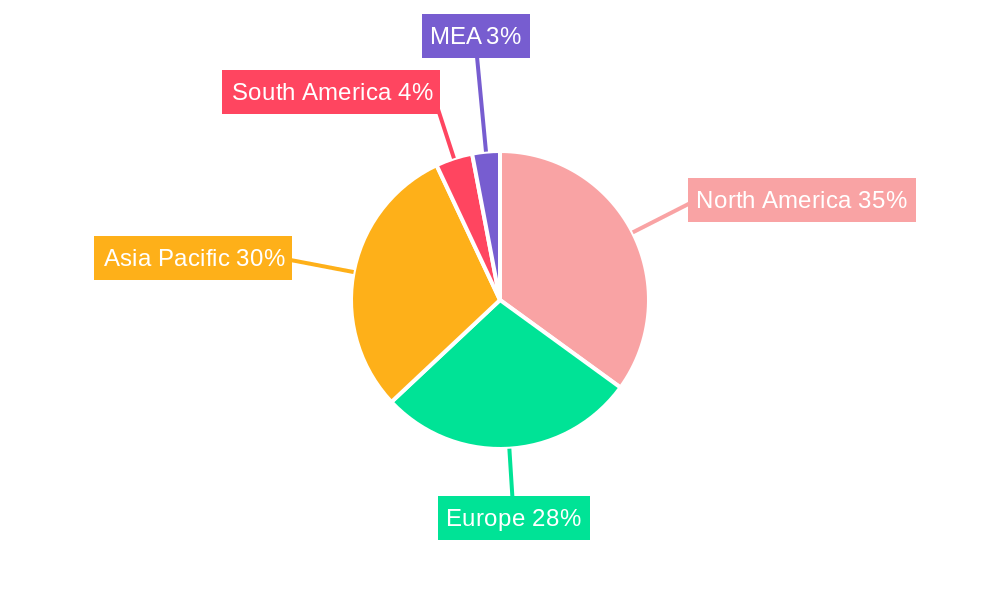
RF Power Semiconductor Industry Regional Market Share
Geographic Coverage of RF Power Semiconductor Industry
RF Power Semiconductor Industry REPORT HIGHLIGHTS
| Aspects | Details |
|---|---|
| Study Period | 2020-2034 |
| Base Year | 2025 |
| Estimated Year | 2026 |
| Forecast Period | 2026-2034 |
| Historical Period | 2020-2025 |
| Growth Rate | CAGR of 15.56% from 2020-2034 |
| Segmentation |
|
Table of Contents
- 1. Introduction
- 1.1. Research Scope
- 1.2. Market Segmentation
- 1.3. Research Objective
- 1.4. Definitions and Assumptions
- 2. Executive Summary
- 2.1. Market Snapshot
- 3. Market Dynamics
- 3.1. Market Drivers
- 3.2. Market Restrains
- 3.3. Market Trends
- 3.4. Market Opportunities
- 4. Market Factor Analysis
- 4.1. Porters Five Forces
- 4.1.1. Bargaining Power of Suppliers
- 4.1.2. Bargaining Power of Buyers
- 4.1.3. Threat of New Entrants
- 4.1.4. Threat of Substitutes
- 4.1.5. Competitive Rivalry
- 4.2. PESTEL analysis
- 4.3. BCG Analysis
- 4.3.1. Stars (High Growth, High Market Share)
- 4.3.2. Cash Cows (Low Growth, High Market Share)
- 4.3.3. Question Mark (High Growth, Low Market Share)
- 4.3.4. Dogs (Low Growth, Low Market Share)
- 4.4. Ansoff Matrix Analysis
- 4.5. Supply Chain Analysis
- 4.6. Regulatory Landscape
- 4.7. Current Market Potential and Opportunity Assessment (TAM–SAM–SOM Framework)
- 4.8. RAX Analyst Note
- 4.1. Porters Five Forces
- 5. Market Analysis, Insights and Forecast 2021-2033
- 5.1. Market Analysis, Insights and Forecast - by Technology
- 5.1.1. LDMOS
- 5.1.2. GaAs
- 5.1.3. GaN
- 5.2. Market Analysis, Insights and Forecast - by Application
- 5.2.1. Telecom Infrastructure
- 5.2.2. Aerospace and Defense
- 5.2.3. Wired Broadband
- 5.2.4. Satellite Communication
- 5.2.5. RF Energy (Automotive)
- 5.2.6. Other Applications
- 5.3. Market Analysis, Insights and Forecast - by Region
- 5.3.1. North America
- 5.3.2. Europe
- 5.3.3. Asia Pacific
- 5.3.4. Rest of the World
- 5.1. Market Analysis, Insights and Forecast - by Technology
- 6. Global RF Power Semiconductor Industry Analysis, Insights and Forecast, 2021-2033
- 6.1. Market Analysis, Insights and Forecast - by Technology
- 6.1.1. LDMOS
- 6.1.2. GaAs
- 6.1.3. GaN
- 6.2. Market Analysis, Insights and Forecast - by Application
- 6.2.1. Telecom Infrastructure
- 6.2.2. Aerospace and Defense
- 6.2.3. Wired Broadband
- 6.2.4. Satellite Communication
- 6.2.5. RF Energy (Automotive)
- 6.2.6. Other Applications
- 6.1. Market Analysis, Insights and Forecast - by Technology
- 7. North America RF Power Semiconductor Industry Analysis, Insights and Forecast, 2020-2032
- 7.1. Market Analysis, Insights and Forecast - by Technology
- 7.1.1. LDMOS
- 7.1.2. GaAs
- 7.1.3. GaN
- 7.2. Market Analysis, Insights and Forecast - by Application
- 7.2.1. Telecom Infrastructure
- 7.2.2. Aerospace and Defense
- 7.2.3. Wired Broadband
- 7.2.4. Satellite Communication
- 7.2.5. RF Energy (Automotive)
- 7.2.6. Other Applications
- 7.1. Market Analysis, Insights and Forecast - by Technology
- 8. Europe RF Power Semiconductor Industry Analysis, Insights and Forecast, 2020-2032
- 8.1. Market Analysis, Insights and Forecast - by Technology
- 8.1.1. LDMOS
- 8.1.2. GaAs
- 8.1.3. GaN
- 8.2. Market Analysis, Insights and Forecast - by Application
- 8.2.1. Telecom Infrastructure
- 8.2.2. Aerospace and Defense
- 8.2.3. Wired Broadband
- 8.2.4. Satellite Communication
- 8.2.5. RF Energy (Automotive)
- 8.2.6. Other Applications
- 8.1. Market Analysis, Insights and Forecast - by Technology
- 9. Asia Pacific RF Power Semiconductor Industry Analysis, Insights and Forecast, 2020-2032
- 9.1. Market Analysis, Insights and Forecast - by Technology
- 9.1.1. LDMOS
- 9.1.2. GaAs
- 9.1.3. GaN
- 9.2. Market Analysis, Insights and Forecast - by Application
- 9.2.1. Telecom Infrastructure
- 9.2.2. Aerospace and Defense
- 9.2.3. Wired Broadband
- 9.2.4. Satellite Communication
- 9.2.5. RF Energy (Automotive)
- 9.2.6. Other Applications
- 9.1. Market Analysis, Insights and Forecast - by Technology
- 10. Rest of the World RF Power Semiconductor Industry Analysis, Insights and Forecast, 2020-2032
- 10.1. Market Analysis, Insights and Forecast - by Technology
- 10.1.1. LDMOS
- 10.1.2. GaAs
- 10.1.3. GaN
- 10.2. Market Analysis, Insights and Forecast - by Application
- 10.2.1. Telecom Infrastructure
- 10.2.2. Aerospace and Defense
- 10.2.3. Wired Broadband
- 10.2.4. Satellite Communication
- 10.2.5. RF Energy (Automotive)
- 10.2.6. Other Applications
- 10.1. Market Analysis, Insights and Forecast - by Technology
- 11. Competitive Analysis
- 11.1. Company Profiles
- 11.1.1 NXP Semiconductors NV
- 11.1.1.1. Company Overview
- 11.1.1.2. Products
- 11.1.1.3. Company Financials
- 11.1.1.4. SWOT Analysis
- 11.1.2 Cree Inc
- 11.1.2.1. Company Overview
- 11.1.2.2. Products
- 11.1.2.3. Company Financials
- 11.1.2.4. SWOT Analysis
- 11.1.3 Mitsubishi Electric Corporation
- 11.1.3.1. Company Overview
- 11.1.3.2. Products
- 11.1.3.3. Company Financials
- 11.1.3.4. SWOT Analysis
- 11.1.4 STMicroelectronics NV
- 11.1.4.1. Company Overview
- 11.1.4.2. Products
- 11.1.4.3. Company Financials
- 11.1.4.4. SWOT Analysis
- 11.1.5 Aethercomm Inc
- 11.1.5.1. Company Overview
- 11.1.5.2. Products
- 11.1.5.3. Company Financials
- 11.1.5.4. SWOT Analysis
- 11.1.6 Toshiba Corporation
- 11.1.6.1. Company Overview
- 11.1.6.2. Products
- 11.1.6.3. Company Financials
- 11.1.6.4. SWOT Analysis
- 11.1.7 M/A-COM Technology Solutions Holdings Inc
- 11.1.7.1. Company Overview
- 11.1.7.2. Products
- 11.1.7.3. Company Financials
- 11.1.7.4. SWOT Analysis
- 11.1.8 Qorvo Inc
- 11.1.8.1. Company Overview
- 11.1.8.2. Products
- 11.1.8.3. Company Financials
- 11.1.8.4. SWOT Analysis
- 11.1.9 Murata Manufacturing Co Ltd
- 11.1.9.1. Company Overview
- 11.1.9.2. Products
- 11.1.9.3. Company Financials
- 11.1.9.4. SWOT Analysis
- 11.1.10 Analog Devices Inc
- 11.1.10.1. Company Overview
- 11.1.10.2. Products
- 11.1.10.3. Company Financials
- 11.1.10.4. SWOT Analysis
- 11.1.11 Qualcomm Inc
- 11.1.11.1. Company Overview
- 11.1.11.2. Products
- 11.1.11.3. Company Financials
- 11.1.11.4. SWOT Analysis
- 11.1.1 NXP Semiconductors NV
- 11.2. Market Entropy
- 11.2.1 Company's Key Areas Served
- 11.2.2 Recent Developments
- 11.3. Company Market Share Analysis 2025
- 11.3.1 Top 5 Companies Market Share Analysis
- 11.3.2 Top 3 Companies Market Share Analysis
- 11.4. List of Potential Customers
- 12. Research Methodology
List of Figures
- Figure 1: Global RF Power Semiconductor Industry Revenue Breakdown (undefined, %) by Region 2025 & 2033
- Figure 2: North America RF Power Semiconductor Industry Revenue (undefined), by Technology 2025 & 2033
- Figure 3: North America RF Power Semiconductor Industry Revenue Share (%), by Technology 2025 & 2033
- Figure 4: North America RF Power Semiconductor Industry Revenue (undefined), by Application 2025 & 2033
- Figure 5: North America RF Power Semiconductor Industry Revenue Share (%), by Application 2025 & 2033
- Figure 6: North America RF Power Semiconductor Industry Revenue (undefined), by Country 2025 & 2033
- Figure 7: North America RF Power Semiconductor Industry Revenue Share (%), by Country 2025 & 2033
- Figure 8: Europe RF Power Semiconductor Industry Revenue (undefined), by Technology 2025 & 2033
- Figure 9: Europe RF Power Semiconductor Industry Revenue Share (%), by Technology 2025 & 2033
- Figure 10: Europe RF Power Semiconductor Industry Revenue (undefined), by Application 2025 & 2033
- Figure 11: Europe RF Power Semiconductor Industry Revenue Share (%), by Application 2025 & 2033
- Figure 12: Europe RF Power Semiconductor Industry Revenue (undefined), by Country 2025 & 2033
- Figure 13: Europe RF Power Semiconductor Industry Revenue Share (%), by Country 2025 & 2033
- Figure 14: Asia Pacific RF Power Semiconductor Industry Revenue (undefined), by Technology 2025 & 2033
- Figure 15: Asia Pacific RF Power Semiconductor Industry Revenue Share (%), by Technology 2025 & 2033
- Figure 16: Asia Pacific RF Power Semiconductor Industry Revenue (undefined), by Application 2025 & 2033
- Figure 17: Asia Pacific RF Power Semiconductor Industry Revenue Share (%), by Application 2025 & 2033
- Figure 18: Asia Pacific RF Power Semiconductor Industry Revenue (undefined), by Country 2025 & 2033
- Figure 19: Asia Pacific RF Power Semiconductor Industry Revenue Share (%), by Country 2025 & 2033
- Figure 20: Rest of the World RF Power Semiconductor Industry Revenue (undefined), by Technology 2025 & 2033
- Figure 21: Rest of the World RF Power Semiconductor Industry Revenue Share (%), by Technology 2025 & 2033
- Figure 22: Rest of the World RF Power Semiconductor Industry Revenue (undefined), by Application 2025 & 2033
- Figure 23: Rest of the World RF Power Semiconductor Industry Revenue Share (%), by Application 2025 & 2033
- Figure 24: Rest of the World RF Power Semiconductor Industry Revenue (undefined), by Country 2025 & 2033
- Figure 25: Rest of the World RF Power Semiconductor Industry Revenue Share (%), by Country 2025 & 2033
List of Tables
- Table 1: Global RF Power Semiconductor Industry Revenue undefined Forecast, by Technology 2020 & 2033
- Table 2: Global RF Power Semiconductor Industry Revenue undefined Forecast, by Application 2020 & 2033
- Table 3: Global RF Power Semiconductor Industry Revenue undefined Forecast, by Region 2020 & 2033
- Table 4: Global RF Power Semiconductor Industry Revenue undefined Forecast, by Technology 2020 & 2033
- Table 5: Global RF Power Semiconductor Industry Revenue undefined Forecast, by Application 2020 & 2033
- Table 6: Global RF Power Semiconductor Industry Revenue undefined Forecast, by Country 2020 & 2033
- Table 7: United States RF Power Semiconductor Industry Revenue (undefined) Forecast, by Application 2020 & 2033
- Table 8: Canada RF Power Semiconductor Industry Revenue (undefined) Forecast, by Application 2020 & 2033
- Table 9: Global RF Power Semiconductor Industry Revenue undefined Forecast, by Technology 2020 & 2033
- Table 10: Global RF Power Semiconductor Industry Revenue undefined Forecast, by Application 2020 & 2033
- Table 11: Global RF Power Semiconductor Industry Revenue undefined Forecast, by Country 2020 & 2033
- Table 12: United Kingdom RF Power Semiconductor Industry Revenue (undefined) Forecast, by Application 2020 & 2033
- Table 13: Germany RF Power Semiconductor Industry Revenue (undefined) Forecast, by Application 2020 & 2033
- Table 14: France RF Power Semiconductor Industry Revenue (undefined) Forecast, by Application 2020 & 2033
- Table 15: Rest of Europe RF Power Semiconductor Industry Revenue (undefined) Forecast, by Application 2020 & 2033
- Table 16: Global RF Power Semiconductor Industry Revenue undefined Forecast, by Technology 2020 & 2033
- Table 17: Global RF Power Semiconductor Industry Revenue undefined Forecast, by Application 2020 & 2033
- Table 18: Global RF Power Semiconductor Industry Revenue undefined Forecast, by Country 2020 & 2033
- Table 19: China RF Power Semiconductor Industry Revenue (undefined) Forecast, by Application 2020 & 2033
- Table 20: India RF Power Semiconductor Industry Revenue (undefined) Forecast, by Application 2020 & 2033
- Table 21: South Korea RF Power Semiconductor Industry Revenue (undefined) Forecast, by Application 2020 & 2033
- Table 22: Japan RF Power Semiconductor Industry Revenue (undefined) Forecast, by Application 2020 & 2033
- Table 23: Rest of Asia Pacific RF Power Semiconductor Industry Revenue (undefined) Forecast, by Application 2020 & 2033
- Table 24: Global RF Power Semiconductor Industry Revenue undefined Forecast, by Technology 2020 & 2033
- Table 25: Global RF Power Semiconductor Industry Revenue undefined Forecast, by Application 2020 & 2033
- Table 26: Global RF Power Semiconductor Industry Revenue undefined Forecast, by Country 2020 & 2033
- Table 27: Latin America RF Power Semiconductor Industry Revenue (undefined) Forecast, by Application 2020 & 2033
- Table 28: Middle East RF Power Semiconductor Industry Revenue (undefined) Forecast, by Application 2020 & 2033
Frequently Asked Questions
1. What is the projected Compound Annual Growth Rate (CAGR) of the RF Power Semiconductor Industry?
The projected CAGR is approximately 15.56%.
2. Which companies are prominent players in the RF Power Semiconductor Industry?
Key companies in the market include NXP Semiconductors NV, Cree Inc, Mitsubishi Electric Corporation, STMicroelectronics NV, Aethercomm Inc, Toshiba Corporation, M/A-COM Technology Solutions Holdings Inc, Qorvo Inc, Murata Manufacturing Co Ltd, Analog Devices Inc, Qualcomm Inc.
3. What are the main segments of the RF Power Semiconductor Industry?
The market segments include Technology, Application.
4. Can you provide details about the market size?
The market size is estimated to be USD XXX N/A as of 2022.
5. What are some drivers contributing to market growth?
; Increasing Usage of Smartphones; Growing Transition toward 5G and Long-term Evolution (LTE) Implementation.
6. What are the notable trends driving market growth?
Aerospace and Defense Sector to Offer Potential Growth Opportunities.
7. Are there any restraints impacting market growth?
; High Cost of RF Power.
8. Can you provide examples of recent developments in the market?
N/A
9. What pricing options are available for accessing the report?
Pricing options include single-user, multi-user, and enterprise licenses priced at USD 4750, USD 5250, and USD 8750 respectively.
10. Is the market size provided in terms of value or volume?
The market size is provided in terms of value, measured in N/A.
11. Are there any specific market keywords associated with the report?
Yes, the market keyword associated with the report is "RF Power Semiconductor Industry," which aids in identifying and referencing the specific market segment covered.
12. How do I determine which pricing option suits my needs best?
The pricing options vary based on user requirements and access needs. Individual users may opt for single-user licenses, while businesses requiring broader access may choose multi-user or enterprise licenses for cost-effective access to the report.
13. Are there any additional resources or data provided in the RF Power Semiconductor Industry report?
While the report offers comprehensive insights, it's advisable to review the specific contents or supplementary materials provided to ascertain if additional resources or data are available.
14. How can I stay updated on further developments or reports in the RF Power Semiconductor Industry?
To stay informed about further developments, trends, and reports in the RF Power Semiconductor Industry, consider subscribing to industry newsletters, following relevant companies and organizations, or regularly checking reputable industry news sources and publications.
Methodology
Step 1 - Identification of Relevant Samples Size from Population Database


Step 2 - Approaches for Defining Global Market Size (Value, Volume* & Price*)

Note*: In applicable scenarios
Step 3 - Data Sources
Primary Research
- Web Analytics
- Survey Reports
- Research Institute
- Latest Research Reports
- Opinion Leaders
Secondary Research
- Annual Reports
- White Paper
- Latest Press Release
- Industry Association
- Paid Database
- Investor Presentations

Step 4 - Data Triangulation
Involves using different sources of information in order to increase the validity of a study
These sources are likely to be stakeholders in a program - participants, other researchers, program staff, other community members, and so on.
Then we put all data in single framework & apply various statistical tools to find out the dynamic on the market.
During the analysis stage, feedback from the stakeholder groups would be compared to determine areas of agreement as well as areas of divergence