
Key Insights
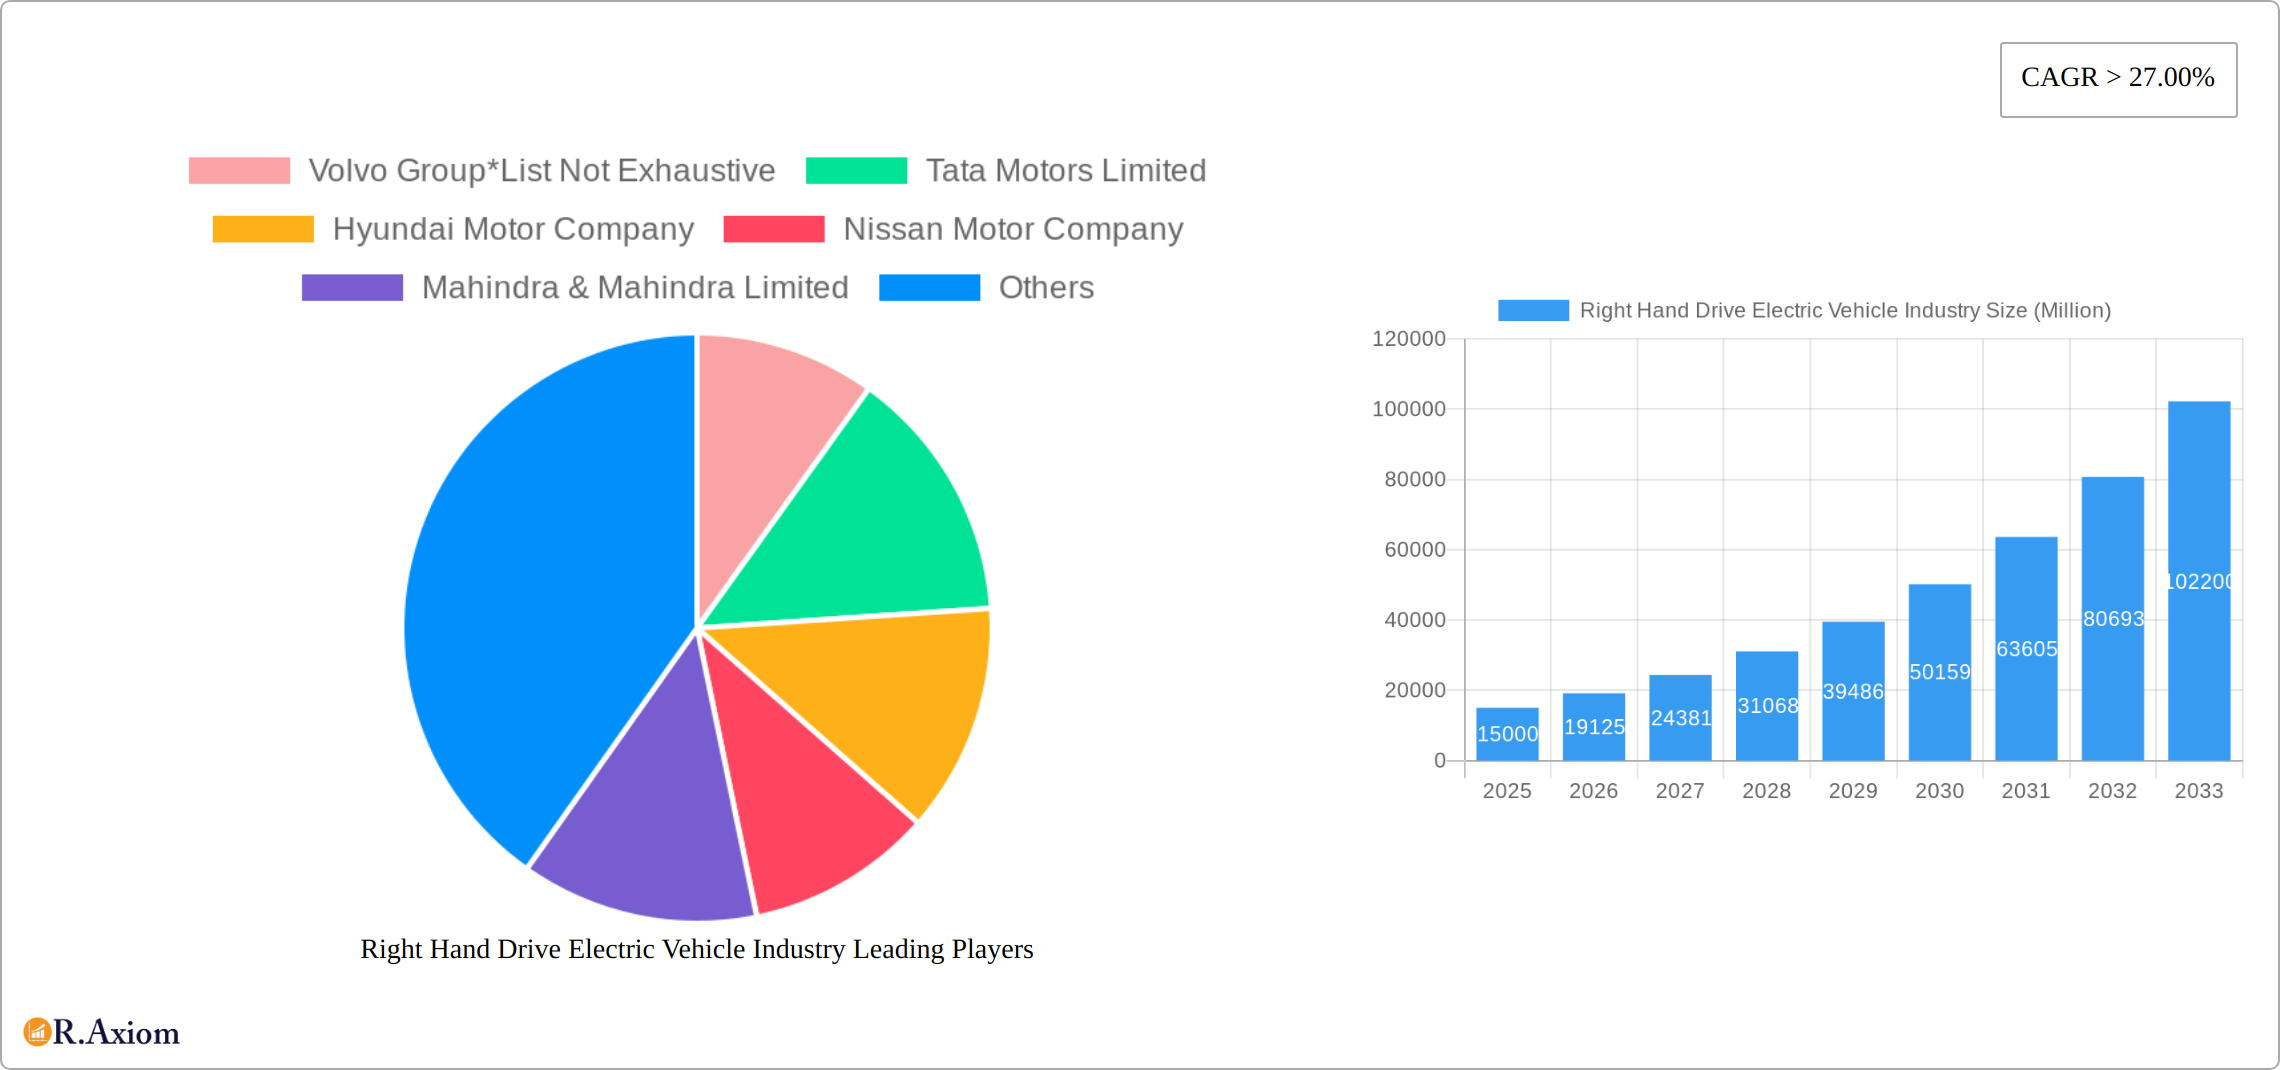
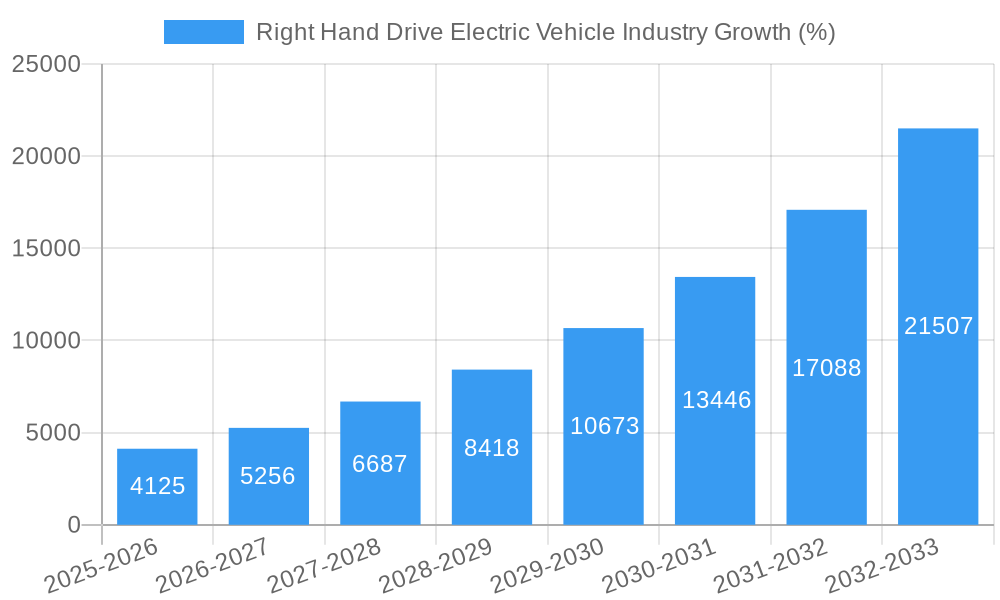
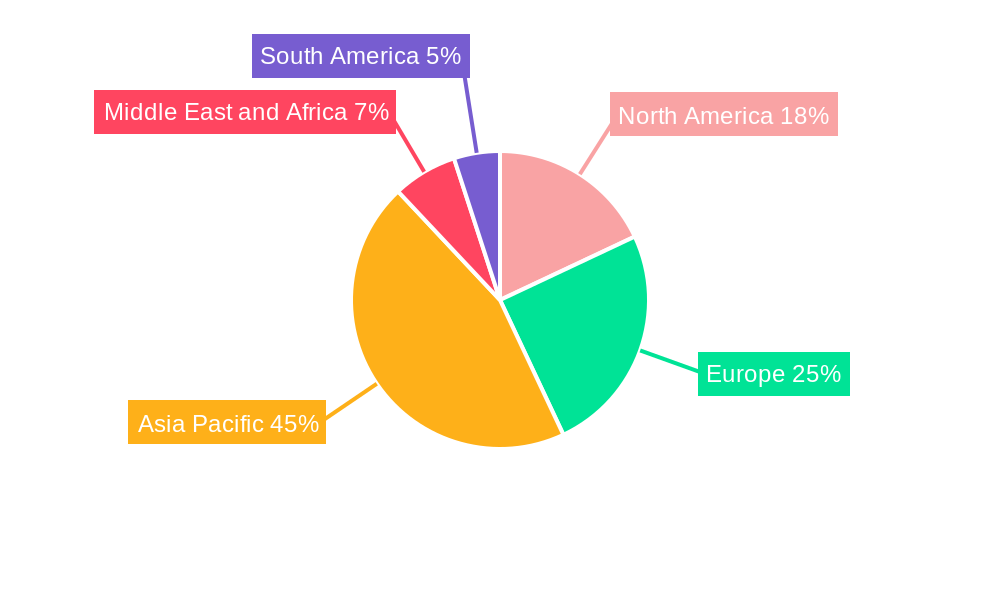
The Right-Hand Drive (RHD) Electric Vehicle (EV) market is experiencing explosive growth, fueled by stringent emission regulations globally and increasing consumer demand for sustainable transportation. With a Compound Annual Growth Rate (CAGR) exceeding 27% from 2019 to 2033, the market presents significant opportunities for manufacturers and investors. The market segmentation reveals strong growth across various vehicle types, including passenger and commercial vehicles, and propulsion types, encompassing Battery Electric Vehicles (BEVs), Plug-in Hybrid Electric Vehicles (PHEVs), and Fuel Cell Electric Vehicles (FCEVs). Key market drivers include government incentives promoting EV adoption, advancements in battery technology leading to increased range and affordability, and growing environmental awareness among consumers. While challenges remain, such as limited charging infrastructure in some regions and higher initial purchase costs compared to internal combustion engine vehicles, the overall market trajectory remains positive. The geographical distribution shows strong performance across regions like Asia Pacific, driven by high population density and increasing vehicle ownership, while North America and Europe also contribute significantly. Leading automotive companies like Volvo, Tata Motors, Hyundai, Nissan, Mahindra & Mahindra, BMW, MG Motor, Audi, Toyota, Honda, and BYD are actively investing in RHD EV development and production, further accelerating market expansion.
The projected market size for 2025, based on the provided data and considering the CAGR of over 27%, can be reasonably estimated in the billions of dollars (exact figure requires more granular data). The forecast period from 2025 to 2033 shows continued growth, with particular dynamism expected in the Asia-Pacific region due to the rapidly developing economies and supportive governmental policies. However, the market growth will be influenced by factors such as the availability of charging infrastructure, battery technology advancements, and the overall economic climate. The success of individual manufacturers will depend on their ability to adapt to these evolving dynamics, particularly in developing robust supply chains and strategically targeting specific market segments. The RHD EV market is poised for significant expansion, creating a competitive landscape where innovation and effective market positioning will be crucial for long-term success.
Right Hand Drive Electric Vehicle Industry: A Comprehensive Market Report (2019-2033)
This comprehensive report provides a detailed analysis of the Right Hand Drive (RHD) Electric Vehicle (EV) industry, offering invaluable insights for stakeholders seeking to understand market trends, competitive dynamics, and future growth opportunities. The report covers the period 2019-2033, with a focus on the base year 2025 and a forecast period spanning 2025-2033. The analysis incorporates data from the historical period (2019-2024) and utilizes extensive primary and secondary research to ensure accuracy and reliability. The global market is projected to reach xx Million by 2033.
Right Hand Drive Electric Vehicle Industry Market Concentration & Innovation
This section analyzes the competitive landscape of the RHD EV market, focusing on market concentration, innovation drivers, regulatory frameworks, product substitutes, end-user trends, and mergers & acquisitions (M&A) activities. We examine market share distribution amongst key players and delve into the value of significant M&A deals. The analysis considers the influence of government policies, technological advancements, and consumer behavior on market dynamics. The increasing adoption of EVs in RHD markets is driving innovation in battery technology, charging infrastructure, and vehicle design. Key metrics such as market share, M&A deal values, and patent filings will be analyzed to provide a comprehensive understanding of market concentration and innovation.
- Market Share Analysis: [Data will be included here detailing market share of key players. Example: Tata Motors holds xx% market share, followed by Toyota with xx%, etc.]
- M&A Activity: [Data will be presented here detailing significant M&A deals and their impact on market consolidation. Example: Total M&A value in the period 2019-2024 was estimated at xx Million.]
- Regulatory Landscape: [Analysis of key regulations and their impact on market growth, including incentives and emission standards.]
- Innovation Drivers: [Discussion of key technological advancements and their role in shaping market competition, including battery technology, charging infrastructure, and autonomous driving.]
Right Hand Drive Electric Vehicle Industry Industry Trends & Insights
This section explores key trends and insights shaping the RHD EV market. It examines market growth drivers, technological disruptions, consumer preferences, and competitive dynamics. The analysis incorporates data on market size, compound annual growth rate (CAGR), and market penetration rates to provide a holistic view of market evolution. The shift towards sustainable transportation, coupled with advancements in battery technology and government incentives, is expected to fuel significant growth in the coming years. We’ll analyze the impact of factors such as rising fuel prices, evolving consumer preferences, and the growing awareness of environmental concerns. The competitive landscape is intensely dynamic, with established automakers and new entrants vying for market share.
- Market Size and CAGR: [Data will be included here showing projected market size and CAGR for the forecast period. Example: The market is projected to grow at a CAGR of xx% from 2025 to 2033.]
- Market Penetration: [Data will be included here showing the projected market penetration rate of EVs in RHD markets. Example: Market penetration is expected to reach xx% by 2033.]
- Technological Disruptions: [Analysis of the impact of technological advancements, such as battery technology, autonomous driving, and smart charging infrastructure.]
- Consumer Preferences: [Analysis of consumer preferences for different EV types (e.g., passenger vehicles, commercial vehicles), propulsion types (BEV, PHEV, FCEV), and features.]
Dominant Markets & Segments in Right Hand Drive Electric Vehicle Industry
This section identifies the leading regions, countries, and segments within the RHD EV market. The analysis considers both vehicle type (Passenger Vehicle, Commercial Vehicle) and propulsion type (Battery Electric Vehicle (BEV), Plug-in Hybrid Electric Vehicle (PHEV), Fuel Cell Electric Vehicle (FCEV)). Key drivers of dominance, such as economic policies, infrastructure development, and consumer preferences, are highlighted. Detailed analysis will be provided for each leading market/segment, examining factors contributing to its success.
- Leading Region/Country: [Data and analysis will be included here determining the leading market based on factors like sales volume, market penetration, and government support. Example: India is expected to be a leading market due to government incentives and growing consumer demand.]
- Dominant Vehicle Type: [Analysis to determine whether passenger vehicles or commercial vehicles dominate the RHD EV market. Example: Passenger Vehicles are expected to hold a larger market share]
- Dominant Propulsion Type: [Analysis of the market share of BEV, PHEV, and FCEV within RHD markets. Example: BEVs are expected to dominate due to cost-effectiveness and improved technology.]
- Key Drivers:
- Economic Policies: [Analysis of the role of government incentives, subsidies, and tax benefits in driving market growth.]
- Infrastructure Development: [Analysis of the impact of charging infrastructure development on market expansion.]
- Consumer Preferences: [Analysis of consumer preferences and their impact on market segmentation.]
Right Hand Drive Electric Vehicle Industry Product Developments
This section summarizes recent product innovations, applications, and competitive advantages within the RHD EV market. The focus is on technological trends and market fit, highlighting advancements in battery technology, charging technology, and vehicle design that are shaping competitive dynamics. The analysis will showcase how innovative products are addressing consumer needs and market gaps.
[Paragraph summarizing product innovations, applications, and competitive advantages. Example: Recent innovations in battery technology, including solid-state batteries, are expected to improve range and reduce charging time, leading to increased consumer adoption. The increasing availability of fast-charging stations is also driving market growth.]
Report Scope & Segmentation Analysis
This report segments the RHD EV market by vehicle type (Passenger Vehicle, Commercial Vehicle) and propulsion type (BEV, PHEV, FCEV). Each segment’s growth projections, market size, and competitive dynamics are analyzed. The report provides detailed insights into the opportunities and challenges within each segment.
- Passenger Vehicles: [Growth projections, market size, and competitive dynamics for passenger EVs within the RHD market.]
- Commercial Vehicles: [Growth projections, market size, and competitive dynamics for commercial EVs within the RHD market.]
- BEV: [Growth projections, market size, and competitive dynamics for BEVs within the RHD market.]
- PHEV: [Growth projections, market size, and competitive dynamics for PHEVs within the RHD market.]
- FCEV: [Growth projections, market size, and competitive dynamics for FCEVs within the RHD market.]
Key Drivers of Right Hand Drive Electric Vehicle Industry Growth
Several factors are driving the growth of the RHD EV market. These include technological advancements, supportive government policies, and increasing consumer awareness of environmental concerns. Specific examples will be detailed within the report.
[Paragraph outlining key growth drivers, including specific examples. Example: Government incentives such as tax credits and subsidies are stimulating demand, while advancements in battery technology are improving vehicle range and performance. Growing consumer awareness of environmental issues and the desire for sustainable transportation also play a key role.]
Challenges in the Right Hand Drive Electric Vehicle Industry Sector
Despite the significant growth potential, the RHD EV market faces several challenges. These include regulatory hurdles, supply chain disruptions, and intense competition. Quantifiable impacts of these challenges will be assessed.
[Paragraph outlining key challenges, including quantifiable impacts. Example: The high initial cost of EVs remains a barrier to entry for many consumers. Supply chain disruptions related to battery components can also impact production and availability. Furthermore, intense competition amongst established and new players presents a challenge for market share gains.]
Emerging Opportunities in Right Hand Drive Electric Vehicle Industry
The RHD EV market presents several exciting emerging opportunities. These include the expansion into new markets, the development of innovative technologies, and the evolution of consumer preferences.
[Paragraph outlining emerging opportunities. Example: The expansion of charging infrastructure in emerging markets presents significant opportunities for growth. Advancements in battery technology, autonomous driving, and vehicle-to-grid (V2G) technology are creating new avenues for innovation. Furthermore, changing consumer preferences towards sustainability are driving increased demand for EVs.]
Leading Players in the Right Hand Drive Electric Vehicle Industry Market
- Volvo Group
- Tata Motors Limited
- Hyundai Motor Company
- Nissan Motor Company
- Mahindra & Mahindra Limited
- BMW Group
- MG Motor India Pvt Ltd
- Audi AG
- Toyota Motor Corporation
- Honda Motor Co Ltd
- BYD CO LTD
Key Developments in Right Hand Drive Electric Vehicle Industry Industry
- January 2022: Toyota announced the launch of its new electric SUV BZX4 in various ASEAN countries.
- January 2022: Tata Motor Company announced plans to mainstream EVs, targeting 50,000 annual sales in FY 2023 and aiming for 125,000-150,000 units annually within two years.
- December 2021: BMW Group Asia launched the first-ever BMW iX and new BMW iX3 electric cars in Singapore.
- April 2021: Mahindra & Mahindra announced plans to launch 16 electric vehicles by 2027.
Strategic Outlook for Right Hand Drive Electric Vehicle Industry Market
The RHD EV market is poised for significant growth in the coming years, driven by technological advancements, supportive government policies, and increasing consumer demand for sustainable transportation. The market presents considerable opportunities for both established automakers and new entrants. The continued development of charging infrastructure, advancements in battery technology, and the introduction of innovative business models will further drive market expansion.
Right Hand Drive Electric Vehicle Industry Segmentation
-
1. Vehicle Type
- 1.1. Passenger Vehicle
- 1.2. Commercial Vehicle
-
2. Propulsion Type
- 2.1. Battery Electric Vehicle
- 2.2. Plug-in Hybrid Electric Vehicle
- 2.3. Fuel Cell Electric Vehicle
Right Hand Drive Electric Vehicle Industry Segmentation By Geography
-
1. North America
- 1.1. Bahamas
- 1.2. Jamaica
-
2. Europe
- 2.1. United Kingdom
- 2.2. Ireland
-
3. Asia Pacific
- 3.1. Japan
- 3.2. Malaysia
- 3.3. Indonesia
- 3.4. Australia
- 3.5. Rest of Asia Pacific
-
4. Middle East and Africa
- 4.1. South Africa
- 4.2. Uganda
- 4.3. Kenya
- 4.4. Rest of Middle East and Africa
-
5. South America
- 5.1. Guyana
- 5.2. Suriname
- 5.3. Falkland Islands
Right Hand Drive Electric Vehicle Industry REPORT HIGHLIGHTS
| Aspects | Details |
|---|---|
| Study Period | 2019-2033 |
| Base Year | 2024 |
| Estimated Year | 2025 |
| Forecast Period | 2025-2033 |
| Historical Period | 2019-2024 |
| Growth Rate | CAGR of > 27.00% from 2019-2033 |
| Segmentation |
|
Table of Contents
- 1. Introduction
- 1.1. Research Scope
- 1.2. Market Segmentation
- 1.3. Research Methodology
- 1.4. Definitions and Assumptions
- 2. Executive Summary
- 2.1. Introduction
- 3. Market Dynamics
- 3.1. Introduction
- 3.2. Market Drivers
- 3.2.1. Used Car Financing To Continue Solving Consumer Challenges In Indonesia
- 3.3. Market Restrains
- 3.3.1. Trust And Transparency In Used Car Remained A Key Challenge For Consumers
- 3.4. Market Trends
- 3.4.1. Growing Demand for Passenger Cars
- 4. Market Factor Analysis
- 4.1. Porters Five Forces
- 4.2. Supply/Value Chain
- 4.3. PESTEL analysis
- 4.4. Market Entropy
- 4.5. Patent/Trademark Analysis
- 5. Global Right Hand Drive Electric Vehicle Industry Analysis, Insights and Forecast, 2019-2031
- 5.1. Market Analysis, Insights and Forecast - by Vehicle Type
- 5.1.1. Passenger Vehicle
- 5.1.2. Commercial Vehicle
- 5.2. Market Analysis, Insights and Forecast - by Propulsion Type
- 5.2.1. Battery Electric Vehicle
- 5.2.2. Plug-in Hybrid Electric Vehicle
- 5.2.3. Fuel Cell Electric Vehicle
- 5.3. Market Analysis, Insights and Forecast - by Region
- 5.3.1. North America
- 5.3.2. Europe
- 5.3.3. Asia Pacific
- 5.3.4. Middle East and Africa
- 5.3.5. South America
- 5.1. Market Analysis, Insights and Forecast - by Vehicle Type
- 6. North America Right Hand Drive Electric Vehicle Industry Analysis, Insights and Forecast, 2019-2031
- 6.1. Market Analysis, Insights and Forecast - by Vehicle Type
- 6.1.1. Passenger Vehicle
- 6.1.2. Commercial Vehicle
- 6.2. Market Analysis, Insights and Forecast - by Propulsion Type
- 6.2.1. Battery Electric Vehicle
- 6.2.2. Plug-in Hybrid Electric Vehicle
- 6.2.3. Fuel Cell Electric Vehicle
- 6.1. Market Analysis, Insights and Forecast - by Vehicle Type
- 7. Europe Right Hand Drive Electric Vehicle Industry Analysis, Insights and Forecast, 2019-2031
- 7.1. Market Analysis, Insights and Forecast - by Vehicle Type
- 7.1.1. Passenger Vehicle
- 7.1.2. Commercial Vehicle
- 7.2. Market Analysis, Insights and Forecast - by Propulsion Type
- 7.2.1. Battery Electric Vehicle
- 7.2.2. Plug-in Hybrid Electric Vehicle
- 7.2.3. Fuel Cell Electric Vehicle
- 7.1. Market Analysis, Insights and Forecast - by Vehicle Type
- 8. Asia Pacific Right Hand Drive Electric Vehicle Industry Analysis, Insights and Forecast, 2019-2031
- 8.1. Market Analysis, Insights and Forecast - by Vehicle Type
- 8.1.1. Passenger Vehicle
- 8.1.2. Commercial Vehicle
- 8.2. Market Analysis, Insights and Forecast - by Propulsion Type
- 8.2.1. Battery Electric Vehicle
- 8.2.2. Plug-in Hybrid Electric Vehicle
- 8.2.3. Fuel Cell Electric Vehicle
- 8.1. Market Analysis, Insights and Forecast - by Vehicle Type
- 9. Middle East and Africa Right Hand Drive Electric Vehicle Industry Analysis, Insights and Forecast, 2019-2031
- 9.1. Market Analysis, Insights and Forecast - by Vehicle Type
- 9.1.1. Passenger Vehicle
- 9.1.2. Commercial Vehicle
- 9.2. Market Analysis, Insights and Forecast - by Propulsion Type
- 9.2.1. Battery Electric Vehicle
- 9.2.2. Plug-in Hybrid Electric Vehicle
- 9.2.3. Fuel Cell Electric Vehicle
- 9.1. Market Analysis, Insights and Forecast - by Vehicle Type
- 10. South America Right Hand Drive Electric Vehicle Industry Analysis, Insights and Forecast, 2019-2031
- 10.1. Market Analysis, Insights and Forecast - by Vehicle Type
- 10.1.1. Passenger Vehicle
- 10.1.2. Commercial Vehicle
- 10.2. Market Analysis, Insights and Forecast - by Propulsion Type
- 10.2.1. Battery Electric Vehicle
- 10.2.2. Plug-in Hybrid Electric Vehicle
- 10.2.3. Fuel Cell Electric Vehicle
- 10.1. Market Analysis, Insights and Forecast - by Vehicle Type
- 11. North America Right Hand Drive Electric Vehicle Industry Analysis, Insights and Forecast, 2019-2031
- 11.1. Market Analysis, Insights and Forecast - By Country/Sub-region
- 11.1.1 Bahamas
- 11.1.2 Jamaica
- 12. Europe Right Hand Drive Electric Vehicle Industry Analysis, Insights and Forecast, 2019-2031
- 12.1. Market Analysis, Insights and Forecast - By Country/Sub-region
- 12.1.1 United Kingdom
- 12.1.2 Ireland
- 13. Asia Pacific Right Hand Drive Electric Vehicle Industry Analysis, Insights and Forecast, 2019-2031
- 13.1. Market Analysis, Insights and Forecast - By Country/Sub-region
- 13.1.1 Japan
- 13.1.2 Malaysia
- 13.1.3 Indonesia
- 13.1.4 Australia
- 13.1.5 Rest of Asia Pacific
- 14. Middle East and Africa Right Hand Drive Electric Vehicle Industry Analysis, Insights and Forecast, 2019-2031
- 14.1. Market Analysis, Insights and Forecast - By Country/Sub-region
- 14.1.1 South Africa
- 14.1.2 Uganda
- 14.1.3 Kenya
- 14.1.4 Rest of Middle East and Africa
- 15. South America Right Hand Drive Electric Vehicle Industry Analysis, Insights and Forecast, 2019-2031
- 15.1. Market Analysis, Insights and Forecast - By Country/Sub-region
- 15.1.1 Guyana
- 15.1.2 Suriname
- 15.1.3 Falkland Islands
- 16. Competitive Analysis
- 16.1. Global Market Share Analysis 2024
- 16.2. Company Profiles
- 16.2.1 Volvo Group*List Not Exhaustive
- 16.2.1.1. Overview
- 16.2.1.2. Products
- 16.2.1.3. SWOT Analysis
- 16.2.1.4. Recent Developments
- 16.2.1.5. Financials (Based on Availability)
- 16.2.2 Tata Motors Limited
- 16.2.2.1. Overview
- 16.2.2.2. Products
- 16.2.2.3. SWOT Analysis
- 16.2.2.4. Recent Developments
- 16.2.2.5. Financials (Based on Availability)
- 16.2.3 Hyundai Motor Company
- 16.2.3.1. Overview
- 16.2.3.2. Products
- 16.2.3.3. SWOT Analysis
- 16.2.3.4. Recent Developments
- 16.2.3.5. Financials (Based on Availability)
- 16.2.4 Nissan Motor Company
- 16.2.4.1. Overview
- 16.2.4.2. Products
- 16.2.4.3. SWOT Analysis
- 16.2.4.4. Recent Developments
- 16.2.4.5. Financials (Based on Availability)
- 16.2.5 Mahindra & Mahindra Limited
- 16.2.5.1. Overview
- 16.2.5.2. Products
- 16.2.5.3. SWOT Analysis
- 16.2.5.4. Recent Developments
- 16.2.5.5. Financials (Based on Availability)
- 16.2.6 BMW Group
- 16.2.6.1. Overview
- 16.2.6.2. Products
- 16.2.6.3. SWOT Analysis
- 16.2.6.4. Recent Developments
- 16.2.6.5. Financials (Based on Availability)
- 16.2.7 MG Motor India Pvt Ltd
- 16.2.7.1. Overview
- 16.2.7.2. Products
- 16.2.7.3. SWOT Analysis
- 16.2.7.4. Recent Developments
- 16.2.7.5. Financials (Based on Availability)
- 16.2.8 Audi AG
- 16.2.8.1. Overview
- 16.2.8.2. Products
- 16.2.8.3. SWOT Analysis
- 16.2.8.4. Recent Developments
- 16.2.8.5. Financials (Based on Availability)
- 16.2.9 Toyota Motor Corporation
- 16.2.9.1. Overview
- 16.2.9.2. Products
- 16.2.9.3. SWOT Analysis
- 16.2.9.4. Recent Developments
- 16.2.9.5. Financials (Based on Availability)
- 16.2.10 Honda Motor Co Ltd
- 16.2.10.1. Overview
- 16.2.10.2. Products
- 16.2.10.3. SWOT Analysis
- 16.2.10.4. Recent Developments
- 16.2.10.5. Financials (Based on Availability)
- 16.2.11 BYD CO LTD
- 16.2.11.1. Overview
- 16.2.11.2. Products
- 16.2.11.3. SWOT Analysis
- 16.2.11.4. Recent Developments
- 16.2.11.5. Financials (Based on Availability)
- 16.2.1 Volvo Group*List Not Exhaustive
List of Figures
- Figure 1: Global Right Hand Drive Electric Vehicle Industry Revenue Breakdown (Million, %) by Region 2024 & 2032
- Figure 2: North America Right Hand Drive Electric Vehicle Industry Revenue (Million), by Country 2024 & 2032
- Figure 3: North America Right Hand Drive Electric Vehicle Industry Revenue Share (%), by Country 2024 & 2032
- Figure 4: Europe Right Hand Drive Electric Vehicle Industry Revenue (Million), by Country 2024 & 2032
- Figure 5: Europe Right Hand Drive Electric Vehicle Industry Revenue Share (%), by Country 2024 & 2032
- Figure 6: Asia Pacific Right Hand Drive Electric Vehicle Industry Revenue (Million), by Country 2024 & 2032
- Figure 7: Asia Pacific Right Hand Drive Electric Vehicle Industry Revenue Share (%), by Country 2024 & 2032
- Figure 8: Middle East and Africa Right Hand Drive Electric Vehicle Industry Revenue (Million), by Country 2024 & 2032
- Figure 9: Middle East and Africa Right Hand Drive Electric Vehicle Industry Revenue Share (%), by Country 2024 & 2032
- Figure 10: South America Right Hand Drive Electric Vehicle Industry Revenue (Million), by Country 2024 & 2032
- Figure 11: South America Right Hand Drive Electric Vehicle Industry Revenue Share (%), by Country 2024 & 2032
- Figure 12: North America Right Hand Drive Electric Vehicle Industry Revenue (Million), by Vehicle Type 2024 & 2032
- Figure 13: North America Right Hand Drive Electric Vehicle Industry Revenue Share (%), by Vehicle Type 2024 & 2032
- Figure 14: North America Right Hand Drive Electric Vehicle Industry Revenue (Million), by Propulsion Type 2024 & 2032
- Figure 15: North America Right Hand Drive Electric Vehicle Industry Revenue Share (%), by Propulsion Type 2024 & 2032
- Figure 16: North America Right Hand Drive Electric Vehicle Industry Revenue (Million), by Country 2024 & 2032
- Figure 17: North America Right Hand Drive Electric Vehicle Industry Revenue Share (%), by Country 2024 & 2032
- Figure 18: Europe Right Hand Drive Electric Vehicle Industry Revenue (Million), by Vehicle Type 2024 & 2032
- Figure 19: Europe Right Hand Drive Electric Vehicle Industry Revenue Share (%), by Vehicle Type 2024 & 2032
- Figure 20: Europe Right Hand Drive Electric Vehicle Industry Revenue (Million), by Propulsion Type 2024 & 2032
- Figure 21: Europe Right Hand Drive Electric Vehicle Industry Revenue Share (%), by Propulsion Type 2024 & 2032
- Figure 22: Europe Right Hand Drive Electric Vehicle Industry Revenue (Million), by Country 2024 & 2032
- Figure 23: Europe Right Hand Drive Electric Vehicle Industry Revenue Share (%), by Country 2024 & 2032
- Figure 24: Asia Pacific Right Hand Drive Electric Vehicle Industry Revenue (Million), by Vehicle Type 2024 & 2032
- Figure 25: Asia Pacific Right Hand Drive Electric Vehicle Industry Revenue Share (%), by Vehicle Type 2024 & 2032
- Figure 26: Asia Pacific Right Hand Drive Electric Vehicle Industry Revenue (Million), by Propulsion Type 2024 & 2032
- Figure 27: Asia Pacific Right Hand Drive Electric Vehicle Industry Revenue Share (%), by Propulsion Type 2024 & 2032
- Figure 28: Asia Pacific Right Hand Drive Electric Vehicle Industry Revenue (Million), by Country 2024 & 2032
- Figure 29: Asia Pacific Right Hand Drive Electric Vehicle Industry Revenue Share (%), by Country 2024 & 2032
- Figure 30: Middle East and Africa Right Hand Drive Electric Vehicle Industry Revenue (Million), by Vehicle Type 2024 & 2032
- Figure 31: Middle East and Africa Right Hand Drive Electric Vehicle Industry Revenue Share (%), by Vehicle Type 2024 & 2032
- Figure 32: Middle East and Africa Right Hand Drive Electric Vehicle Industry Revenue (Million), by Propulsion Type 2024 & 2032
- Figure 33: Middle East and Africa Right Hand Drive Electric Vehicle Industry Revenue Share (%), by Propulsion Type 2024 & 2032
- Figure 34: Middle East and Africa Right Hand Drive Electric Vehicle Industry Revenue (Million), by Country 2024 & 2032
- Figure 35: Middle East and Africa Right Hand Drive Electric Vehicle Industry Revenue Share (%), by Country 2024 & 2032
- Figure 36: South America Right Hand Drive Electric Vehicle Industry Revenue (Million), by Vehicle Type 2024 & 2032
- Figure 37: South America Right Hand Drive Electric Vehicle Industry Revenue Share (%), by Vehicle Type 2024 & 2032
- Figure 38: South America Right Hand Drive Electric Vehicle Industry Revenue (Million), by Propulsion Type 2024 & 2032
- Figure 39: South America Right Hand Drive Electric Vehicle Industry Revenue Share (%), by Propulsion Type 2024 & 2032
- Figure 40: South America Right Hand Drive Electric Vehicle Industry Revenue (Million), by Country 2024 & 2032
- Figure 41: South America Right Hand Drive Electric Vehicle Industry Revenue Share (%), by Country 2024 & 2032
List of Tables
- Table 1: Global Right Hand Drive Electric Vehicle Industry Revenue Million Forecast, by Region 2019 & 2032
- Table 2: Global Right Hand Drive Electric Vehicle Industry Revenue Million Forecast, by Vehicle Type 2019 & 2032
- Table 3: Global Right Hand Drive Electric Vehicle Industry Revenue Million Forecast, by Propulsion Type 2019 & 2032
- Table 4: Global Right Hand Drive Electric Vehicle Industry Revenue Million Forecast, by Region 2019 & 2032
- Table 5: Global Right Hand Drive Electric Vehicle Industry Revenue Million Forecast, by Country 2019 & 2032
- Table 6: Bahamas Right Hand Drive Electric Vehicle Industry Revenue (Million) Forecast, by Application 2019 & 2032
- Table 7: Jamaica Right Hand Drive Electric Vehicle Industry Revenue (Million) Forecast, by Application 2019 & 2032
- Table 8: Global Right Hand Drive Electric Vehicle Industry Revenue Million Forecast, by Country 2019 & 2032
- Table 9: United Kingdom Right Hand Drive Electric Vehicle Industry Revenue (Million) Forecast, by Application 2019 & 2032
- Table 10: Ireland Right Hand Drive Electric Vehicle Industry Revenue (Million) Forecast, by Application 2019 & 2032
- Table 11: Global Right Hand Drive Electric Vehicle Industry Revenue Million Forecast, by Country 2019 & 2032
- Table 12: Japan Right Hand Drive Electric Vehicle Industry Revenue (Million) Forecast, by Application 2019 & 2032
- Table 13: Malaysia Right Hand Drive Electric Vehicle Industry Revenue (Million) Forecast, by Application 2019 & 2032
- Table 14: Indonesia Right Hand Drive Electric Vehicle Industry Revenue (Million) Forecast, by Application 2019 & 2032
- Table 15: Australia Right Hand Drive Electric Vehicle Industry Revenue (Million) Forecast, by Application 2019 & 2032
- Table 16: Rest of Asia Pacific Right Hand Drive Electric Vehicle Industry Revenue (Million) Forecast, by Application 2019 & 2032
- Table 17: Global Right Hand Drive Electric Vehicle Industry Revenue Million Forecast, by Country 2019 & 2032
- Table 18: South Africa Right Hand Drive Electric Vehicle Industry Revenue (Million) Forecast, by Application 2019 & 2032
- Table 19: Uganda Right Hand Drive Electric Vehicle Industry Revenue (Million) Forecast, by Application 2019 & 2032
- Table 20: Kenya Right Hand Drive Electric Vehicle Industry Revenue (Million) Forecast, by Application 2019 & 2032
- Table 21: Rest of Middle East and Africa Right Hand Drive Electric Vehicle Industry Revenue (Million) Forecast, by Application 2019 & 2032
- Table 22: Global Right Hand Drive Electric Vehicle Industry Revenue Million Forecast, by Country 2019 & 2032
- Table 23: Guyana Right Hand Drive Electric Vehicle Industry Revenue (Million) Forecast, by Application 2019 & 2032
- Table 24: Suriname Right Hand Drive Electric Vehicle Industry Revenue (Million) Forecast, by Application 2019 & 2032
- Table 25: Falkland Islands Right Hand Drive Electric Vehicle Industry Revenue (Million) Forecast, by Application 2019 & 2032
- Table 26: Global Right Hand Drive Electric Vehicle Industry Revenue Million Forecast, by Vehicle Type 2019 & 2032
- Table 27: Global Right Hand Drive Electric Vehicle Industry Revenue Million Forecast, by Propulsion Type 2019 & 2032
- Table 28: Global Right Hand Drive Electric Vehicle Industry Revenue Million Forecast, by Country 2019 & 2032
- Table 29: Bahamas Right Hand Drive Electric Vehicle Industry Revenue (Million) Forecast, by Application 2019 & 2032
- Table 30: Jamaica Right Hand Drive Electric Vehicle Industry Revenue (Million) Forecast, by Application 2019 & 2032
- Table 31: Global Right Hand Drive Electric Vehicle Industry Revenue Million Forecast, by Vehicle Type 2019 & 2032
- Table 32: Global Right Hand Drive Electric Vehicle Industry Revenue Million Forecast, by Propulsion Type 2019 & 2032
- Table 33: Global Right Hand Drive Electric Vehicle Industry Revenue Million Forecast, by Country 2019 & 2032
- Table 34: United Kingdom Right Hand Drive Electric Vehicle Industry Revenue (Million) Forecast, by Application 2019 & 2032
- Table 35: Ireland Right Hand Drive Electric Vehicle Industry Revenue (Million) Forecast, by Application 2019 & 2032
- Table 36: Global Right Hand Drive Electric Vehicle Industry Revenue Million Forecast, by Vehicle Type 2019 & 2032
- Table 37: Global Right Hand Drive Electric Vehicle Industry Revenue Million Forecast, by Propulsion Type 2019 & 2032
- Table 38: Global Right Hand Drive Electric Vehicle Industry Revenue Million Forecast, by Country 2019 & 2032
- Table 39: Japan Right Hand Drive Electric Vehicle Industry Revenue (Million) Forecast, by Application 2019 & 2032
- Table 40: Malaysia Right Hand Drive Electric Vehicle Industry Revenue (Million) Forecast, by Application 2019 & 2032
- Table 41: Indonesia Right Hand Drive Electric Vehicle Industry Revenue (Million) Forecast, by Application 2019 & 2032
- Table 42: Australia Right Hand Drive Electric Vehicle Industry Revenue (Million) Forecast, by Application 2019 & 2032
- Table 43: Rest of Asia Pacific Right Hand Drive Electric Vehicle Industry Revenue (Million) Forecast, by Application 2019 & 2032
- Table 44: Global Right Hand Drive Electric Vehicle Industry Revenue Million Forecast, by Vehicle Type 2019 & 2032
- Table 45: Global Right Hand Drive Electric Vehicle Industry Revenue Million Forecast, by Propulsion Type 2019 & 2032
- Table 46: Global Right Hand Drive Electric Vehicle Industry Revenue Million Forecast, by Country 2019 & 2032
- Table 47: South Africa Right Hand Drive Electric Vehicle Industry Revenue (Million) Forecast, by Application 2019 & 2032
- Table 48: Uganda Right Hand Drive Electric Vehicle Industry Revenue (Million) Forecast, by Application 2019 & 2032
- Table 49: Kenya Right Hand Drive Electric Vehicle Industry Revenue (Million) Forecast, by Application 2019 & 2032
- Table 50: Rest of Middle East and Africa Right Hand Drive Electric Vehicle Industry Revenue (Million) Forecast, by Application 2019 & 2032
- Table 51: Global Right Hand Drive Electric Vehicle Industry Revenue Million Forecast, by Vehicle Type 2019 & 2032
- Table 52: Global Right Hand Drive Electric Vehicle Industry Revenue Million Forecast, by Propulsion Type 2019 & 2032
- Table 53: Global Right Hand Drive Electric Vehicle Industry Revenue Million Forecast, by Country 2019 & 2032
- Table 54: Guyana Right Hand Drive Electric Vehicle Industry Revenue (Million) Forecast, by Application 2019 & 2032
- Table 55: Suriname Right Hand Drive Electric Vehicle Industry Revenue (Million) Forecast, by Application 2019 & 2032
- Table 56: Falkland Islands Right Hand Drive Electric Vehicle Industry Revenue (Million) Forecast, by Application 2019 & 2032
Frequently Asked Questions
1. What is the projected Compound Annual Growth Rate (CAGR) of the Right Hand Drive Electric Vehicle Industry?
The projected CAGR is approximately > 27.00%.
2. Which companies are prominent players in the Right Hand Drive Electric Vehicle Industry?
Key companies in the market include Volvo Group*List Not Exhaustive, Tata Motors Limited, Hyundai Motor Company, Nissan Motor Company, Mahindra & Mahindra Limited, BMW Group, MG Motor India Pvt Ltd, Audi AG, Toyota Motor Corporation, Honda Motor Co Ltd, BYD CO LTD.
3. What are the main segments of the Right Hand Drive Electric Vehicle Industry?
The market segments include Vehicle Type, Propulsion Type.
4. Can you provide details about the market size?
The market size is estimated to be USD XX Million as of 2022.
5. What are some drivers contributing to market growth?
Used Car Financing To Continue Solving Consumer Challenges In Indonesia.
6. What are the notable trends driving market growth?
Growing Demand for Passenger Cars.
7. Are there any restraints impacting market growth?
Trust And Transparency In Used Car Remained A Key Challenge For Consumers.
8. Can you provide examples of recent developments in the market?
In January 2022, Toyota announced to launch of its new electric SUV BZX4 in various ASEAN countries such as Thailand and Singapore. The vehicle is expected to launch before the end of 2022.
9. What pricing options are available for accessing the report?
Pricing options include single-user, multi-user, and enterprise licenses priced at USD 4750, USD 5250, and USD 8750 respectively.
10. Is the market size provided in terms of value or volume?
The market size is provided in terms of value, measured in Million.
11. Are there any specific market keywords associated with the report?
Yes, the market keyword associated with the report is "Right Hand Drive Electric Vehicle Industry," which aids in identifying and referencing the specific market segment covered.
12. How do I determine which pricing option suits my needs best?
The pricing options vary based on user requirements and access needs. Individual users may opt for single-user licenses, while businesses requiring broader access may choose multi-user or enterprise licenses for cost-effective access to the report.
13. Are there any additional resources or data provided in the Right Hand Drive Electric Vehicle Industry report?
While the report offers comprehensive insights, it's advisable to review the specific contents or supplementary materials provided to ascertain if additional resources or data are available.
14. How can I stay updated on further developments or reports in the Right Hand Drive Electric Vehicle Industry?
To stay informed about further developments, trends, and reports in the Right Hand Drive Electric Vehicle Industry, consider subscribing to industry newsletters, following relevant companies and organizations, or regularly checking reputable industry news sources and publications.
Methodology
Step 1 - Identification of Relevant Samples Size from Population Database


Step 2 - Approaches for Defining Global Market Size (Value, Volume* & Price*)

Note*: In applicable scenarios
Step 3 - Data Sources
Primary Research
- Web Analytics
- Survey Reports
- Research Institute
- Latest Research Reports
- Opinion Leaders
Secondary Research
- Annual Reports
- White Paper
- Latest Press Release
- Industry Association
- Paid Database
- Investor Presentations

Step 4 - Data Triangulation
Involves using different sources of information in order to increase the validity of a study
These sources are likely to be stakeholders in a program - participants, other researchers, program staff, other community members, and so on.
Then we put all data in single framework & apply various statistical tools to find out the dynamic on the market.
During the analysis stage, feedback from the stakeholder groups would be compared to determine areas of agreement as well as areas of divergence


