
Key Insights
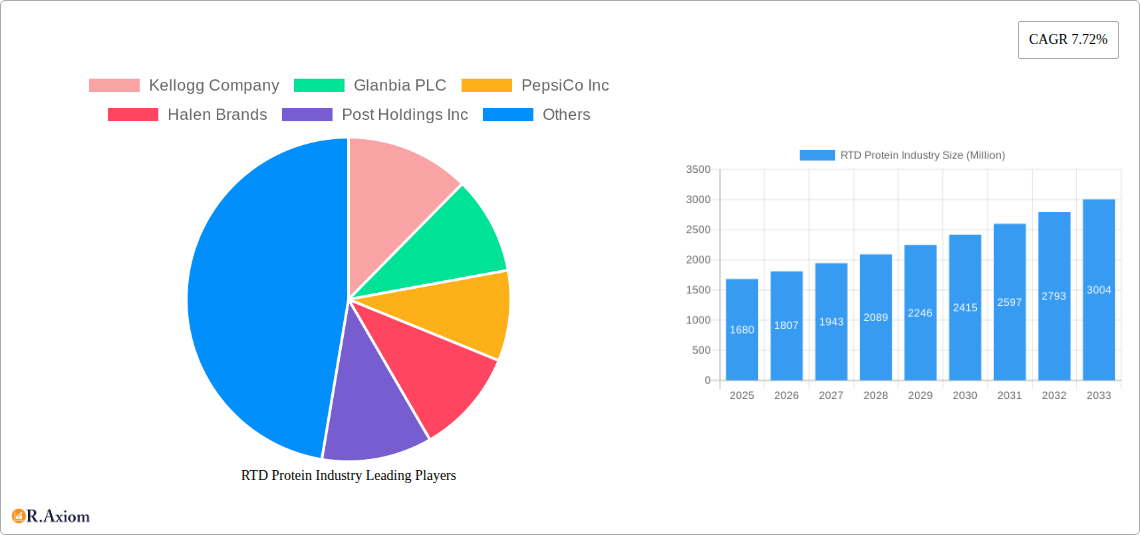
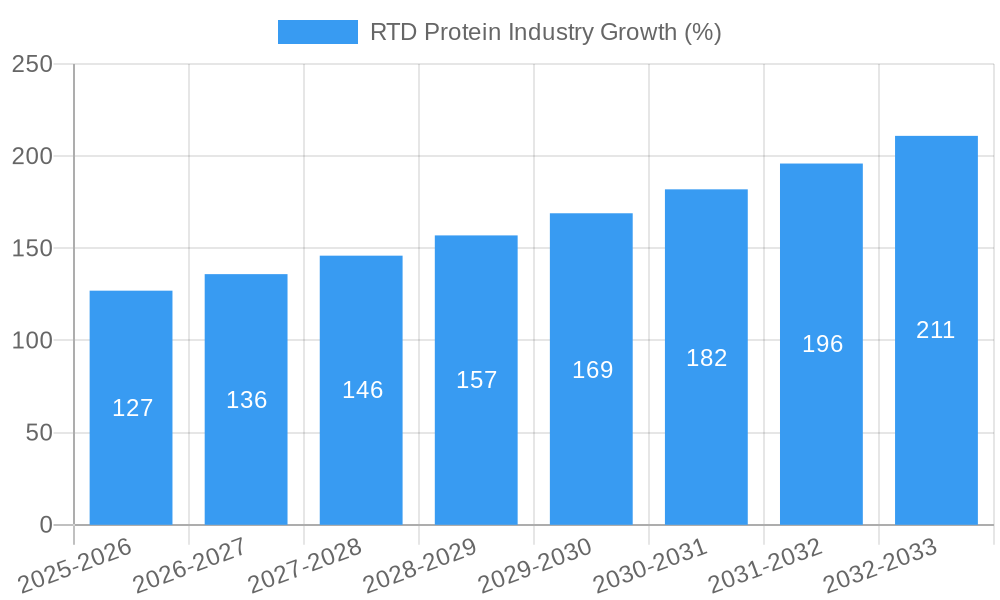
The Ready-to-Drink (RTD) protein market, valued at $1.68 billion in 2025, is projected to experience robust growth, driven by several key factors. The increasing health consciousness among consumers, coupled with the convenience offered by RTD protein drinks, fuels this expansion. Busy lifestyles and the desire for quick and easy ways to supplement protein intake are significant drivers. Furthermore, the market benefits from continuous product innovation, with companies introducing new flavors, formulations (including plant-based options), and functional benefits (e.g., added vitamins, probiotics). This innovation caters to evolving consumer preferences and dietary needs, widening the appeal beyond athletes and fitness enthusiasts to a broader demographic. The 7.72% CAGR (Compound Annual Growth Rate) indicates sustained expansion throughout the forecast period (2025-2033). Competition is fierce, with established players like Kellogg's, PepsiCo, and Glanbia vying for market share alongside newer entrants and smaller brands focusing on niche markets. The market segmentation, while not explicitly provided, likely includes various protein sources (whey, casein, soy, plant-based blends), product formats (shakes, ready-to-drink bottled beverages), and distribution channels (grocery stores, convenience stores, online retailers). While potential restraints might include fluctuating raw material costs and concerns about added sugars in some formulations, the overall market outlook remains positive due to the strong underlying consumer demand and ongoing industry innovation.
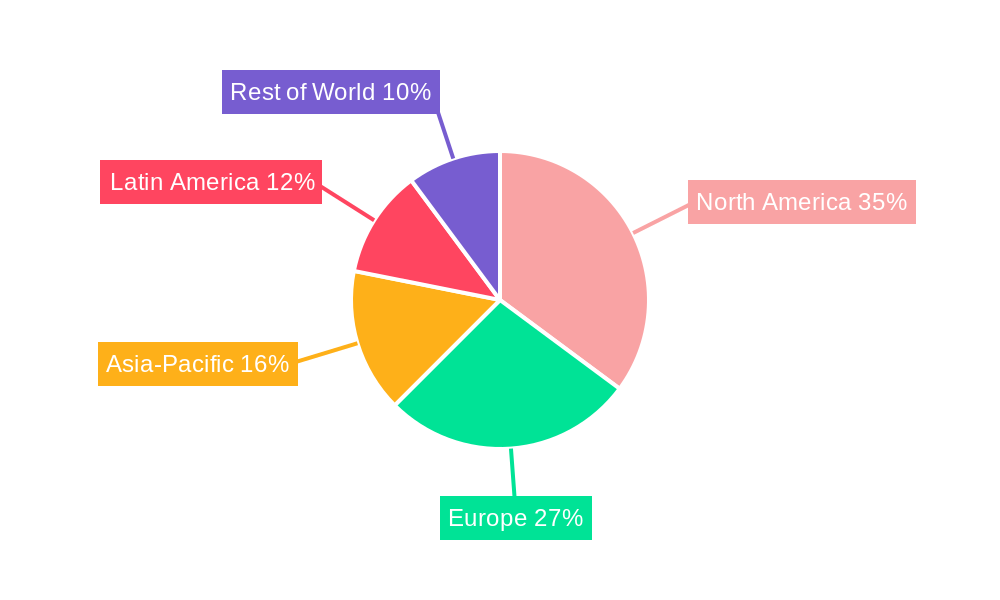
The forecast for the RTD protein market suggests continued expansion beyond 2025. Considering the 7.72% CAGR, the market size is likely to surpass $2 billion within a few years. The strategic moves of major players, including acquisitions, new product launches, and expansion into international markets, will play a crucial role in shaping market dynamics. The growing popularity of plant-based protein alternatives will continue to influence product development and consumer choice. Efforts to address consumer concerns about sugar content and improve the overall nutritional profile of RTD protein products are expected to be key differentiators. Moreover, the increasing integration of technology in personalized nutrition and fitness tracking is likely to create new opportunities for the RTD protein industry, leading to further growth and innovation in the coming years. This growth will be distributed across various regions, with North America and Europe likely to retain significant market shares, while emerging markets in Asia and Latin America show significant potential for future expansion.
RTD Protein Industry: A Comprehensive Market Report (2019-2033)
This comprehensive report provides an in-depth analysis of the Ready-to-Drink (RTD) protein industry, covering market size, growth drivers, competitive landscape, and future outlook. The study period spans from 2019 to 2033, with 2025 serving as both the base and estimated year. The report utilizes data from the historical period (2019-2024) to forecast market trends up to 2033. The report is essential for industry stakeholders, investors, and businesses seeking to understand and capitalize on opportunities within this rapidly evolving market. The global RTD protein market is projected to reach xx Million by 2033, exhibiting a CAGR of xx% during the forecast period (2025-2033).
RTD Protein Industry Market Concentration & Innovation
This section analyzes the market concentration, innovation drivers, regulatory landscape, product substitutes, end-user trends, and mergers & acquisitions (M&A) activity within the RTD protein industry. The market is characterized by a moderate level of concentration, with key players holding significant market share. However, the presence of numerous smaller players indicates a dynamic competitive environment.
- Market Share: While precise market share figures for each company are unavailable and require access to proprietary data, major players like Kellogg Company, Glanbia PLC, PepsiCo Inc, and others hold substantial shares, collectively accounting for an estimated xx Million in revenue in 2024. Smaller companies contribute significantly to overall volume.
- Innovation Drivers: Consumer demand for convenient, high-protein options fuels innovation, driving the development of new flavors, formulations (e.g., plant-based), and functional ingredients.
- Regulatory Frameworks: Regulations concerning food safety, labeling, and health claims influence product development and marketing strategies. Varying regulations across regions create complexities for global players.
- Product Substitutes: Other protein sources such as protein bars, powders, and whole foods compete with RTD proteins.
- End-User Trends: The increasing health consciousness and demand for convenient protein sources among health-conscious consumers, athletes, and the general population drives market growth.
- M&A Activity: The RTD protein market has witnessed significant M&A activity, with deal values exceeding xx Million in recent years (precise figures requiring proprietary data). These activities shape market consolidation and influence competitive dynamics. Examples include but are not limited to strategic partnerships and acquisitions.
RTD Protein Industry Industry Trends & Insights
This section delves into the key trends and insights shaping the RTD protein market, including market growth drivers, technological disruptions, evolving consumer preferences, and competitive dynamics.
The RTD protein market is experiencing robust growth, primarily driven by the rising health consciousness among consumers and increasing demand for convenient and on-the-go protein sources. Technological advancements, such as improved protein stabilization techniques and novel packaging solutions, are further contributing to market expansion. The shift in consumer preference towards healthier, more natural options, including plant-based protein alternatives, is creating new opportunities for innovation and market penetration. The competitive landscape is dynamic, with both established players and emerging brands vying for market share. The CAGR for the period 2025-2033 is projected at xx%, indicating significant growth potential. Market penetration is expanding rapidly as RTD protein products become increasingly available through diverse retail channels, including convenience stores, supermarkets, and online platforms. Further detailed analysis of specific market segments and regions would clarify trends such as the increased adoption of plant-based options in specific regions.
Dominant Markets & Segments in RTD Protein Industry
This section identifies the leading regions, countries, and segments within the RTD protein industry, analyzing their dominance and underlying factors.
- Dominant Region: North America currently holds a significant share of the global RTD protein market, due to high consumer demand, established distribution networks, and a robust health and wellness culture.
- Key Drivers (North America):
- High disposable income levels
- Strong health and wellness culture
- Well-developed retail infrastructure
- Significant presence of major players
- Dominant Segment: The dairy-based segment currently commands a larger market share compared to plant-based alternatives, but the plant-based segment is experiencing rapid growth.
RTD Protein Industry Product Developments
Recent product innovations in the RTD protein market focus on enhancing taste and texture, while meeting consumer demands for natural and functional ingredients. Technological advancements in protein stabilization and processing enable the creation of more palatable and shelf-stable products. These innovations improve market fit by catering to diverse consumer needs and preferences, and improving the competitive advantage of product manufacturers. The increased availability of plant-based alternatives expands the consumer base and differentiates competitors.
Report Scope & Segmentation Analysis
This report segments the RTD protein market based on product type (dairy-based, plant-based, blended), packaging (bottles, cartons, pouches), distribution channel (supermarkets, convenience stores, online), and region (North America, Europe, Asia-Pacific, etc.). Each segment exhibits unique growth trajectories and competitive dynamics. Market sizes and growth projections for each segment are included in the full report. For example, the plant-based segment is expected to experience the highest growth rate.
Key Drivers of RTD Protein Industry Growth
Several factors contribute to the growth of the RTD protein industry: the rising prevalence of health-conscious consumers seeking convenient protein sources; increasing demand for on-the-go nutrition; technological advancements leading to better-tasting and more shelf-stable products; and the expansion of distribution channels. Favorable regulatory environments in certain regions also support industry growth.
Challenges in the RTD Protein Industry Sector
The RTD protein industry faces several challenges. Stringent regulatory requirements regarding labeling and health claims can increase production costs and complexity. Supply chain disruptions and fluctuating raw material prices pose risks to profitability. Intense competition and the need for continuous innovation to maintain market relevance are further hurdles. These factors can collectively impact market growth and hinder expansion for certain players.
Emerging Opportunities in RTD Protein Industry
The RTD protein market presents several exciting opportunities. Expansion into new and emerging markets in developing economies presents significant growth potential. Technological advancements, such as the development of novel protein sources and sustainable packaging solutions, are creating new avenues for innovation. Meeting evolving consumer preferences by focusing on functional benefits (e.g., improved immunity) will drive adoption and create a strong competitive advantage.
Leading Players in the RTD Protein Industry Market
- Kellogg Company
- Glanbia PLC
- PepsiCo Inc
- Halen Brands
- Post Holdings Inc
- Koia
- Abbott Nutrition
- Labrada Nutrition
- The Coca Cola Company
- Pure Protein
- List Not Exhaustive
Key Developments in RTD Protein Industry
- May 2021: PepsiCo's Naked brand launched its Indulgent Protein smoothie.
- February 2021: Koia secured national distribution in 7-Eleven stores.
- February 2022: Optimum Nutrition introduced a new RTD protein supplement in the UK.
- March 2022: QNT SA partnered with Qimia Makmal Arad Company for distribution in Iran.
Strategic Outlook for RTD Protein Industry Market
The RTD protein market is poised for continued growth, driven by sustained consumer demand, product innovation, and expansion into new markets. Strategic partnerships, investments in research and development, and effective marketing campaigns will be crucial for success in this competitive landscape. The focus on sustainability and ethical sourcing will further influence the future trajectory.
RTD Protein Industry Segmentation
-
1. Source
- 1.1. Whey
- 1.2. Casein
- 1.3. Soy
- 1.4. Other Sources
-
2. Type of Packaging
- 2.1. Bottles
- 2.2. Cans
- 2.3. Others
-
3. Distribution Channel
- 3.1. Supermarkets/Hypermarkets
- 3.2. Pharmacies/Drugstores
- 3.3. Specialist Retailers
- 3.4. Online Retail
- 3.5. Other Channels
RTD Protein Industry Segmentation By Geography
-
1. North America
- 1.1. United States
- 1.2. Canada
- 1.3. Mexico
- 1.4. Rest of North America
-
2. Europe
- 2.1. Germany
- 2.2. United Kingdom
- 2.3. France
- 2.4. Spain
- 2.5. Italy
- 2.6. Russia
- 2.7. Rest of Europe
-
3. Asia Pacific
- 3.1. China
- 3.2. Japan
- 3.3. India
- 3.4. Australia
- 3.5. Rest of Asia Pacific
-
4. South America
- 4.1. Brazil
- 4.2. Argentina
- 4.3. Rest of South America
-
5. Middle East and Africa
- 5.1. South Africa
- 5.2. United Arab Emirates
- 5.3. Rest of Middle East and Africa
RTD Protein Industry REPORT HIGHLIGHTS
| Aspects | Details |
|---|---|
| Study Period | 2019-2033 |
| Base Year | 2024 |
| Estimated Year | 2025 |
| Forecast Period | 2025-2033 |
| Historical Period | 2019-2024 |
| Growth Rate | CAGR of 7.72% from 2019-2033 |
| Segmentation |
|
Table of Contents
- 1. Introduction
- 1.1. Research Scope
- 1.2. Market Segmentation
- 1.3. Research Methodology
- 1.4. Definitions and Assumptions
- 2. Executive Summary
- 2.1. Introduction
- 3. Market Dynamics
- 3.1. Introduction
- 3.2. Market Drivers
- 3.3. Market Restrains
- 3.4. Market Trends
- 3.4.1. Strong Demand from Health Conscious Consumers
- 4. Market Factor Analysis
- 4.1. Porters Five Forces
- 4.2. Supply/Value Chain
- 4.3. PESTEL analysis
- 4.4. Market Entropy
- 4.5. Patent/Trademark Analysis
- 5. Global RTD Protein Industry Analysis, Insights and Forecast, 2019-2031
- 5.1. Market Analysis, Insights and Forecast - by Source
- 5.1.1. Whey
- 5.1.2. Casein
- 5.1.3. Soy
- 5.1.4. Other Sources
- 5.2. Market Analysis, Insights and Forecast - by Type of Packaging
- 5.2.1. Bottles
- 5.2.2. Cans
- 5.2.3. Others
- 5.3. Market Analysis, Insights and Forecast - by Distribution Channel
- 5.3.1. Supermarkets/Hypermarkets
- 5.3.2. Pharmacies/Drugstores
- 5.3.3. Specialist Retailers
- 5.3.4. Online Retail
- 5.3.5. Other Channels
- 5.4. Market Analysis, Insights and Forecast - by Region
- 5.4.1. North America
- 5.4.2. Europe
- 5.4.3. Asia Pacific
- 5.4.4. South America
- 5.4.5. Middle East and Africa
- 5.1. Market Analysis, Insights and Forecast - by Source
- 6. North America RTD Protein Industry Analysis, Insights and Forecast, 2019-2031
- 6.1. Market Analysis, Insights and Forecast - by Source
- 6.1.1. Whey
- 6.1.2. Casein
- 6.1.3. Soy
- 6.1.4. Other Sources
- 6.2. Market Analysis, Insights and Forecast - by Type of Packaging
- 6.2.1. Bottles
- 6.2.2. Cans
- 6.2.3. Others
- 6.3. Market Analysis, Insights and Forecast - by Distribution Channel
- 6.3.1. Supermarkets/Hypermarkets
- 6.3.2. Pharmacies/Drugstores
- 6.3.3. Specialist Retailers
- 6.3.4. Online Retail
- 6.3.5. Other Channels
- 6.1. Market Analysis, Insights and Forecast - by Source
- 7. Europe RTD Protein Industry Analysis, Insights and Forecast, 2019-2031
- 7.1. Market Analysis, Insights and Forecast - by Source
- 7.1.1. Whey
- 7.1.2. Casein
- 7.1.3. Soy
- 7.1.4. Other Sources
- 7.2. Market Analysis, Insights and Forecast - by Type of Packaging
- 7.2.1. Bottles
- 7.2.2. Cans
- 7.2.3. Others
- 7.3. Market Analysis, Insights and Forecast - by Distribution Channel
- 7.3.1. Supermarkets/Hypermarkets
- 7.3.2. Pharmacies/Drugstores
- 7.3.3. Specialist Retailers
- 7.3.4. Online Retail
- 7.3.5. Other Channels
- 7.1. Market Analysis, Insights and Forecast - by Source
- 8. Asia Pacific RTD Protein Industry Analysis, Insights and Forecast, 2019-2031
- 8.1. Market Analysis, Insights and Forecast - by Source
- 8.1.1. Whey
- 8.1.2. Casein
- 8.1.3. Soy
- 8.1.4. Other Sources
- 8.2. Market Analysis, Insights and Forecast - by Type of Packaging
- 8.2.1. Bottles
- 8.2.2. Cans
- 8.2.3. Others
- 8.3. Market Analysis, Insights and Forecast - by Distribution Channel
- 8.3.1. Supermarkets/Hypermarkets
- 8.3.2. Pharmacies/Drugstores
- 8.3.3. Specialist Retailers
- 8.3.4. Online Retail
- 8.3.5. Other Channels
- 8.1. Market Analysis, Insights and Forecast - by Source
- 9. South America RTD Protein Industry Analysis, Insights and Forecast, 2019-2031
- 9.1. Market Analysis, Insights and Forecast - by Source
- 9.1.1. Whey
- 9.1.2. Casein
- 9.1.3. Soy
- 9.1.4. Other Sources
- 9.2. Market Analysis, Insights and Forecast - by Type of Packaging
- 9.2.1. Bottles
- 9.2.2. Cans
- 9.2.3. Others
- 9.3. Market Analysis, Insights and Forecast - by Distribution Channel
- 9.3.1. Supermarkets/Hypermarkets
- 9.3.2. Pharmacies/Drugstores
- 9.3.3. Specialist Retailers
- 9.3.4. Online Retail
- 9.3.5. Other Channels
- 9.1. Market Analysis, Insights and Forecast - by Source
- 10. Middle East and Africa RTD Protein Industry Analysis, Insights and Forecast, 2019-2031
- 10.1. Market Analysis, Insights and Forecast - by Source
- 10.1.1. Whey
- 10.1.2. Casein
- 10.1.3. Soy
- 10.1.4. Other Sources
- 10.2. Market Analysis, Insights and Forecast - by Type of Packaging
- 10.2.1. Bottles
- 10.2.2. Cans
- 10.2.3. Others
- 10.3. Market Analysis, Insights and Forecast - by Distribution Channel
- 10.3.1. Supermarkets/Hypermarkets
- 10.3.2. Pharmacies/Drugstores
- 10.3.3. Specialist Retailers
- 10.3.4. Online Retail
- 10.3.5. Other Channels
- 10.1. Market Analysis, Insights and Forecast - by Source
- 11. Competitive Analysis
- 11.1. Global Market Share Analysis 2024
- 11.2. Company Profiles
- 11.2.1 Kellogg Company
- 11.2.1.1. Overview
- 11.2.1.2. Products
- 11.2.1.3. SWOT Analysis
- 11.2.1.4. Recent Developments
- 11.2.1.5. Financials (Based on Availability)
- 11.2.2 Glanbia PLC
- 11.2.2.1. Overview
- 11.2.2.2. Products
- 11.2.2.3. SWOT Analysis
- 11.2.2.4. Recent Developments
- 11.2.2.5. Financials (Based on Availability)
- 11.2.3 PepsiCo Inc
- 11.2.3.1. Overview
- 11.2.3.2. Products
- 11.2.3.3. SWOT Analysis
- 11.2.3.4. Recent Developments
- 11.2.3.5. Financials (Based on Availability)
- 11.2.4 Halen Brands
- 11.2.4.1. Overview
- 11.2.4.2. Products
- 11.2.4.3. SWOT Analysis
- 11.2.4.4. Recent Developments
- 11.2.4.5. Financials (Based on Availability)
- 11.2.5 Post Holdings Inc
- 11.2.5.1. Overview
- 11.2.5.2. Products
- 11.2.5.3. SWOT Analysis
- 11.2.5.4. Recent Developments
- 11.2.5.5. Financials (Based on Availability)
- 11.2.6 Koia
- 11.2.6.1. Overview
- 11.2.6.2. Products
- 11.2.6.3. SWOT Analysis
- 11.2.6.4. Recent Developments
- 11.2.6.5. Financials (Based on Availability)
- 11.2.7 Abbott Nutrition
- 11.2.7.1. Overview
- 11.2.7.2. Products
- 11.2.7.3. SWOT Analysis
- 11.2.7.4. Recent Developments
- 11.2.7.5. Financials (Based on Availability)
- 11.2.8 Labrada Nutrition
- 11.2.8.1. Overview
- 11.2.8.2. Products
- 11.2.8.3. SWOT Analysis
- 11.2.8.4. Recent Developments
- 11.2.8.5. Financials (Based on Availability)
- 11.2.9 The Coca Cola Company
- 11.2.9.1. Overview
- 11.2.9.2. Products
- 11.2.9.3. SWOT Analysis
- 11.2.9.4. Recent Developments
- 11.2.9.5. Financials (Based on Availability)
- 11.2.10 Pure Protein*List Not Exhaustive
- 11.2.10.1. Overview
- 11.2.10.2. Products
- 11.2.10.3. SWOT Analysis
- 11.2.10.4. Recent Developments
- 11.2.10.5. Financials (Based on Availability)
- 11.2.1 Kellogg Company
List of Figures
- Figure 1: Global RTD Protein Industry Revenue Breakdown (Million, %) by Region 2024 & 2032
- Figure 2: Global RTD Protein Industry Volume Breakdown (Billion, %) by Region 2024 & 2032
- Figure 3: North America RTD Protein Industry Revenue (Million), by Source 2024 & 2032
- Figure 4: North America RTD Protein Industry Volume (Billion), by Source 2024 & 2032
- Figure 5: North America RTD Protein Industry Revenue Share (%), by Source 2024 & 2032
- Figure 6: North America RTD Protein Industry Volume Share (%), by Source 2024 & 2032
- Figure 7: North America RTD Protein Industry Revenue (Million), by Type of Packaging 2024 & 2032
- Figure 8: North America RTD Protein Industry Volume (Billion), by Type of Packaging 2024 & 2032
- Figure 9: North America RTD Protein Industry Revenue Share (%), by Type of Packaging 2024 & 2032
- Figure 10: North America RTD Protein Industry Volume Share (%), by Type of Packaging 2024 & 2032
- Figure 11: North America RTD Protein Industry Revenue (Million), by Distribution Channel 2024 & 2032
- Figure 12: North America RTD Protein Industry Volume (Billion), by Distribution Channel 2024 & 2032
- Figure 13: North America RTD Protein Industry Revenue Share (%), by Distribution Channel 2024 & 2032
- Figure 14: North America RTD Protein Industry Volume Share (%), by Distribution Channel 2024 & 2032
- Figure 15: North America RTD Protein Industry Revenue (Million), by Country 2024 & 2032
- Figure 16: North America RTD Protein Industry Volume (Billion), by Country 2024 & 2032
- Figure 17: North America RTD Protein Industry Revenue Share (%), by Country 2024 & 2032
- Figure 18: North America RTD Protein Industry Volume Share (%), by Country 2024 & 2032
- Figure 19: Europe RTD Protein Industry Revenue (Million), by Source 2024 & 2032
- Figure 20: Europe RTD Protein Industry Volume (Billion), by Source 2024 & 2032
- Figure 21: Europe RTD Protein Industry Revenue Share (%), by Source 2024 & 2032
- Figure 22: Europe RTD Protein Industry Volume Share (%), by Source 2024 & 2032
- Figure 23: Europe RTD Protein Industry Revenue (Million), by Type of Packaging 2024 & 2032
- Figure 24: Europe RTD Protein Industry Volume (Billion), by Type of Packaging 2024 & 2032
- Figure 25: Europe RTD Protein Industry Revenue Share (%), by Type of Packaging 2024 & 2032
- Figure 26: Europe RTD Protein Industry Volume Share (%), by Type of Packaging 2024 & 2032
- Figure 27: Europe RTD Protein Industry Revenue (Million), by Distribution Channel 2024 & 2032
- Figure 28: Europe RTD Protein Industry Volume (Billion), by Distribution Channel 2024 & 2032
- Figure 29: Europe RTD Protein Industry Revenue Share (%), by Distribution Channel 2024 & 2032
- Figure 30: Europe RTD Protein Industry Volume Share (%), by Distribution Channel 2024 & 2032
- Figure 31: Europe RTD Protein Industry Revenue (Million), by Country 2024 & 2032
- Figure 32: Europe RTD Protein Industry Volume (Billion), by Country 2024 & 2032
- Figure 33: Europe RTD Protein Industry Revenue Share (%), by Country 2024 & 2032
- Figure 34: Europe RTD Protein Industry Volume Share (%), by Country 2024 & 2032
- Figure 35: Asia Pacific RTD Protein Industry Revenue (Million), by Source 2024 & 2032
- Figure 36: Asia Pacific RTD Protein Industry Volume (Billion), by Source 2024 & 2032
- Figure 37: Asia Pacific RTD Protein Industry Revenue Share (%), by Source 2024 & 2032
- Figure 38: Asia Pacific RTD Protein Industry Volume Share (%), by Source 2024 & 2032
- Figure 39: Asia Pacific RTD Protein Industry Revenue (Million), by Type of Packaging 2024 & 2032
- Figure 40: Asia Pacific RTD Protein Industry Volume (Billion), by Type of Packaging 2024 & 2032
- Figure 41: Asia Pacific RTD Protein Industry Revenue Share (%), by Type of Packaging 2024 & 2032
- Figure 42: Asia Pacific RTD Protein Industry Volume Share (%), by Type of Packaging 2024 & 2032
- Figure 43: Asia Pacific RTD Protein Industry Revenue (Million), by Distribution Channel 2024 & 2032
- Figure 44: Asia Pacific RTD Protein Industry Volume (Billion), by Distribution Channel 2024 & 2032
- Figure 45: Asia Pacific RTD Protein Industry Revenue Share (%), by Distribution Channel 2024 & 2032
- Figure 46: Asia Pacific RTD Protein Industry Volume Share (%), by Distribution Channel 2024 & 2032
- Figure 47: Asia Pacific RTD Protein Industry Revenue (Million), by Country 2024 & 2032
- Figure 48: Asia Pacific RTD Protein Industry Volume (Billion), by Country 2024 & 2032
- Figure 49: Asia Pacific RTD Protein Industry Revenue Share (%), by Country 2024 & 2032
- Figure 50: Asia Pacific RTD Protein Industry Volume Share (%), by Country 2024 & 2032
- Figure 51: South America RTD Protein Industry Revenue (Million), by Source 2024 & 2032
- Figure 52: South America RTD Protein Industry Volume (Billion), by Source 2024 & 2032
- Figure 53: South America RTD Protein Industry Revenue Share (%), by Source 2024 & 2032
- Figure 54: South America RTD Protein Industry Volume Share (%), by Source 2024 & 2032
- Figure 55: South America RTD Protein Industry Revenue (Million), by Type of Packaging 2024 & 2032
- Figure 56: South America RTD Protein Industry Volume (Billion), by Type of Packaging 2024 & 2032
- Figure 57: South America RTD Protein Industry Revenue Share (%), by Type of Packaging 2024 & 2032
- Figure 58: South America RTD Protein Industry Volume Share (%), by Type of Packaging 2024 & 2032
- Figure 59: South America RTD Protein Industry Revenue (Million), by Distribution Channel 2024 & 2032
- Figure 60: South America RTD Protein Industry Volume (Billion), by Distribution Channel 2024 & 2032
- Figure 61: South America RTD Protein Industry Revenue Share (%), by Distribution Channel 2024 & 2032
- Figure 62: South America RTD Protein Industry Volume Share (%), by Distribution Channel 2024 & 2032
- Figure 63: South America RTD Protein Industry Revenue (Million), by Country 2024 & 2032
- Figure 64: South America RTD Protein Industry Volume (Billion), by Country 2024 & 2032
- Figure 65: South America RTD Protein Industry Revenue Share (%), by Country 2024 & 2032
- Figure 66: South America RTD Protein Industry Volume Share (%), by Country 2024 & 2032
- Figure 67: Middle East and Africa RTD Protein Industry Revenue (Million), by Source 2024 & 2032
- Figure 68: Middle East and Africa RTD Protein Industry Volume (Billion), by Source 2024 & 2032
- Figure 69: Middle East and Africa RTD Protein Industry Revenue Share (%), by Source 2024 & 2032
- Figure 70: Middle East and Africa RTD Protein Industry Volume Share (%), by Source 2024 & 2032
- Figure 71: Middle East and Africa RTD Protein Industry Revenue (Million), by Type of Packaging 2024 & 2032
- Figure 72: Middle East and Africa RTD Protein Industry Volume (Billion), by Type of Packaging 2024 & 2032
- Figure 73: Middle East and Africa RTD Protein Industry Revenue Share (%), by Type of Packaging 2024 & 2032
- Figure 74: Middle East and Africa RTD Protein Industry Volume Share (%), by Type of Packaging 2024 & 2032
- Figure 75: Middle East and Africa RTD Protein Industry Revenue (Million), by Distribution Channel 2024 & 2032
- Figure 76: Middle East and Africa RTD Protein Industry Volume (Billion), by Distribution Channel 2024 & 2032
- Figure 77: Middle East and Africa RTD Protein Industry Revenue Share (%), by Distribution Channel 2024 & 2032
- Figure 78: Middle East and Africa RTD Protein Industry Volume Share (%), by Distribution Channel 2024 & 2032
- Figure 79: Middle East and Africa RTD Protein Industry Revenue (Million), by Country 2024 & 2032
- Figure 80: Middle East and Africa RTD Protein Industry Volume (Billion), by Country 2024 & 2032
- Figure 81: Middle East and Africa RTD Protein Industry Revenue Share (%), by Country 2024 & 2032
- Figure 82: Middle East and Africa RTD Protein Industry Volume Share (%), by Country 2024 & 2032
List of Tables
- Table 1: Global RTD Protein Industry Revenue Million Forecast, by Region 2019 & 2032
- Table 2: Global RTD Protein Industry Volume Billion Forecast, by Region 2019 & 2032
- Table 3: Global RTD Protein Industry Revenue Million Forecast, by Source 2019 & 2032
- Table 4: Global RTD Protein Industry Volume Billion Forecast, by Source 2019 & 2032
- Table 5: Global RTD Protein Industry Revenue Million Forecast, by Type of Packaging 2019 & 2032
- Table 6: Global RTD Protein Industry Volume Billion Forecast, by Type of Packaging 2019 & 2032
- Table 7: Global RTD Protein Industry Revenue Million Forecast, by Distribution Channel 2019 & 2032
- Table 8: Global RTD Protein Industry Volume Billion Forecast, by Distribution Channel 2019 & 2032
- Table 9: Global RTD Protein Industry Revenue Million Forecast, by Region 2019 & 2032
- Table 10: Global RTD Protein Industry Volume Billion Forecast, by Region 2019 & 2032
- Table 11: Global RTD Protein Industry Revenue Million Forecast, by Source 2019 & 2032
- Table 12: Global RTD Protein Industry Volume Billion Forecast, by Source 2019 & 2032
- Table 13: Global RTD Protein Industry Revenue Million Forecast, by Type of Packaging 2019 & 2032
- Table 14: Global RTD Protein Industry Volume Billion Forecast, by Type of Packaging 2019 & 2032
- Table 15: Global RTD Protein Industry Revenue Million Forecast, by Distribution Channel 2019 & 2032
- Table 16: Global RTD Protein Industry Volume Billion Forecast, by Distribution Channel 2019 & 2032
- Table 17: Global RTD Protein Industry Revenue Million Forecast, by Country 2019 & 2032
- Table 18: Global RTD Protein Industry Volume Billion Forecast, by Country 2019 & 2032
- Table 19: United States RTD Protein Industry Revenue (Million) Forecast, by Application 2019 & 2032
- Table 20: United States RTD Protein Industry Volume (Billion) Forecast, by Application 2019 & 2032
- Table 21: Canada RTD Protein Industry Revenue (Million) Forecast, by Application 2019 & 2032
- Table 22: Canada RTD Protein Industry Volume (Billion) Forecast, by Application 2019 & 2032
- Table 23: Mexico RTD Protein Industry Revenue (Million) Forecast, by Application 2019 & 2032
- Table 24: Mexico RTD Protein Industry Volume (Billion) Forecast, by Application 2019 & 2032
- Table 25: Rest of North America RTD Protein Industry Revenue (Million) Forecast, by Application 2019 & 2032
- Table 26: Rest of North America RTD Protein Industry Volume (Billion) Forecast, by Application 2019 & 2032
- Table 27: Global RTD Protein Industry Revenue Million Forecast, by Source 2019 & 2032
- Table 28: Global RTD Protein Industry Volume Billion Forecast, by Source 2019 & 2032
- Table 29: Global RTD Protein Industry Revenue Million Forecast, by Type of Packaging 2019 & 2032
- Table 30: Global RTD Protein Industry Volume Billion Forecast, by Type of Packaging 2019 & 2032
- Table 31: Global RTD Protein Industry Revenue Million Forecast, by Distribution Channel 2019 & 2032
- Table 32: Global RTD Protein Industry Volume Billion Forecast, by Distribution Channel 2019 & 2032
- Table 33: Global RTD Protein Industry Revenue Million Forecast, by Country 2019 & 2032
- Table 34: Global RTD Protein Industry Volume Billion Forecast, by Country 2019 & 2032
- Table 35: Germany RTD Protein Industry Revenue (Million) Forecast, by Application 2019 & 2032
- Table 36: Germany RTD Protein Industry Volume (Billion) Forecast, by Application 2019 & 2032
- Table 37: United Kingdom RTD Protein Industry Revenue (Million) Forecast, by Application 2019 & 2032
- Table 38: United Kingdom RTD Protein Industry Volume (Billion) Forecast, by Application 2019 & 2032
- Table 39: France RTD Protein Industry Revenue (Million) Forecast, by Application 2019 & 2032
- Table 40: France RTD Protein Industry Volume (Billion) Forecast, by Application 2019 & 2032
- Table 41: Spain RTD Protein Industry Revenue (Million) Forecast, by Application 2019 & 2032
- Table 42: Spain RTD Protein Industry Volume (Billion) Forecast, by Application 2019 & 2032
- Table 43: Italy RTD Protein Industry Revenue (Million) Forecast, by Application 2019 & 2032
- Table 44: Italy RTD Protein Industry Volume (Billion) Forecast, by Application 2019 & 2032
- Table 45: Russia RTD Protein Industry Revenue (Million) Forecast, by Application 2019 & 2032
- Table 46: Russia RTD Protein Industry Volume (Billion) Forecast, by Application 2019 & 2032
- Table 47: Rest of Europe RTD Protein Industry Revenue (Million) Forecast, by Application 2019 & 2032
- Table 48: Rest of Europe RTD Protein Industry Volume (Billion) Forecast, by Application 2019 & 2032
- Table 49: Global RTD Protein Industry Revenue Million Forecast, by Source 2019 & 2032
- Table 50: Global RTD Protein Industry Volume Billion Forecast, by Source 2019 & 2032
- Table 51: Global RTD Protein Industry Revenue Million Forecast, by Type of Packaging 2019 & 2032
- Table 52: Global RTD Protein Industry Volume Billion Forecast, by Type of Packaging 2019 & 2032
- Table 53: Global RTD Protein Industry Revenue Million Forecast, by Distribution Channel 2019 & 2032
- Table 54: Global RTD Protein Industry Volume Billion Forecast, by Distribution Channel 2019 & 2032
- Table 55: Global RTD Protein Industry Revenue Million Forecast, by Country 2019 & 2032
- Table 56: Global RTD Protein Industry Volume Billion Forecast, by Country 2019 & 2032
- Table 57: China RTD Protein Industry Revenue (Million) Forecast, by Application 2019 & 2032
- Table 58: China RTD Protein Industry Volume (Billion) Forecast, by Application 2019 & 2032
- Table 59: Japan RTD Protein Industry Revenue (Million) Forecast, by Application 2019 & 2032
- Table 60: Japan RTD Protein Industry Volume (Billion) Forecast, by Application 2019 & 2032
- Table 61: India RTD Protein Industry Revenue (Million) Forecast, by Application 2019 & 2032
- Table 62: India RTD Protein Industry Volume (Billion) Forecast, by Application 2019 & 2032
- Table 63: Australia RTD Protein Industry Revenue (Million) Forecast, by Application 2019 & 2032
- Table 64: Australia RTD Protein Industry Volume (Billion) Forecast, by Application 2019 & 2032
- Table 65: Rest of Asia Pacific RTD Protein Industry Revenue (Million) Forecast, by Application 2019 & 2032
- Table 66: Rest of Asia Pacific RTD Protein Industry Volume (Billion) Forecast, by Application 2019 & 2032
- Table 67: Global RTD Protein Industry Revenue Million Forecast, by Source 2019 & 2032
- Table 68: Global RTD Protein Industry Volume Billion Forecast, by Source 2019 & 2032
- Table 69: Global RTD Protein Industry Revenue Million Forecast, by Type of Packaging 2019 & 2032
- Table 70: Global RTD Protein Industry Volume Billion Forecast, by Type of Packaging 2019 & 2032
- Table 71: Global RTD Protein Industry Revenue Million Forecast, by Distribution Channel 2019 & 2032
- Table 72: Global RTD Protein Industry Volume Billion Forecast, by Distribution Channel 2019 & 2032
- Table 73: Global RTD Protein Industry Revenue Million Forecast, by Country 2019 & 2032
- Table 74: Global RTD Protein Industry Volume Billion Forecast, by Country 2019 & 2032
- Table 75: Brazil RTD Protein Industry Revenue (Million) Forecast, by Application 2019 & 2032
- Table 76: Brazil RTD Protein Industry Volume (Billion) Forecast, by Application 2019 & 2032
- Table 77: Argentina RTD Protein Industry Revenue (Million) Forecast, by Application 2019 & 2032
- Table 78: Argentina RTD Protein Industry Volume (Billion) Forecast, by Application 2019 & 2032
- Table 79: Rest of South America RTD Protein Industry Revenue (Million) Forecast, by Application 2019 & 2032
- Table 80: Rest of South America RTD Protein Industry Volume (Billion) Forecast, by Application 2019 & 2032
- Table 81: Global RTD Protein Industry Revenue Million Forecast, by Source 2019 & 2032
- Table 82: Global RTD Protein Industry Volume Billion Forecast, by Source 2019 & 2032
- Table 83: Global RTD Protein Industry Revenue Million Forecast, by Type of Packaging 2019 & 2032
- Table 84: Global RTD Protein Industry Volume Billion Forecast, by Type of Packaging 2019 & 2032
- Table 85: Global RTD Protein Industry Revenue Million Forecast, by Distribution Channel 2019 & 2032
- Table 86: Global RTD Protein Industry Volume Billion Forecast, by Distribution Channel 2019 & 2032
- Table 87: Global RTD Protein Industry Revenue Million Forecast, by Country 2019 & 2032
- Table 88: Global RTD Protein Industry Volume Billion Forecast, by Country 2019 & 2032
- Table 89: South Africa RTD Protein Industry Revenue (Million) Forecast, by Application 2019 & 2032
- Table 90: South Africa RTD Protein Industry Volume (Billion) Forecast, by Application 2019 & 2032
- Table 91: United Arab Emirates RTD Protein Industry Revenue (Million) Forecast, by Application 2019 & 2032
- Table 92: United Arab Emirates RTD Protein Industry Volume (Billion) Forecast, by Application 2019 & 2032
- Table 93: Rest of Middle East and Africa RTD Protein Industry Revenue (Million) Forecast, by Application 2019 & 2032
- Table 94: Rest of Middle East and Africa RTD Protein Industry Volume (Billion) Forecast, by Application 2019 & 2032
Frequently Asked Questions
1. What is the projected Compound Annual Growth Rate (CAGR) of the RTD Protein Industry?
The projected CAGR is approximately 7.72%.
2. Which companies are prominent players in the RTD Protein Industry?
Key companies in the market include Kellogg Company, Glanbia PLC, PepsiCo Inc, Halen Brands, Post Holdings Inc, Koia, Abbott Nutrition, Labrada Nutrition, The Coca Cola Company, Pure Protein*List Not Exhaustive.
3. What are the main segments of the RTD Protein Industry?
The market segments include Source, Type of Packaging, Distribution Channel.
4. Can you provide details about the market size?
The market size is estimated to be USD 1.68 Million as of 2022.
5. What are some drivers contributing to market growth?
N/A
6. What are the notable trends driving market growth?
Strong Demand from Health Conscious Consumers.
7. Are there any restraints impacting market growth?
N/A
8. Can you provide examples of recent developments in the market?
March 2022: QNT SA and Qimia Makmal Arad Company entered a partnership. Qimia is authorized in Iran to distribute QNT's functional foods, supplements, and sports nutrition products.
9. What pricing options are available for accessing the report?
Pricing options include single-user, multi-user, and enterprise licenses priced at USD 4750, USD 5250, and USD 8750 respectively.
10. Is the market size provided in terms of value or volume?
The market size is provided in terms of value, measured in Million and volume, measured in Billion.
11. Are there any specific market keywords associated with the report?
Yes, the market keyword associated with the report is "RTD Protein Industry," which aids in identifying and referencing the specific market segment covered.
12. How do I determine which pricing option suits my needs best?
The pricing options vary based on user requirements and access needs. Individual users may opt for single-user licenses, while businesses requiring broader access may choose multi-user or enterprise licenses for cost-effective access to the report.
13. Are there any additional resources or data provided in the RTD Protein Industry report?
While the report offers comprehensive insights, it's advisable to review the specific contents or supplementary materials provided to ascertain if additional resources or data are available.
14. How can I stay updated on further developments or reports in the RTD Protein Industry?
To stay informed about further developments, trends, and reports in the RTD Protein Industry, consider subscribing to industry newsletters, following relevant companies and organizations, or regularly checking reputable industry news sources and publications.
Methodology
Step 1 - Identification of Relevant Samples Size from Population Database


Step 2 - Approaches for Defining Global Market Size (Value, Volume* & Price*)

Note*: In applicable scenarios
Step 3 - Data Sources
Primary Research
- Web Analytics
- Survey Reports
- Research Institute
- Latest Research Reports
- Opinion Leaders
Secondary Research
- Annual Reports
- White Paper
- Latest Press Release
- Industry Association
- Paid Database
- Investor Presentations

Step 4 - Data Triangulation
Involves using different sources of information in order to increase the validity of a study
These sources are likely to be stakeholders in a program - participants, other researchers, program staff, other community members, and so on.
Then we put all data in single framework & apply various statistical tools to find out the dynamic on the market.
During the analysis stage, feedback from the stakeholder groups would be compared to determine areas of agreement as well as areas of divergence


