
Key Insights
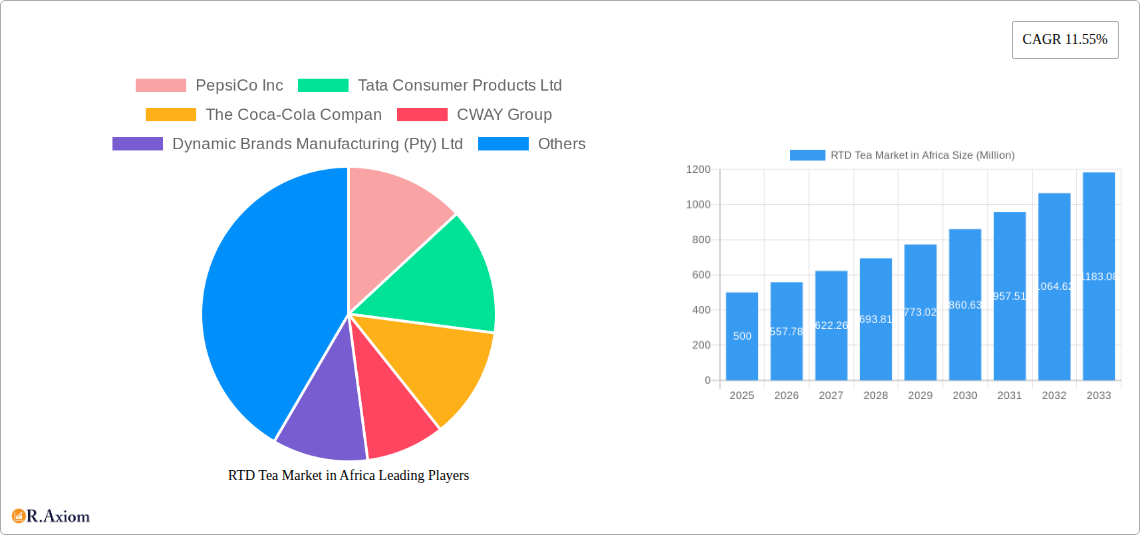
The Ready-to-Drink (RTD) tea market in Africa is experiencing robust growth, projected to expand significantly over the forecast period of 2025-2033. Driven by increasing consumer demand for convenient and healthier beverage options, the market is witnessing a surge in popularity, particularly among younger demographics. The rising disposable incomes across several African nations, coupled with the growing awareness of the health benefits associated with tea consumption, are key catalysts for this expansion. Growth is fueled by diverse product offerings, including green tea, herbal tea, and iced tea variations, catering to evolving consumer preferences. The market is segmented by distribution channels (off-trade and on-trade) and packaging types (aseptic packages, glass bottles, metal cans, and PET bottles), with PET bottles currently dominating due to their cost-effectiveness and convenience. Key players like PepsiCo, Tata Consumer Products, and Coca-Cola are actively investing in the region, further stimulating market growth through product innovation and expansion of their distribution networks. While challenges such as fluctuating raw material prices and inconsistent infrastructure in certain regions exist, the overall market outlook remains positive.
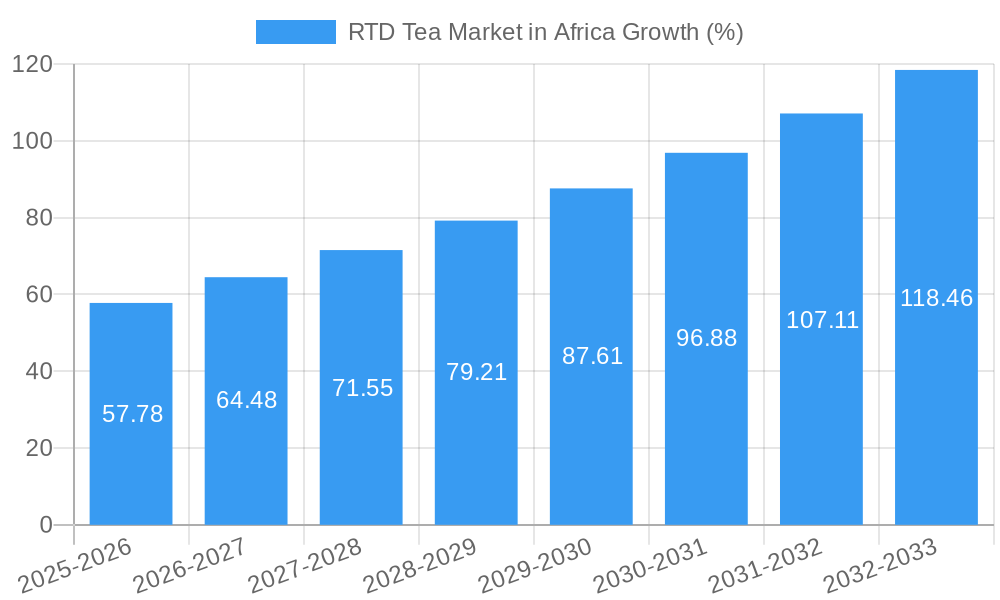
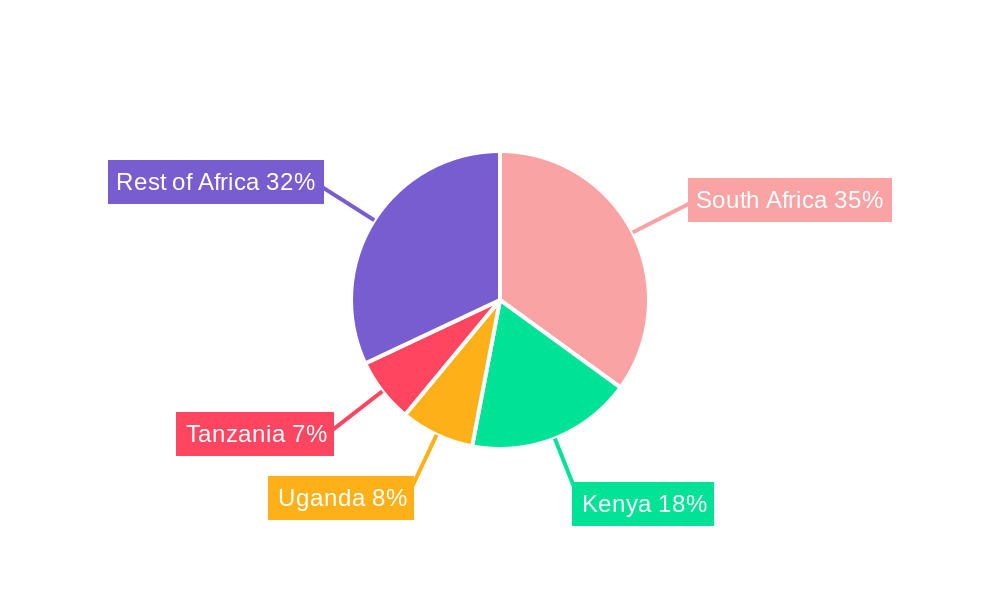
The specific regional performance varies, with South Africa, Kenya, and other East African nations exhibiting faster growth rates due to higher consumer spending and increasing urbanization. The dominance of established multinational beverage companies underscores the competitive landscape, but also presents opportunities for smaller, local brands focusing on unique product formulations and regional tastes. Continued investment in infrastructure and marketing strategies will be crucial for maximizing market penetration and achieving sustained growth. The market is expected to maintain a Compound Annual Growth Rate (CAGR) of approximately 11.55% from 2025 to 2033. While precise market sizing data for 2025 is unavailable, based on the provided 11.55% CAGR and a logical extrapolation from historical data and considering the market dynamics discussed above, we can estimate that market size will continue its substantial growth. This projection takes into account potential changes in consumer behavior, competitive dynamics, and economic factors within the forecast period.
RTD Tea Market in Africa: A Comprehensive Market Report (2019-2033)
This detailed report provides a comprehensive analysis of the Ready-to-Drink (RTD) tea market in Africa, covering the period 2019-2033. It offers in-depth insights into market size, segmentation, growth drivers, challenges, and key players, equipping stakeholders with actionable intelligence for strategic decision-making. The report utilizes data from the historical period (2019-2024), the base year (2025), and forecasts the market's trajectory through the estimated year (2025) and forecast period (2025-2033).
RTD Tea Market in Africa Market Concentration & Innovation
The African RTD tea market exhibits a moderately concentrated landscape, dominated by multinational players like PepsiCo Inc, The Coca-Cola Company, and Tata Consumer Products Ltd. These companies leverage extensive distribution networks and established brands to maintain significant market share, estimated at xx% collectively in 2025. However, regional players like CWAY Group, Dynamic Brands Manufacturing (Pty) Ltd, Clover S A (Pty) Ltd, and BOS Brands (Pty) Ltd are actively challenging this dominance through localized product offerings and innovative marketing strategies. Market share fluctuations are influenced by factors such as product innovation, consumer preferences, and pricing strategies. The total market value of M&A activities in the RTD tea sector in Africa between 2019 and 2024 is estimated at xx Million.
- Innovation Drivers: Product diversification (e.g., functional teas, flavored varieties), sustainable packaging solutions (e.g., recyclable PET bottles), and health and wellness positioning are key innovation drivers.
- Regulatory Framework: Varying regulations across African nations concerning food and beverage standards, labeling requirements, and taxation impact market dynamics.
- Product Substitutes: Other beverages, including carbonated soft drinks, juices, and bottled water, pose significant competition.
- End-User Trends: Growing health consciousness, increasing disposable incomes in urban areas, and changing lifestyle preferences contribute to RTD tea's growing appeal.
- M&A Activities: Strategic acquisitions and mergers are expected to continue shaping the market landscape, enhancing market consolidation.
RTD Tea Market in Africa Industry Trends & Insights
The African RTD tea market is experiencing robust growth, driven by several key factors. The Compound Annual Growth Rate (CAGR) is projected at xx% during the forecast period (2025-2033). Market penetration remains relatively low compared to other regions, presenting significant untapped potential. Rising disposable incomes, particularly in urban centers, fuel increasing demand for convenient and refreshing beverages. A growing preference for healthier alternatives to sugary drinks is also boosting the market's growth. Technological advancements, such as improved packaging and efficient distribution networks, are further enhancing market expansion. Competitive intensity is high, with both multinational and regional players vying for market share through product innovation and aggressive marketing campaigns. Consumer preferences are significantly influenced by taste, affordability, and brand recognition. The market is gradually shifting towards healthier options, with a rising preference for low-sugar and functional teas.
Dominant Markets & Segments in RTD Tea Market in Africa
While precise market share data for each segment is unavailable, South Africa, Nigeria, and Kenya are anticipated to be the leading markets in the African RTD tea market due to their significant populations, developed economies, and established distribution networks.
- Dominant Distribution Channel: Off-trade channels (retail stores, supermarkets) hold a larger market share than on-trade (restaurants, cafes) due to wider reach and accessibility.
- Dominant Packaging Type: PET bottles dominate due to cost-effectiveness and convenience, followed by aseptic packages, reflecting a preference for longer shelf life.
- Dominant Soft Drink Type: Iced tea currently holds the largest segment, followed by other RTD teas, which encompasses a diverse range of herbal and functional blends.
Key Drivers:
- Economic Growth: Rising disposable incomes in major urban centers stimulate consumer spending on premium beverages.
- Infrastructure Development: Improved logistics and supply chain infrastructure enhance distribution efficiency.
- Government Policies: Supportive government policies and regulations can promote industry growth.
RTD Tea Market in Africa Product Developments
Recent product innovations focus on healthier formulations, diverse flavors catering to local preferences, and convenient packaging. Companies are increasingly introducing low-sugar, organic, and functional teas enriched with vitamins or antioxidants. Technological advancements, such as improved aseptic packaging techniques ensuring longer shelf life and maintaining quality, enhance the product appeal. The introduction of innovative packaging materials that emphasize sustainability and environmental friendliness further strengthens the market appeal.
Report Scope & Segmentation Analysis
This report segments the African RTD tea market based on distribution channels (off-trade, on-trade), packaging types (aseptic packages, glass bottles, metal cans, PET bottles), and soft drink types (green tea, herbal tea, iced tea, other RTD tea). Each segment's market size, growth projections, and competitive dynamics are analyzed to provide a holistic market understanding. For instance, the PET bottle segment is projected to witness significant growth due to its affordability and convenience. The iced tea segment is expected to remain the largest, followed by other RTD tea variants.
Key Drivers of RTD Tea Market in Africa Growth
The RTD tea market in Africa benefits from various growth catalysts:
- Rising Disposable Incomes: Increased purchasing power fuels demand for premium beverages.
- Health and Wellness Trends: Growing awareness of health benefits associated with tea consumption drives product demand.
- Technological Advancements: Efficient packaging and distribution systems improve product availability.
Challenges in the RTD Tea Market in Africa Sector
Several challenges hinder the market's growth:
- Infrastructure Deficiencies: Limited cold chain infrastructure in some regions affects product quality and distribution.
- Fluctuating Raw Material Prices: Changes in tea leaf prices can impact production costs and profitability.
- Intense Competition: The presence of numerous players, both local and international, creates competitive pressure.
Emerging Opportunities in RTD Tea Market in Africa
Several promising opportunities exist:
- Untapped Market Potential: Significant growth potential lies in penetrating underserved regions.
- Premiumization: Demand for high-quality, specialized teas, including functional and organic varieties, is rising.
- E-commerce Growth: Online sales channels offer new market access and distribution channels.
Leading Players in the RTD Tea Market in Africa Market
- PepsiCo Inc
- Tata Consumer Products Ltd
- The Coca-Cola Company
- CWAY Group
- Dynamic Brands Manufacturing (Pty) Ltd
- Clover S A (Pty) Ltd
- BOS Brands (Pty) Ltd
Key Developments in RTD Tea Market in Africa Industry
- February 2021: BOS Brands launched a direct-to-consumer subscription service, boosting brand engagement and sales.
- January 2021: Clover S.A. expanded its Manhattan Ice Tea range with new Rooibos flavors, catering to diverse consumer preferences.
- February 2019: BOS Brands introduced unsweetened iced tea variants, responding to health-conscious consumer demand.
Strategic Outlook for RTD Tea Market in Africa Market
The African RTD tea market presents significant growth potential driven by expanding urbanization, rising disposable incomes, and changing consumer preferences. Focusing on product innovation, sustainable packaging, targeted marketing strategies, and effective distribution channels will be crucial for sustained success. Companies that successfully adapt to the unique market dynamics and consumer needs in diverse African nations will gain a strong competitive advantage.
RTD Tea Market in Africa Segmentation
-
1. Soft Drink Type
- 1.1. Green Tea
- 1.2. Herbal Tea
- 1.3. Iced Tea
- 1.4. Other RTD Tea
-
2. Packaging Type
- 2.1. Aseptic packages
- 2.2. Glass Bottles
- 2.3. Metal Can
- 2.4. PET Bottles
-
3. Distribution Channel
-
3.1. Off-trade
- 3.1.1. Convenience Stores
- 3.1.2. Online Retail
- 3.1.3. Supermarket/Hypermarket
- 3.1.4. Others
- 3.2. On-trade
-
3.1. Off-trade
RTD Tea Market in Africa Segmentation By Geography
-
1. North America
- 1.1. United States
- 1.2. Canada
- 1.3. Mexico
-
2. South America
- 2.1. Brazil
- 2.2. Argentina
- 2.3. Rest of South America
-
3. Europe
- 3.1. United Kingdom
- 3.2. Germany
- 3.3. France
- 3.4. Italy
- 3.5. Spain
- 3.6. Russia
- 3.7. Benelux
- 3.8. Nordics
- 3.9. Rest of Europe
-
4. Middle East & Africa
- 4.1. Turkey
- 4.2. Israel
- 4.3. GCC
- 4.4. North Africa
- 4.5. South Africa
- 4.6. Rest of Middle East & Africa
-
5. Asia Pacific
- 5.1. China
- 5.2. India
- 5.3. Japan
- 5.4. South Korea
- 5.5. ASEAN
- 5.6. Oceania
- 5.7. Rest of Asia Pacific
RTD Tea Market in Africa REPORT HIGHLIGHTS
| Aspects | Details |
|---|---|
| Study Period | 2019-2033 |
| Base Year | 2024 |
| Estimated Year | 2025 |
| Forecast Period | 2025-2033 |
| Historical Period | 2019-2024 |
| Growth Rate | CAGR of 11.55% from 2019-2033 |
| Segmentation |
|
Table of Contents
- 1. Introduction
- 1.1. Research Scope
- 1.2. Market Segmentation
- 1.3. Research Methodology
- 1.4. Definitions and Assumptions
- 2. Executive Summary
- 2.1. Introduction
- 3. Market Dynamics
- 3.1. Introduction
- 3.2. Market Drivers
- 3.2.1. Increasing Demand for Protein-Rich Food; Increasing Demand for Plant-Based and Organic Ingredients
- 3.3. Market Restrains
- 3.3.1. Presence of Counterfeit Products
- 3.4. Market Trends
- 3.4.1. OTHER KEY INDUSTRY TRENDS COVERED IN THE REPORT
- 4. Market Factor Analysis
- 4.1. Porters Five Forces
- 4.2. Supply/Value Chain
- 4.3. PESTEL analysis
- 4.4. Market Entropy
- 4.5. Patent/Trademark Analysis
- 5. Global RTD Tea Market in Africa Analysis, Insights and Forecast, 2019-2031
- 5.1. Market Analysis, Insights and Forecast - by Soft Drink Type
- 5.1.1. Green Tea
- 5.1.2. Herbal Tea
- 5.1.3. Iced Tea
- 5.1.4. Other RTD Tea
- 5.2. Market Analysis, Insights and Forecast - by Packaging Type
- 5.2.1. Aseptic packages
- 5.2.2. Glass Bottles
- 5.2.3. Metal Can
- 5.2.4. PET Bottles
- 5.3. Market Analysis, Insights and Forecast - by Distribution Channel
- 5.3.1. Off-trade
- 5.3.1.1. Convenience Stores
- 5.3.1.2. Online Retail
- 5.3.1.3. Supermarket/Hypermarket
- 5.3.1.4. Others
- 5.3.2. On-trade
- 5.3.1. Off-trade
- 5.4. Market Analysis, Insights and Forecast - by Region
- 5.4.1. North America
- 5.4.2. South America
- 5.4.3. Europe
- 5.4.4. Middle East & Africa
- 5.4.5. Asia Pacific
- 5.1. Market Analysis, Insights and Forecast - by Soft Drink Type
- 6. North America RTD Tea Market in Africa Analysis, Insights and Forecast, 2019-2031
- 6.1. Market Analysis, Insights and Forecast - by Soft Drink Type
- 6.1.1. Green Tea
- 6.1.2. Herbal Tea
- 6.1.3. Iced Tea
- 6.1.4. Other RTD Tea
- 6.2. Market Analysis, Insights and Forecast - by Packaging Type
- 6.2.1. Aseptic packages
- 6.2.2. Glass Bottles
- 6.2.3. Metal Can
- 6.2.4. PET Bottles
- 6.3. Market Analysis, Insights and Forecast - by Distribution Channel
- 6.3.1. Off-trade
- 6.3.1.1. Convenience Stores
- 6.3.1.2. Online Retail
- 6.3.1.3. Supermarket/Hypermarket
- 6.3.1.4. Others
- 6.3.2. On-trade
- 6.3.1. Off-trade
- 6.1. Market Analysis, Insights and Forecast - by Soft Drink Type
- 7. South America RTD Tea Market in Africa Analysis, Insights and Forecast, 2019-2031
- 7.1. Market Analysis, Insights and Forecast - by Soft Drink Type
- 7.1.1. Green Tea
- 7.1.2. Herbal Tea
- 7.1.3. Iced Tea
- 7.1.4. Other RTD Tea
- 7.2. Market Analysis, Insights and Forecast - by Packaging Type
- 7.2.1. Aseptic packages
- 7.2.2. Glass Bottles
- 7.2.3. Metal Can
- 7.2.4. PET Bottles
- 7.3. Market Analysis, Insights and Forecast - by Distribution Channel
- 7.3.1. Off-trade
- 7.3.1.1. Convenience Stores
- 7.3.1.2. Online Retail
- 7.3.1.3. Supermarket/Hypermarket
- 7.3.1.4. Others
- 7.3.2. On-trade
- 7.3.1. Off-trade
- 7.1. Market Analysis, Insights and Forecast - by Soft Drink Type
- 8. Europe RTD Tea Market in Africa Analysis, Insights and Forecast, 2019-2031
- 8.1. Market Analysis, Insights and Forecast - by Soft Drink Type
- 8.1.1. Green Tea
- 8.1.2. Herbal Tea
- 8.1.3. Iced Tea
- 8.1.4. Other RTD Tea
- 8.2. Market Analysis, Insights and Forecast - by Packaging Type
- 8.2.1. Aseptic packages
- 8.2.2. Glass Bottles
- 8.2.3. Metal Can
- 8.2.4. PET Bottles
- 8.3. Market Analysis, Insights and Forecast - by Distribution Channel
- 8.3.1. Off-trade
- 8.3.1.1. Convenience Stores
- 8.3.1.2. Online Retail
- 8.3.1.3. Supermarket/Hypermarket
- 8.3.1.4. Others
- 8.3.2. On-trade
- 8.3.1. Off-trade
- 8.1. Market Analysis, Insights and Forecast - by Soft Drink Type
- 9. Middle East & Africa RTD Tea Market in Africa Analysis, Insights and Forecast, 2019-2031
- 9.1. Market Analysis, Insights and Forecast - by Soft Drink Type
- 9.1.1. Green Tea
- 9.1.2. Herbal Tea
- 9.1.3. Iced Tea
- 9.1.4. Other RTD Tea
- 9.2. Market Analysis, Insights and Forecast - by Packaging Type
- 9.2.1. Aseptic packages
- 9.2.2. Glass Bottles
- 9.2.3. Metal Can
- 9.2.4. PET Bottles
- 9.3. Market Analysis, Insights and Forecast - by Distribution Channel
- 9.3.1. Off-trade
- 9.3.1.1. Convenience Stores
- 9.3.1.2. Online Retail
- 9.3.1.3. Supermarket/Hypermarket
- 9.3.1.4. Others
- 9.3.2. On-trade
- 9.3.1. Off-trade
- 9.1. Market Analysis, Insights and Forecast - by Soft Drink Type
- 10. Asia Pacific RTD Tea Market in Africa Analysis, Insights and Forecast, 2019-2031
- 10.1. Market Analysis, Insights and Forecast - by Soft Drink Type
- 10.1.1. Green Tea
- 10.1.2. Herbal Tea
- 10.1.3. Iced Tea
- 10.1.4. Other RTD Tea
- 10.2. Market Analysis, Insights and Forecast - by Packaging Type
- 10.2.1. Aseptic packages
- 10.2.2. Glass Bottles
- 10.2.3. Metal Can
- 10.2.4. PET Bottles
- 10.3. Market Analysis, Insights and Forecast - by Distribution Channel
- 10.3.1. Off-trade
- 10.3.1.1. Convenience Stores
- 10.3.1.2. Online Retail
- 10.3.1.3. Supermarket/Hypermarket
- 10.3.1.4. Others
- 10.3.2. On-trade
- 10.3.1. Off-trade
- 10.1. Market Analysis, Insights and Forecast - by Soft Drink Type
- 11. South Africa RTD Tea Market in Africa Analysis, Insights and Forecast, 2019-2031
- 12. Sudan RTD Tea Market in Africa Analysis, Insights and Forecast, 2019-2031
- 13. Uganda RTD Tea Market in Africa Analysis, Insights and Forecast, 2019-2031
- 14. Tanzania RTD Tea Market in Africa Analysis, Insights and Forecast, 2019-2031
- 15. Kenya RTD Tea Market in Africa Analysis, Insights and Forecast, 2019-2031
- 16. Rest of Africa RTD Tea Market in Africa Analysis, Insights and Forecast, 2019-2031
- 17. Competitive Analysis
- 17.1. Global Market Share Analysis 2024
- 17.2. Company Profiles
- 17.2.1 PepsiCo Inc
- 17.2.1.1. Overview
- 17.2.1.2. Products
- 17.2.1.3. SWOT Analysis
- 17.2.1.4. Recent Developments
- 17.2.1.5. Financials (Based on Availability)
- 17.2.2 Tata Consumer Products Ltd
- 17.2.2.1. Overview
- 17.2.2.2. Products
- 17.2.2.3. SWOT Analysis
- 17.2.2.4. Recent Developments
- 17.2.2.5. Financials (Based on Availability)
- 17.2.3 The Coca-Cola Compan
- 17.2.3.1. Overview
- 17.2.3.2. Products
- 17.2.3.3. SWOT Analysis
- 17.2.3.4. Recent Developments
- 17.2.3.5. Financials (Based on Availability)
- 17.2.4 CWAY Group
- 17.2.4.1. Overview
- 17.2.4.2. Products
- 17.2.4.3. SWOT Analysis
- 17.2.4.4. Recent Developments
- 17.2.4.5. Financials (Based on Availability)
- 17.2.5 Dynamic Brands Manufacturing (Pty) Ltd
- 17.2.5.1. Overview
- 17.2.5.2. Products
- 17.2.5.3. SWOT Analysis
- 17.2.5.4. Recent Developments
- 17.2.5.5. Financials (Based on Availability)
- 17.2.6 Clover S A (Pty) Ltd
- 17.2.6.1. Overview
- 17.2.6.2. Products
- 17.2.6.3. SWOT Analysis
- 17.2.6.4. Recent Developments
- 17.2.6.5. Financials (Based on Availability)
- 17.2.7 BOS Brands (Pty) Ltd
- 17.2.7.1. Overview
- 17.2.7.2. Products
- 17.2.7.3. SWOT Analysis
- 17.2.7.4. Recent Developments
- 17.2.7.5. Financials (Based on Availability)
- 17.2.1 PepsiCo Inc
List of Figures
- Figure 1: Global RTD Tea Market in Africa Revenue Breakdown (Million, %) by Region 2024 & 2032
- Figure 2: Global RTD Tea Market in Africa Volume Breakdown (K Tons, %) by Region 2024 & 2032
- Figure 3: Africa RTD Tea Market in Africa Revenue (Million), by Country 2024 & 2032
- Figure 4: Africa RTD Tea Market in Africa Volume (K Tons), by Country 2024 & 2032
- Figure 5: Africa RTD Tea Market in Africa Revenue Share (%), by Country 2024 & 2032
- Figure 6: Africa RTD Tea Market in Africa Volume Share (%), by Country 2024 & 2032
- Figure 7: North America RTD Tea Market in Africa Revenue (Million), by Soft Drink Type 2024 & 2032
- Figure 8: North America RTD Tea Market in Africa Volume (K Tons), by Soft Drink Type 2024 & 2032
- Figure 9: North America RTD Tea Market in Africa Revenue Share (%), by Soft Drink Type 2024 & 2032
- Figure 10: North America RTD Tea Market in Africa Volume Share (%), by Soft Drink Type 2024 & 2032
- Figure 11: North America RTD Tea Market in Africa Revenue (Million), by Packaging Type 2024 & 2032
- Figure 12: North America RTD Tea Market in Africa Volume (K Tons), by Packaging Type 2024 & 2032
- Figure 13: North America RTD Tea Market in Africa Revenue Share (%), by Packaging Type 2024 & 2032
- Figure 14: North America RTD Tea Market in Africa Volume Share (%), by Packaging Type 2024 & 2032
- Figure 15: North America RTD Tea Market in Africa Revenue (Million), by Distribution Channel 2024 & 2032
- Figure 16: North America RTD Tea Market in Africa Volume (K Tons), by Distribution Channel 2024 & 2032
- Figure 17: North America RTD Tea Market in Africa Revenue Share (%), by Distribution Channel 2024 & 2032
- Figure 18: North America RTD Tea Market in Africa Volume Share (%), by Distribution Channel 2024 & 2032
- Figure 19: North America RTD Tea Market in Africa Revenue (Million), by Country 2024 & 2032
- Figure 20: North America RTD Tea Market in Africa Volume (K Tons), by Country 2024 & 2032
- Figure 21: North America RTD Tea Market in Africa Revenue Share (%), by Country 2024 & 2032
- Figure 22: North America RTD Tea Market in Africa Volume Share (%), by Country 2024 & 2032
- Figure 23: South America RTD Tea Market in Africa Revenue (Million), by Soft Drink Type 2024 & 2032
- Figure 24: South America RTD Tea Market in Africa Volume (K Tons), by Soft Drink Type 2024 & 2032
- Figure 25: South America RTD Tea Market in Africa Revenue Share (%), by Soft Drink Type 2024 & 2032
- Figure 26: South America RTD Tea Market in Africa Volume Share (%), by Soft Drink Type 2024 & 2032
- Figure 27: South America RTD Tea Market in Africa Revenue (Million), by Packaging Type 2024 & 2032
- Figure 28: South America RTD Tea Market in Africa Volume (K Tons), by Packaging Type 2024 & 2032
- Figure 29: South America RTD Tea Market in Africa Revenue Share (%), by Packaging Type 2024 & 2032
- Figure 30: South America RTD Tea Market in Africa Volume Share (%), by Packaging Type 2024 & 2032
- Figure 31: South America RTD Tea Market in Africa Revenue (Million), by Distribution Channel 2024 & 2032
- Figure 32: South America RTD Tea Market in Africa Volume (K Tons), by Distribution Channel 2024 & 2032
- Figure 33: South America RTD Tea Market in Africa Revenue Share (%), by Distribution Channel 2024 & 2032
- Figure 34: South America RTD Tea Market in Africa Volume Share (%), by Distribution Channel 2024 & 2032
- Figure 35: South America RTD Tea Market in Africa Revenue (Million), by Country 2024 & 2032
- Figure 36: South America RTD Tea Market in Africa Volume (K Tons), by Country 2024 & 2032
- Figure 37: South America RTD Tea Market in Africa Revenue Share (%), by Country 2024 & 2032
- Figure 38: South America RTD Tea Market in Africa Volume Share (%), by Country 2024 & 2032
- Figure 39: Europe RTD Tea Market in Africa Revenue (Million), by Soft Drink Type 2024 & 2032
- Figure 40: Europe RTD Tea Market in Africa Volume (K Tons), by Soft Drink Type 2024 & 2032
- Figure 41: Europe RTD Tea Market in Africa Revenue Share (%), by Soft Drink Type 2024 & 2032
- Figure 42: Europe RTD Tea Market in Africa Volume Share (%), by Soft Drink Type 2024 & 2032
- Figure 43: Europe RTD Tea Market in Africa Revenue (Million), by Packaging Type 2024 & 2032
- Figure 44: Europe RTD Tea Market in Africa Volume (K Tons), by Packaging Type 2024 & 2032
- Figure 45: Europe RTD Tea Market in Africa Revenue Share (%), by Packaging Type 2024 & 2032
- Figure 46: Europe RTD Tea Market in Africa Volume Share (%), by Packaging Type 2024 & 2032
- Figure 47: Europe RTD Tea Market in Africa Revenue (Million), by Distribution Channel 2024 & 2032
- Figure 48: Europe RTD Tea Market in Africa Volume (K Tons), by Distribution Channel 2024 & 2032
- Figure 49: Europe RTD Tea Market in Africa Revenue Share (%), by Distribution Channel 2024 & 2032
- Figure 50: Europe RTD Tea Market in Africa Volume Share (%), by Distribution Channel 2024 & 2032
- Figure 51: Europe RTD Tea Market in Africa Revenue (Million), by Country 2024 & 2032
- Figure 52: Europe RTD Tea Market in Africa Volume (K Tons), by Country 2024 & 2032
- Figure 53: Europe RTD Tea Market in Africa Revenue Share (%), by Country 2024 & 2032
- Figure 54: Europe RTD Tea Market in Africa Volume Share (%), by Country 2024 & 2032
- Figure 55: Middle East & Africa RTD Tea Market in Africa Revenue (Million), by Soft Drink Type 2024 & 2032
- Figure 56: Middle East & Africa RTD Tea Market in Africa Volume (K Tons), by Soft Drink Type 2024 & 2032
- Figure 57: Middle East & Africa RTD Tea Market in Africa Revenue Share (%), by Soft Drink Type 2024 & 2032
- Figure 58: Middle East & Africa RTD Tea Market in Africa Volume Share (%), by Soft Drink Type 2024 & 2032
- Figure 59: Middle East & Africa RTD Tea Market in Africa Revenue (Million), by Packaging Type 2024 & 2032
- Figure 60: Middle East & Africa RTD Tea Market in Africa Volume (K Tons), by Packaging Type 2024 & 2032
- Figure 61: Middle East & Africa RTD Tea Market in Africa Revenue Share (%), by Packaging Type 2024 & 2032
- Figure 62: Middle East & Africa RTD Tea Market in Africa Volume Share (%), by Packaging Type 2024 & 2032
- Figure 63: Middle East & Africa RTD Tea Market in Africa Revenue (Million), by Distribution Channel 2024 & 2032
- Figure 64: Middle East & Africa RTD Tea Market in Africa Volume (K Tons), by Distribution Channel 2024 & 2032
- Figure 65: Middle East & Africa RTD Tea Market in Africa Revenue Share (%), by Distribution Channel 2024 & 2032
- Figure 66: Middle East & Africa RTD Tea Market in Africa Volume Share (%), by Distribution Channel 2024 & 2032
- Figure 67: Middle East & Africa RTD Tea Market in Africa Revenue (Million), by Country 2024 & 2032
- Figure 68: Middle East & Africa RTD Tea Market in Africa Volume (K Tons), by Country 2024 & 2032
- Figure 69: Middle East & Africa RTD Tea Market in Africa Revenue Share (%), by Country 2024 & 2032
- Figure 70: Middle East & Africa RTD Tea Market in Africa Volume Share (%), by Country 2024 & 2032
- Figure 71: Asia Pacific RTD Tea Market in Africa Revenue (Million), by Soft Drink Type 2024 & 2032
- Figure 72: Asia Pacific RTD Tea Market in Africa Volume (K Tons), by Soft Drink Type 2024 & 2032
- Figure 73: Asia Pacific RTD Tea Market in Africa Revenue Share (%), by Soft Drink Type 2024 & 2032
- Figure 74: Asia Pacific RTD Tea Market in Africa Volume Share (%), by Soft Drink Type 2024 & 2032
- Figure 75: Asia Pacific RTD Tea Market in Africa Revenue (Million), by Packaging Type 2024 & 2032
- Figure 76: Asia Pacific RTD Tea Market in Africa Volume (K Tons), by Packaging Type 2024 & 2032
- Figure 77: Asia Pacific RTD Tea Market in Africa Revenue Share (%), by Packaging Type 2024 & 2032
- Figure 78: Asia Pacific RTD Tea Market in Africa Volume Share (%), by Packaging Type 2024 & 2032
- Figure 79: Asia Pacific RTD Tea Market in Africa Revenue (Million), by Distribution Channel 2024 & 2032
- Figure 80: Asia Pacific RTD Tea Market in Africa Volume (K Tons), by Distribution Channel 2024 & 2032
- Figure 81: Asia Pacific RTD Tea Market in Africa Revenue Share (%), by Distribution Channel 2024 & 2032
- Figure 82: Asia Pacific RTD Tea Market in Africa Volume Share (%), by Distribution Channel 2024 & 2032
- Figure 83: Asia Pacific RTD Tea Market in Africa Revenue (Million), by Country 2024 & 2032
- Figure 84: Asia Pacific RTD Tea Market in Africa Volume (K Tons), by Country 2024 & 2032
- Figure 85: Asia Pacific RTD Tea Market in Africa Revenue Share (%), by Country 2024 & 2032
- Figure 86: Asia Pacific RTD Tea Market in Africa Volume Share (%), by Country 2024 & 2032
List of Tables
- Table 1: Global RTD Tea Market in Africa Revenue Million Forecast, by Region 2019 & 2032
- Table 2: Global RTD Tea Market in Africa Volume K Tons Forecast, by Region 2019 & 2032
- Table 3: Global RTD Tea Market in Africa Revenue Million Forecast, by Soft Drink Type 2019 & 2032
- Table 4: Global RTD Tea Market in Africa Volume K Tons Forecast, by Soft Drink Type 2019 & 2032
- Table 5: Global RTD Tea Market in Africa Revenue Million Forecast, by Packaging Type 2019 & 2032
- Table 6: Global RTD Tea Market in Africa Volume K Tons Forecast, by Packaging Type 2019 & 2032
- Table 7: Global RTD Tea Market in Africa Revenue Million Forecast, by Distribution Channel 2019 & 2032
- Table 8: Global RTD Tea Market in Africa Volume K Tons Forecast, by Distribution Channel 2019 & 2032
- Table 9: Global RTD Tea Market in Africa Revenue Million Forecast, by Region 2019 & 2032
- Table 10: Global RTD Tea Market in Africa Volume K Tons Forecast, by Region 2019 & 2032
- Table 11: Global RTD Tea Market in Africa Revenue Million Forecast, by Country 2019 & 2032
- Table 12: Global RTD Tea Market in Africa Volume K Tons Forecast, by Country 2019 & 2032
- Table 13: South Africa RTD Tea Market in Africa Revenue (Million) Forecast, by Application 2019 & 2032
- Table 14: South Africa RTD Tea Market in Africa Volume (K Tons) Forecast, by Application 2019 & 2032
- Table 15: Sudan RTD Tea Market in Africa Revenue (Million) Forecast, by Application 2019 & 2032
- Table 16: Sudan RTD Tea Market in Africa Volume (K Tons) Forecast, by Application 2019 & 2032
- Table 17: Uganda RTD Tea Market in Africa Revenue (Million) Forecast, by Application 2019 & 2032
- Table 18: Uganda RTD Tea Market in Africa Volume (K Tons) Forecast, by Application 2019 & 2032
- Table 19: Tanzania RTD Tea Market in Africa Revenue (Million) Forecast, by Application 2019 & 2032
- Table 20: Tanzania RTD Tea Market in Africa Volume (K Tons) Forecast, by Application 2019 & 2032
- Table 21: Kenya RTD Tea Market in Africa Revenue (Million) Forecast, by Application 2019 & 2032
- Table 22: Kenya RTD Tea Market in Africa Volume (K Tons) Forecast, by Application 2019 & 2032
- Table 23: Rest of Africa RTD Tea Market in Africa Revenue (Million) Forecast, by Application 2019 & 2032
- Table 24: Rest of Africa RTD Tea Market in Africa Volume (K Tons) Forecast, by Application 2019 & 2032
- Table 25: Global RTD Tea Market in Africa Revenue Million Forecast, by Soft Drink Type 2019 & 2032
- Table 26: Global RTD Tea Market in Africa Volume K Tons Forecast, by Soft Drink Type 2019 & 2032
- Table 27: Global RTD Tea Market in Africa Revenue Million Forecast, by Packaging Type 2019 & 2032
- Table 28: Global RTD Tea Market in Africa Volume K Tons Forecast, by Packaging Type 2019 & 2032
- Table 29: Global RTD Tea Market in Africa Revenue Million Forecast, by Distribution Channel 2019 & 2032
- Table 30: Global RTD Tea Market in Africa Volume K Tons Forecast, by Distribution Channel 2019 & 2032
- Table 31: Global RTD Tea Market in Africa Revenue Million Forecast, by Country 2019 & 2032
- Table 32: Global RTD Tea Market in Africa Volume K Tons Forecast, by Country 2019 & 2032
- Table 33: United States RTD Tea Market in Africa Revenue (Million) Forecast, by Application 2019 & 2032
- Table 34: United States RTD Tea Market in Africa Volume (K Tons) Forecast, by Application 2019 & 2032
- Table 35: Canada RTD Tea Market in Africa Revenue (Million) Forecast, by Application 2019 & 2032
- Table 36: Canada RTD Tea Market in Africa Volume (K Tons) Forecast, by Application 2019 & 2032
- Table 37: Mexico RTD Tea Market in Africa Revenue (Million) Forecast, by Application 2019 & 2032
- Table 38: Mexico RTD Tea Market in Africa Volume (K Tons) Forecast, by Application 2019 & 2032
- Table 39: Global RTD Tea Market in Africa Revenue Million Forecast, by Soft Drink Type 2019 & 2032
- Table 40: Global RTD Tea Market in Africa Volume K Tons Forecast, by Soft Drink Type 2019 & 2032
- Table 41: Global RTD Tea Market in Africa Revenue Million Forecast, by Packaging Type 2019 & 2032
- Table 42: Global RTD Tea Market in Africa Volume K Tons Forecast, by Packaging Type 2019 & 2032
- Table 43: Global RTD Tea Market in Africa Revenue Million Forecast, by Distribution Channel 2019 & 2032
- Table 44: Global RTD Tea Market in Africa Volume K Tons Forecast, by Distribution Channel 2019 & 2032
- Table 45: Global RTD Tea Market in Africa Revenue Million Forecast, by Country 2019 & 2032
- Table 46: Global RTD Tea Market in Africa Volume K Tons Forecast, by Country 2019 & 2032
- Table 47: Brazil RTD Tea Market in Africa Revenue (Million) Forecast, by Application 2019 & 2032
- Table 48: Brazil RTD Tea Market in Africa Volume (K Tons) Forecast, by Application 2019 & 2032
- Table 49: Argentina RTD Tea Market in Africa Revenue (Million) Forecast, by Application 2019 & 2032
- Table 50: Argentina RTD Tea Market in Africa Volume (K Tons) Forecast, by Application 2019 & 2032
- Table 51: Rest of South America RTD Tea Market in Africa Revenue (Million) Forecast, by Application 2019 & 2032
- Table 52: Rest of South America RTD Tea Market in Africa Volume (K Tons) Forecast, by Application 2019 & 2032
- Table 53: Global RTD Tea Market in Africa Revenue Million Forecast, by Soft Drink Type 2019 & 2032
- Table 54: Global RTD Tea Market in Africa Volume K Tons Forecast, by Soft Drink Type 2019 & 2032
- Table 55: Global RTD Tea Market in Africa Revenue Million Forecast, by Packaging Type 2019 & 2032
- Table 56: Global RTD Tea Market in Africa Volume K Tons Forecast, by Packaging Type 2019 & 2032
- Table 57: Global RTD Tea Market in Africa Revenue Million Forecast, by Distribution Channel 2019 & 2032
- Table 58: Global RTD Tea Market in Africa Volume K Tons Forecast, by Distribution Channel 2019 & 2032
- Table 59: Global RTD Tea Market in Africa Revenue Million Forecast, by Country 2019 & 2032
- Table 60: Global RTD Tea Market in Africa Volume K Tons Forecast, by Country 2019 & 2032
- Table 61: United Kingdom RTD Tea Market in Africa Revenue (Million) Forecast, by Application 2019 & 2032
- Table 62: United Kingdom RTD Tea Market in Africa Volume (K Tons) Forecast, by Application 2019 & 2032
- Table 63: Germany RTD Tea Market in Africa Revenue (Million) Forecast, by Application 2019 & 2032
- Table 64: Germany RTD Tea Market in Africa Volume (K Tons) Forecast, by Application 2019 & 2032
- Table 65: France RTD Tea Market in Africa Revenue (Million) Forecast, by Application 2019 & 2032
- Table 66: France RTD Tea Market in Africa Volume (K Tons) Forecast, by Application 2019 & 2032
- Table 67: Italy RTD Tea Market in Africa Revenue (Million) Forecast, by Application 2019 & 2032
- Table 68: Italy RTD Tea Market in Africa Volume (K Tons) Forecast, by Application 2019 & 2032
- Table 69: Spain RTD Tea Market in Africa Revenue (Million) Forecast, by Application 2019 & 2032
- Table 70: Spain RTD Tea Market in Africa Volume (K Tons) Forecast, by Application 2019 & 2032
- Table 71: Russia RTD Tea Market in Africa Revenue (Million) Forecast, by Application 2019 & 2032
- Table 72: Russia RTD Tea Market in Africa Volume (K Tons) Forecast, by Application 2019 & 2032
- Table 73: Benelux RTD Tea Market in Africa Revenue (Million) Forecast, by Application 2019 & 2032
- Table 74: Benelux RTD Tea Market in Africa Volume (K Tons) Forecast, by Application 2019 & 2032
- Table 75: Nordics RTD Tea Market in Africa Revenue (Million) Forecast, by Application 2019 & 2032
- Table 76: Nordics RTD Tea Market in Africa Volume (K Tons) Forecast, by Application 2019 & 2032
- Table 77: Rest of Europe RTD Tea Market in Africa Revenue (Million) Forecast, by Application 2019 & 2032
- Table 78: Rest of Europe RTD Tea Market in Africa Volume (K Tons) Forecast, by Application 2019 & 2032
- Table 79: Global RTD Tea Market in Africa Revenue Million Forecast, by Soft Drink Type 2019 & 2032
- Table 80: Global RTD Tea Market in Africa Volume K Tons Forecast, by Soft Drink Type 2019 & 2032
- Table 81: Global RTD Tea Market in Africa Revenue Million Forecast, by Packaging Type 2019 & 2032
- Table 82: Global RTD Tea Market in Africa Volume K Tons Forecast, by Packaging Type 2019 & 2032
- Table 83: Global RTD Tea Market in Africa Revenue Million Forecast, by Distribution Channel 2019 & 2032
- Table 84: Global RTD Tea Market in Africa Volume K Tons Forecast, by Distribution Channel 2019 & 2032
- Table 85: Global RTD Tea Market in Africa Revenue Million Forecast, by Country 2019 & 2032
- Table 86: Global RTD Tea Market in Africa Volume K Tons Forecast, by Country 2019 & 2032
- Table 87: Turkey RTD Tea Market in Africa Revenue (Million) Forecast, by Application 2019 & 2032
- Table 88: Turkey RTD Tea Market in Africa Volume (K Tons) Forecast, by Application 2019 & 2032
- Table 89: Israel RTD Tea Market in Africa Revenue (Million) Forecast, by Application 2019 & 2032
- Table 90: Israel RTD Tea Market in Africa Volume (K Tons) Forecast, by Application 2019 & 2032
- Table 91: GCC RTD Tea Market in Africa Revenue (Million) Forecast, by Application 2019 & 2032
- Table 92: GCC RTD Tea Market in Africa Volume (K Tons) Forecast, by Application 2019 & 2032
- Table 93: North Africa RTD Tea Market in Africa Revenue (Million) Forecast, by Application 2019 & 2032
- Table 94: North Africa RTD Tea Market in Africa Volume (K Tons) Forecast, by Application 2019 & 2032
- Table 95: South Africa RTD Tea Market in Africa Revenue (Million) Forecast, by Application 2019 & 2032
- Table 96: South Africa RTD Tea Market in Africa Volume (K Tons) Forecast, by Application 2019 & 2032
- Table 97: Rest of Middle East & Africa RTD Tea Market in Africa Revenue (Million) Forecast, by Application 2019 & 2032
- Table 98: Rest of Middle East & Africa RTD Tea Market in Africa Volume (K Tons) Forecast, by Application 2019 & 2032
- Table 99: Global RTD Tea Market in Africa Revenue Million Forecast, by Soft Drink Type 2019 & 2032
- Table 100: Global RTD Tea Market in Africa Volume K Tons Forecast, by Soft Drink Type 2019 & 2032
- Table 101: Global RTD Tea Market in Africa Revenue Million Forecast, by Packaging Type 2019 & 2032
- Table 102: Global RTD Tea Market in Africa Volume K Tons Forecast, by Packaging Type 2019 & 2032
- Table 103: Global RTD Tea Market in Africa Revenue Million Forecast, by Distribution Channel 2019 & 2032
- Table 104: Global RTD Tea Market in Africa Volume K Tons Forecast, by Distribution Channel 2019 & 2032
- Table 105: Global RTD Tea Market in Africa Revenue Million Forecast, by Country 2019 & 2032
- Table 106: Global RTD Tea Market in Africa Volume K Tons Forecast, by Country 2019 & 2032
- Table 107: China RTD Tea Market in Africa Revenue (Million) Forecast, by Application 2019 & 2032
- Table 108: China RTD Tea Market in Africa Volume (K Tons) Forecast, by Application 2019 & 2032
- Table 109: India RTD Tea Market in Africa Revenue (Million) Forecast, by Application 2019 & 2032
- Table 110: India RTD Tea Market in Africa Volume (K Tons) Forecast, by Application 2019 & 2032
- Table 111: Japan RTD Tea Market in Africa Revenue (Million) Forecast, by Application 2019 & 2032
- Table 112: Japan RTD Tea Market in Africa Volume (K Tons) Forecast, by Application 2019 & 2032
- Table 113: South Korea RTD Tea Market in Africa Revenue (Million) Forecast, by Application 2019 & 2032
- Table 114: South Korea RTD Tea Market in Africa Volume (K Tons) Forecast, by Application 2019 & 2032
- Table 115: ASEAN RTD Tea Market in Africa Revenue (Million) Forecast, by Application 2019 & 2032
- Table 116: ASEAN RTD Tea Market in Africa Volume (K Tons) Forecast, by Application 2019 & 2032
- Table 117: Oceania RTD Tea Market in Africa Revenue (Million) Forecast, by Application 2019 & 2032
- Table 118: Oceania RTD Tea Market in Africa Volume (K Tons) Forecast, by Application 2019 & 2032
- Table 119: Rest of Asia Pacific RTD Tea Market in Africa Revenue (Million) Forecast, by Application 2019 & 2032
- Table 120: Rest of Asia Pacific RTD Tea Market in Africa Volume (K Tons) Forecast, by Application 2019 & 2032
Frequently Asked Questions
1. What is the projected Compound Annual Growth Rate (CAGR) of the RTD Tea Market in Africa?
The projected CAGR is approximately 11.55%.
2. Which companies are prominent players in the RTD Tea Market in Africa?
Key companies in the market include PepsiCo Inc, Tata Consumer Products Ltd, The Coca-Cola Compan, CWAY Group, Dynamic Brands Manufacturing (Pty) Ltd, Clover S A (Pty) Ltd, BOS Brands (Pty) Ltd.
3. What are the main segments of the RTD Tea Market in Africa?
The market segments include Soft Drink Type, Packaging Type, Distribution Channel.
4. Can you provide details about the market size?
The market size is estimated to be USD XX Million as of 2022.
5. What are some drivers contributing to market growth?
Increasing Demand for Protein-Rich Food; Increasing Demand for Plant-Based and Organic Ingredients.
6. What are the notable trends driving market growth?
OTHER KEY INDUSTRY TRENDS COVERED IN THE REPORT.
7. Are there any restraints impacting market growth?
Presence of Counterfeit Products.
8. Can you provide examples of recent developments in the market?
February 2021: BOS Brands ramped up its direct-toconsumer offerings, through a new subscription service. This service makes BOS products available to consumers directly from the brand, and at a discounted rate for monthly orders.January 2021: Manhattan Ice Tea, a brand under Clover S.A. launched a new range of Rooibos RTD Tea products. This new range includes two new rooibos RTD Tea products, which are available in Lemon and Mixed Berry flavours.These products contain mineral water, fructose, sugar, citric acid, rooibos tea extract, acidity regulators, flavouring, preservatives, and colourants, as well sweeteners.February 2019: BOS Brands (Pty) Ltd launched unsweetened iced tea in three flavors such as blueberry and jasmine, white peach and elderflower, and pineapple and coconut.
9. What pricing options are available for accessing the report?
Pricing options include single-user, multi-user, and enterprise licenses priced at USD 3800, USD 4500, and USD 5800 respectively.
10. Is the market size provided in terms of value or volume?
The market size is provided in terms of value, measured in Million and volume, measured in K Tons.
11. Are there any specific market keywords associated with the report?
Yes, the market keyword associated with the report is "RTD Tea Market in Africa," which aids in identifying and referencing the specific market segment covered.
12. How do I determine which pricing option suits my needs best?
The pricing options vary based on user requirements and access needs. Individual users may opt for single-user licenses, while businesses requiring broader access may choose multi-user or enterprise licenses for cost-effective access to the report.
13. Are there any additional resources or data provided in the RTD Tea Market in Africa report?
While the report offers comprehensive insights, it's advisable to review the specific contents or supplementary materials provided to ascertain if additional resources or data are available.
14. How can I stay updated on further developments or reports in the RTD Tea Market in Africa?
To stay informed about further developments, trends, and reports in the RTD Tea Market in Africa, consider subscribing to industry newsletters, following relevant companies and organizations, or regularly checking reputable industry news sources and publications.
Methodology
Step 1 - Identification of Relevant Samples Size from Population Database


Step 2 - Approaches for Defining Global Market Size (Value, Volume* & Price*)

Note*: In applicable scenarios
Step 3 - Data Sources
Primary Research
- Web Analytics
- Survey Reports
- Research Institute
- Latest Research Reports
- Opinion Leaders
Secondary Research
- Annual Reports
- White Paper
- Latest Press Release
- Industry Association
- Paid Database
- Investor Presentations

Step 4 - Data Triangulation
Involves using different sources of information in order to increase the validity of a study
These sources are likely to be stakeholders in a program - participants, other researchers, program staff, other community members, and so on.
Then we put all data in single framework & apply various statistical tools to find out the dynamic on the market.
During the analysis stage, feedback from the stakeholder groups would be compared to determine areas of agreement as well as areas of divergence


