
Key Insights
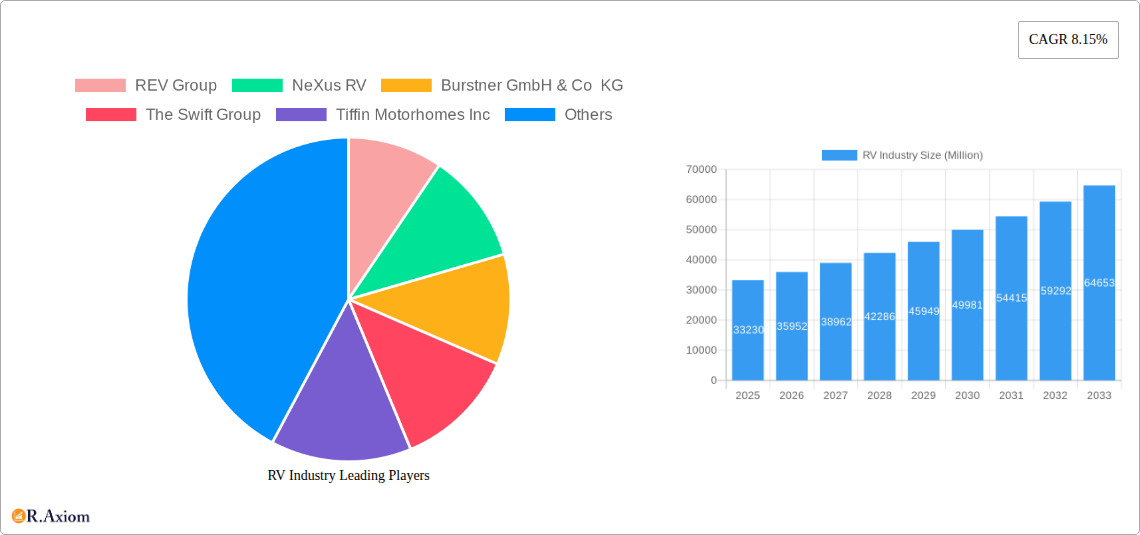
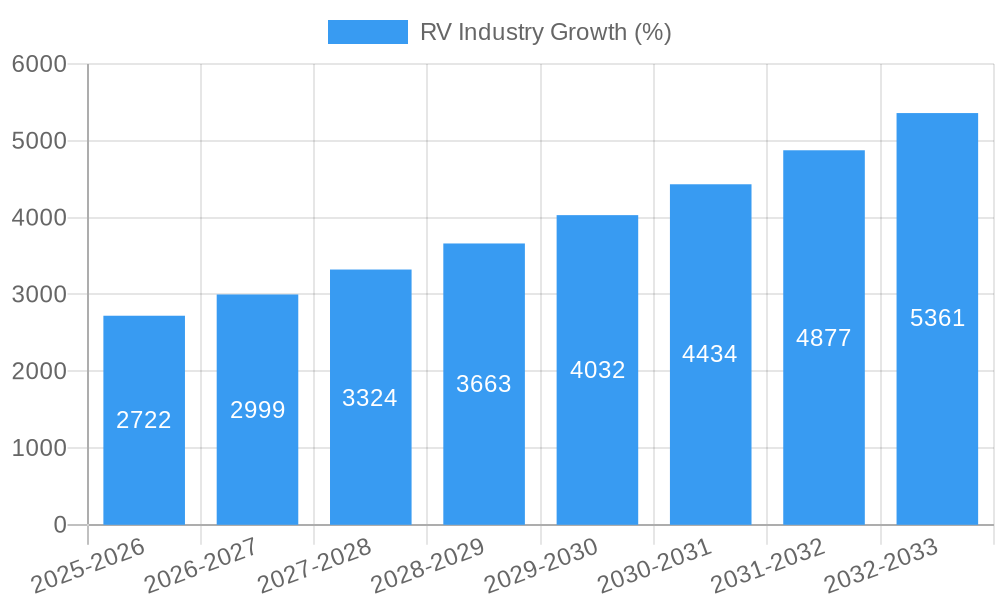
The global RV (Recreational Vehicle) industry, valued at $33.23 billion in 2025, is projected to experience robust growth, exhibiting a Compound Annual Growth Rate (CAGR) of 8.15% from 2025 to 2033. This expansion is driven by several key factors. Increased disposable incomes, particularly in developed nations, fuel demand for leisure travel and outdoor recreation, making RVs an attractive option for both short getaways and extended vacations. The rising popularity of "van life" and glamping contributes to a younger demographic embracing the RV lifestyle. Furthermore, advancements in RV technology, such as improved fuel efficiency, enhanced comfort features, and integration of smart home technologies, are enhancing the overall RV ownership experience. The industry is also witnessing a shift towards sustainable and eco-friendly RVs, catering to environmentally conscious consumers. However, challenges remain, including the rising cost of raw materials and fluctuations in fuel prices, which could impact affordability. Government regulations concerning emissions and environmental impact also pose potential restraints. Segment-wise, motorhomes are expected to maintain a significant market share, driven by their enhanced comfort and amenities. The North American market, particularly the United States, is predicted to remain the largest regional contributor due to established infrastructure and a strong culture of RV travel. Competition among established players like Thor Industries, Winnebago Industries, and REV Group, alongside the emergence of innovative startups, is likely to intensify.
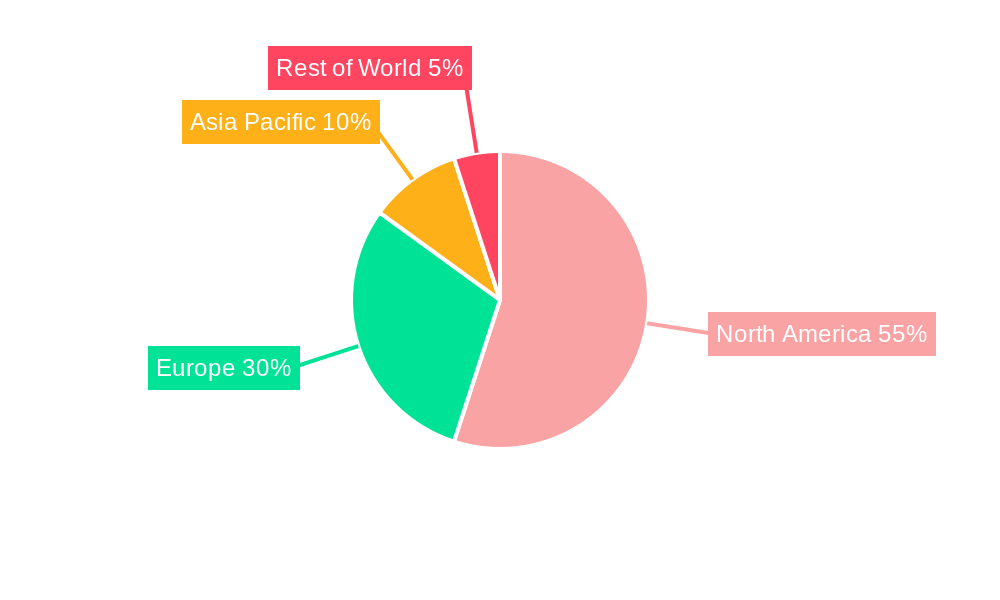
The forecast period (2025-2033) indicates a continuous expansion of the RV market. Regional variations will exist, with North America and Europe remaining dominant, while the Asia-Pacific region is expected to showcase significant growth potential, fueled by rising middle-class incomes and a growing interest in outdoor activities. The segmental breakdown will continue to reflect consumer preferences, with the balance between towable RVs and motorhomes evolving as technological advancements and evolving lifestyle choices shape consumer demand. The industry's success hinges on adapting to changing consumer preferences, effectively managing supply chain challenges, and proactively responding to regulatory changes while maintaining a focus on innovation and sustainability.
RV Industry Market Analysis: 2019-2033
This comprehensive report provides an in-depth analysis of the RV industry, encompassing market size, segmentation, key players, trends, and future growth prospects. The study period covers 2019-2033, with 2025 as the base and estimated year. The report uses a Million USD value for all figures. This report is crucial for investors, manufacturers, suppliers, and anyone seeking to understand the dynamics of this dynamic market.
RV Industry Market Concentration & Innovation
The RV industry exhibits a moderately concentrated market structure, with a few major players controlling a significant portion of the global market share. Thor Industries Inc., Winnebago Industries Inc., and Forest River Inc. are among the leading players, collectively accounting for an estimated xx% of the global market in 2024. Smaller players, such as REV Group, NeXus RV, Burstner GmbH & Co KG, The Swift Group, Tiffin Motorhomes Inc, Dethleffs GmbH & Co KG, Triple E Recreational Vehicles, and Rapido Motorhome, cater to niche segments or regional markets.
Market Concentration Metrics (2024 Estimates):
- Thor Industries Inc.: xx% Market Share
- Winnebago Industries Inc.: xx% Market Share
- Forest River Inc.: xx% Market Share
- Others: xx% Market Share
Innovation Drivers:
- Increasing demand for lightweight and fuel-efficient RVs.
- Growing adoption of advanced technologies like electric powertrains and smart home integrations.
- Focus on sustainable and eco-friendly RV manufacturing practices.
Regulatory Frameworks:
- Emission regulations and fuel efficiency standards are driving innovation in RV technology.
- Safety standards and regulations influence RV design and manufacturing processes.
Product Substitutes:
- Traditional camping and alternative travel options pose a competitive threat to RV adoption.
End-User Trends:
- Growing demand for luxury and customized RVs.
- Increasing preference for outdoor recreational activities.
M&A Activities:
Over the past five years, the industry has witnessed several mergers and acquisitions, with deal values totaling an estimated xx Million USD. These activities have helped consolidate market share and drive innovation. Examples include (but are not limited to) xx acquisitions involving smaller players by larger companies.
RV Industry Industry Trends & Insights
The global RV industry is experiencing significant growth, driven by several factors. The compound annual growth rate (CAGR) for the period 2025-2033 is projected to be xx%, reaching an estimated market value of xx Million USD by 2033. This growth is fueled by several key trends:
- Rising Disposable Incomes and Leisure Time: Increased disposable incomes and a growing desire for experiential travel are driving demand for RVs.
- Technological Advancements: Innovations in RV technology, such as electric powertrains and smart home features, are enhancing the RV ownership experience and attracting new buyers.
- Changing Consumer Preferences: Consumers are increasingly seeking unique and flexible travel options, leading to greater interest in RVs.
- Outdoor Recreation Boom: The growing popularity of outdoor recreation and nature-based tourism is boosting RV sales.
- E-commerce Growth: Online platforms are expanding access to RV sales and rentals.
Market penetration of RVs in developed countries is relatively high, while emerging markets present significant growth opportunities. Competition within the industry is intense, with manufacturers focusing on product differentiation and innovation to gain a competitive edge.
Dominant Markets & Segments in RV Industry
Dominant Regions:
The North American market (primarily the United States and Canada) remains the dominant region for RV sales, accounting for a significant share of the global market. This is due to strong consumer demand, well-established infrastructure for RV travel, and a large network of RV parks and campgrounds. European markets are also significant.
Dominant Segments:
By Type: Towable RVs (travel trailers, fifth wheels) currently represent the largest segment due to their affordability and ease of use. However, Motorhomes (Class A, B, and C) are witnessing faster growth due to their convenience and increased amenities. Truck Campers represent a smaller niche segment.
By Application: The domestic market (personal use) accounts for the majority of RV sales. However, the commercial market (rental companies, tour operators) shows promising growth potential.
Key Drivers for Dominance:
- North America: Strong consumer demand, well-developed RV infrastructure, and favorable economic conditions.
- Towable RVs: Affordability, ease of towing, and diverse range of options.
- Domestic Application: Personal use continues to be the primary driver.
RV Industry Product Developments
Recent product developments in the RV industry showcase significant strides in technology and design. Manufacturers are focusing on lightweight materials, fuel-efficient engines, and advanced safety features. The introduction of electric motorhomes, as demonstrated by Thor and Winnebago, represents a significant shift towards sustainability. Innovations like smart home integration and improved connectivity are enhancing the comfort and convenience of RV living. These developments cater to the changing demands of consumers who seek both luxury and eco-friendliness in their travel experiences.
Report Scope & Segmentation Analysis
This report segments the RV market by type and application.
By Type:
- Towable RVs: This segment includes travel trailers and fifth wheels, offering a detailed analysis of market size, growth projections, and competitive landscape. We project xx Million USD in revenue by 2033.
- Motorhomes: This segment includes Class A, B, and C motorhomes, with insights into technological advancements, market dynamics, and future trends. We forecast xx Million USD in revenue by 2033.
- Truck Campers: This niche segment is characterized by its specialized features and targeted audience. Revenue is projected to be xx Million USD by 2033.
By Application:
- Domestic: This segment comprises personal use of RVs for leisure travel and family vacations. We project xx Million USD revenue in 2033.
- Commercial: This segment includes RVs used for rentals, tours, and other commercial purposes. Growth is projected at xx Million USD by 2033.
Key Drivers of RV Industry Growth
The RV industry's growth is driven by multiple factors, including:
- Increased Disposable Incomes: Higher disposable incomes enable more people to purchase and maintain RVs.
- Technological Innovations: Advancements in electric powertrains, connectivity, and lightweight construction enhance the RV experience.
- Desire for Experiential Travel: The popularity of experiential travel and outdoor recreation fuels RV demand.
- Favorable Government Policies: Supportive government policies in some regions incentivize RV ownership.
Challenges in the RV Industry Sector
The RV industry faces several challenges, including:
- Supply Chain Disruptions: Global supply chain issues can affect the availability of components and raw materials. This has led to price increases and production delays, impacting profitability in recent years (estimated impact of xx Million USD in lost revenue).
- Economic Downturns: Economic downturns can negatively affect consumer confidence and purchasing power, reducing RV sales.
- Stringent Emission Regulations: Meeting increasingly stringent emission regulations necessitates costly technological upgrades for manufacturers.
Emerging Opportunities in RV Industry
Emerging opportunities in the RV industry include:
- Growth in Emerging Markets: Expanding into emerging markets with rising middle classes offers significant potential.
- Electric and Hybrid RVs: The transition to sustainable mobility will drive the demand for electric and hybrid RVs.
- RV Sharing Economy: The growth of peer-to-peer RV rental platforms presents new business models.
- Luxury and Customized RVs: Demand for luxury RVs and customized solutions provides an opportunity for high-value offerings.
Leading Players in the RV Industry Market
- REV Group
- NeXus RV
- Burstner GmbH & Co KG
- The Swift Group
- Tiffin Motorhomes Inc
- Thor Industries Inc
- Winnebago Industries Inc
- Dethleffs GmbH & Co KG
- Triple E Recreational Vehicles
- Rapido Motorhome
- Forest River Inc
Key Developments in RV Industry Industry
- January 2022: Thor unveiled a concept EV motorhome with a 300-mile range.
- January 2022: Winnebago Industries showcased its all-electric concept RV with a 125-mile range.
- January 2022: Thor Industries revealed its new electric Airstream concept with a ZF-sourced electric axle.
- May 2021: Forest River Inc. launched its Della Terra range of travel trailers.
These developments demonstrate a significant push towards electrification and technological advancements in the RV industry, shaping future market dynamics.
Strategic Outlook for RV Industry Market
The RV industry is poised for continued growth, driven by increasing consumer demand, technological advancements, and emerging market opportunities. The focus on sustainability, through electric powertrains and eco-friendly materials, will be a key driver of future innovation. The expansion of the RV sharing economy and the potential for further consolidation through mergers and acquisitions will also shape the industry's trajectory. The market is expected to experience robust growth over the forecast period, reaching xx Million USD in market value by 2033, presenting attractive investment opportunities for stakeholders.
RV Industry Segmentation
-
1. Type
-
1.1. Towable RVs
- 1.1.1. Travel Trailers
- 1.1.2. Fifth Wheel Trailers
- 1.1.3. Folding Camp Trailers
- 1.1.4. Truck Campers
-
1.2. Motorhomes
- 1.2.1. Type A
- 1.2.2. Type B
- 1.2.3. Type C
-
1.1. Towable RVs
-
2. Application
- 2.1. Domestic
- 2.2. Commercial
RV Industry Segmentation By Geography
-
1. North America
- 1.1. United states
- 1.2. Canada
- 1.3. Rest of North America
-
2. Europe
- 2.1. United Kingdom
- 2.2. Germany
- 2.3. France
- 2.4. Spain
- 2.5. Rest of Europe
-
3. Asia Pacific
- 3.1. China
- 3.2. India
- 3.3. Japan
- 3.4. South Korea
- 3.5. Rest of Asia Pacific
-
4. Rest of the World
- 4.1. South America
- 4.2. Middle East and Africa
RV Industry REPORT HIGHLIGHTS
| Aspects | Details |
|---|---|
| Study Period | 2019-2033 |
| Base Year | 2024 |
| Estimated Year | 2025 |
| Forecast Period | 2025-2033 |
| Historical Period | 2019-2024 |
| Growth Rate | CAGR of 8.15% from 2019-2033 |
| Segmentation |
|
Table of Contents
- 1. Introduction
- 1.1. Research Scope
- 1.2. Market Segmentation
- 1.3. Research Methodology
- 1.4. Definitions and Assumptions
- 2. Executive Summary
- 2.1. Introduction
- 3. Market Dynamics
- 3.1. Introduction
- 3.2. Market Drivers
- 3.2.1. Increasing Sales of Electric Vehicles are Expected to Drive the Market
- 3.3. Market Restrains
- 3.3.1. Lack of Infrastructure May Hamper the growth of the Market
- 3.4. Market Trends
- 3.4.1. Motorhomes Segment Expected to Lead the Market
- 4. Market Factor Analysis
- 4.1. Porters Five Forces
- 4.2. Supply/Value Chain
- 4.3. PESTEL analysis
- 4.4. Market Entropy
- 4.5. Patent/Trademark Analysis
- 5. Global RV Industry Analysis, Insights and Forecast, 2019-2031
- 5.1. Market Analysis, Insights and Forecast - by Type
- 5.1.1. Towable RVs
- 5.1.1.1. Travel Trailers
- 5.1.1.2. Fifth Wheel Trailers
- 5.1.1.3. Folding Camp Trailers
- 5.1.1.4. Truck Campers
- 5.1.2. Motorhomes
- 5.1.2.1. Type A
- 5.1.2.2. Type B
- 5.1.2.3. Type C
- 5.1.1. Towable RVs
- 5.2. Market Analysis, Insights and Forecast - by Application
- 5.2.1. Domestic
- 5.2.2. Commercial
- 5.3. Market Analysis, Insights and Forecast - by Region
- 5.3.1. North America
- 5.3.2. Europe
- 5.3.3. Asia Pacific
- 5.3.4. Rest of the World
- 5.1. Market Analysis, Insights and Forecast - by Type
- 6. North America RV Industry Analysis, Insights and Forecast, 2019-2031
- 6.1. Market Analysis, Insights and Forecast - by Type
- 6.1.1. Towable RVs
- 6.1.1.1. Travel Trailers
- 6.1.1.2. Fifth Wheel Trailers
- 6.1.1.3. Folding Camp Trailers
- 6.1.1.4. Truck Campers
- 6.1.2. Motorhomes
- 6.1.2.1. Type A
- 6.1.2.2. Type B
- 6.1.2.3. Type C
- 6.1.1. Towable RVs
- 6.2. Market Analysis, Insights and Forecast - by Application
- 6.2.1. Domestic
- 6.2.2. Commercial
- 6.1. Market Analysis, Insights and Forecast - by Type
- 7. Europe RV Industry Analysis, Insights and Forecast, 2019-2031
- 7.1. Market Analysis, Insights and Forecast - by Type
- 7.1.1. Towable RVs
- 7.1.1.1. Travel Trailers
- 7.1.1.2. Fifth Wheel Trailers
- 7.1.1.3. Folding Camp Trailers
- 7.1.1.4. Truck Campers
- 7.1.2. Motorhomes
- 7.1.2.1. Type A
- 7.1.2.2. Type B
- 7.1.2.3. Type C
- 7.1.1. Towable RVs
- 7.2. Market Analysis, Insights and Forecast - by Application
- 7.2.1. Domestic
- 7.2.2. Commercial
- 7.1. Market Analysis, Insights and Forecast - by Type
- 8. Asia Pacific RV Industry Analysis, Insights and Forecast, 2019-2031
- 8.1. Market Analysis, Insights and Forecast - by Type
- 8.1.1. Towable RVs
- 8.1.1.1. Travel Trailers
- 8.1.1.2. Fifth Wheel Trailers
- 8.1.1.3. Folding Camp Trailers
- 8.1.1.4. Truck Campers
- 8.1.2. Motorhomes
- 8.1.2.1. Type A
- 8.1.2.2. Type B
- 8.1.2.3. Type C
- 8.1.1. Towable RVs
- 8.2. Market Analysis, Insights and Forecast - by Application
- 8.2.1. Domestic
- 8.2.2. Commercial
- 8.1. Market Analysis, Insights and Forecast - by Type
- 9. Rest of the World RV Industry Analysis, Insights and Forecast, 2019-2031
- 9.1. Market Analysis, Insights and Forecast - by Type
- 9.1.1. Towable RVs
- 9.1.1.1. Travel Trailers
- 9.1.1.2. Fifth Wheel Trailers
- 9.1.1.3. Folding Camp Trailers
- 9.1.1.4. Truck Campers
- 9.1.2. Motorhomes
- 9.1.2.1. Type A
- 9.1.2.2. Type B
- 9.1.2.3. Type C
- 9.1.1. Towable RVs
- 9.2. Market Analysis, Insights and Forecast - by Application
- 9.2.1. Domestic
- 9.2.2. Commercial
- 9.1. Market Analysis, Insights and Forecast - by Type
- 10. North America RV Industry Analysis, Insights and Forecast, 2019-2031
- 10.1. Market Analysis, Insights and Forecast - By Country/Sub-region
- 10.1.1 United states
- 10.1.2 Canada
- 10.1.3 Rest of North America
- 11. Europe RV Industry Analysis, Insights and Forecast, 2019-2031
- 11.1. Market Analysis, Insights and Forecast - By Country/Sub-region
- 11.1.1 United Kingdom
- 11.1.2 Germany
- 11.1.3 France
- 11.1.4 Spain
- 11.1.5 Rest of Europe
- 12. Asia Pacific RV Industry Analysis, Insights and Forecast, 2019-2031
- 12.1. Market Analysis, Insights and Forecast - By Country/Sub-region
- 12.1.1 China
- 12.1.2 India
- 12.1.3 Japan
- 12.1.4 South Korea
- 12.1.5 Rest of Asia Pacific
- 13. Rest of the World RV Industry Analysis, Insights and Forecast, 2019-2031
- 13.1. Market Analysis, Insights and Forecast - By Country/Sub-region
- 13.1.1 South America
- 13.1.2 Middle East and Africa
- 14. Competitive Analysis
- 14.1. Global Market Share Analysis 2024
- 14.2. Company Profiles
- 14.2.1 REV Group
- 14.2.1.1. Overview
- 14.2.1.2. Products
- 14.2.1.3. SWOT Analysis
- 14.2.1.4. Recent Developments
- 14.2.1.5. Financials (Based on Availability)
- 14.2.2 NeXus RV
- 14.2.2.1. Overview
- 14.2.2.2. Products
- 14.2.2.3. SWOT Analysis
- 14.2.2.4. Recent Developments
- 14.2.2.5. Financials (Based on Availability)
- 14.2.3 Burstner GmbH & Co KG
- 14.2.3.1. Overview
- 14.2.3.2. Products
- 14.2.3.3. SWOT Analysis
- 14.2.3.4. Recent Developments
- 14.2.3.5. Financials (Based on Availability)
- 14.2.4 The Swift Group
- 14.2.4.1. Overview
- 14.2.4.2. Products
- 14.2.4.3. SWOT Analysis
- 14.2.4.4. Recent Developments
- 14.2.4.5. Financials (Based on Availability)
- 14.2.5 Tiffin Motorhomes Inc
- 14.2.5.1. Overview
- 14.2.5.2. Products
- 14.2.5.3. SWOT Analysis
- 14.2.5.4. Recent Developments
- 14.2.5.5. Financials (Based on Availability)
- 14.2.6 Thor Industries Inc
- 14.2.6.1. Overview
- 14.2.6.2. Products
- 14.2.6.3. SWOT Analysis
- 14.2.6.4. Recent Developments
- 14.2.6.5. Financials (Based on Availability)
- 14.2.7 Winnebago Industries Inc
- 14.2.7.1. Overview
- 14.2.7.2. Products
- 14.2.7.3. SWOT Analysis
- 14.2.7.4. Recent Developments
- 14.2.7.5. Financials (Based on Availability)
- 14.2.8 Dethleffs GmbH & Co KG
- 14.2.8.1. Overview
- 14.2.8.2. Products
- 14.2.8.3. SWOT Analysis
- 14.2.8.4. Recent Developments
- 14.2.8.5. Financials (Based on Availability)
- 14.2.9 Triple E Recreational Vehicles
- 14.2.9.1. Overview
- 14.2.9.2. Products
- 14.2.9.3. SWOT Analysis
- 14.2.9.4. Recent Developments
- 14.2.9.5. Financials (Based on Availability)
- 14.2.10 Rapido Motorhome
- 14.2.10.1. Overview
- 14.2.10.2. Products
- 14.2.10.3. SWOT Analysis
- 14.2.10.4. Recent Developments
- 14.2.10.5. Financials (Based on Availability)
- 14.2.11 Forest River Inc
- 14.2.11.1. Overview
- 14.2.11.2. Products
- 14.2.11.3. SWOT Analysis
- 14.2.11.4. Recent Developments
- 14.2.11.5. Financials (Based on Availability)
- 14.2.1 REV Group
List of Figures
- Figure 1: Global RV Industry Revenue Breakdown (Million, %) by Region 2024 & 2032
- Figure 2: North America RV Industry Revenue (Million), by Country 2024 & 2032
- Figure 3: North America RV Industry Revenue Share (%), by Country 2024 & 2032
- Figure 4: Europe RV Industry Revenue (Million), by Country 2024 & 2032
- Figure 5: Europe RV Industry Revenue Share (%), by Country 2024 & 2032
- Figure 6: Asia Pacific RV Industry Revenue (Million), by Country 2024 & 2032
- Figure 7: Asia Pacific RV Industry Revenue Share (%), by Country 2024 & 2032
- Figure 8: Rest of the World RV Industry Revenue (Million), by Country 2024 & 2032
- Figure 9: Rest of the World RV Industry Revenue Share (%), by Country 2024 & 2032
- Figure 10: North America RV Industry Revenue (Million), by Type 2024 & 2032
- Figure 11: North America RV Industry Revenue Share (%), by Type 2024 & 2032
- Figure 12: North America RV Industry Revenue (Million), by Application 2024 & 2032
- Figure 13: North America RV Industry Revenue Share (%), by Application 2024 & 2032
- Figure 14: North America RV Industry Revenue (Million), by Country 2024 & 2032
- Figure 15: North America RV Industry Revenue Share (%), by Country 2024 & 2032
- Figure 16: Europe RV Industry Revenue (Million), by Type 2024 & 2032
- Figure 17: Europe RV Industry Revenue Share (%), by Type 2024 & 2032
- Figure 18: Europe RV Industry Revenue (Million), by Application 2024 & 2032
- Figure 19: Europe RV Industry Revenue Share (%), by Application 2024 & 2032
- Figure 20: Europe RV Industry Revenue (Million), by Country 2024 & 2032
- Figure 21: Europe RV Industry Revenue Share (%), by Country 2024 & 2032
- Figure 22: Asia Pacific RV Industry Revenue (Million), by Type 2024 & 2032
- Figure 23: Asia Pacific RV Industry Revenue Share (%), by Type 2024 & 2032
- Figure 24: Asia Pacific RV Industry Revenue (Million), by Application 2024 & 2032
- Figure 25: Asia Pacific RV Industry Revenue Share (%), by Application 2024 & 2032
- Figure 26: Asia Pacific RV Industry Revenue (Million), by Country 2024 & 2032
- Figure 27: Asia Pacific RV Industry Revenue Share (%), by Country 2024 & 2032
- Figure 28: Rest of the World RV Industry Revenue (Million), by Type 2024 & 2032
- Figure 29: Rest of the World RV Industry Revenue Share (%), by Type 2024 & 2032
- Figure 30: Rest of the World RV Industry Revenue (Million), by Application 2024 & 2032
- Figure 31: Rest of the World RV Industry Revenue Share (%), by Application 2024 & 2032
- Figure 32: Rest of the World RV Industry Revenue (Million), by Country 2024 & 2032
- Figure 33: Rest of the World RV Industry Revenue Share (%), by Country 2024 & 2032
List of Tables
- Table 1: Global RV Industry Revenue Million Forecast, by Region 2019 & 2032
- Table 2: Global RV Industry Revenue Million Forecast, by Type 2019 & 2032
- Table 3: Global RV Industry Revenue Million Forecast, by Application 2019 & 2032
- Table 4: Global RV Industry Revenue Million Forecast, by Region 2019 & 2032
- Table 5: Global RV Industry Revenue Million Forecast, by Country 2019 & 2032
- Table 6: United states RV Industry Revenue (Million) Forecast, by Application 2019 & 2032
- Table 7: Canada RV Industry Revenue (Million) Forecast, by Application 2019 & 2032
- Table 8: Rest of North America RV Industry Revenue (Million) Forecast, by Application 2019 & 2032
- Table 9: Global RV Industry Revenue Million Forecast, by Country 2019 & 2032
- Table 10: United Kingdom RV Industry Revenue (Million) Forecast, by Application 2019 & 2032
- Table 11: Germany RV Industry Revenue (Million) Forecast, by Application 2019 & 2032
- Table 12: France RV Industry Revenue (Million) Forecast, by Application 2019 & 2032
- Table 13: Spain RV Industry Revenue (Million) Forecast, by Application 2019 & 2032
- Table 14: Rest of Europe RV Industry Revenue (Million) Forecast, by Application 2019 & 2032
- Table 15: Global RV Industry Revenue Million Forecast, by Country 2019 & 2032
- Table 16: China RV Industry Revenue (Million) Forecast, by Application 2019 & 2032
- Table 17: India RV Industry Revenue (Million) Forecast, by Application 2019 & 2032
- Table 18: Japan RV Industry Revenue (Million) Forecast, by Application 2019 & 2032
- Table 19: South Korea RV Industry Revenue (Million) Forecast, by Application 2019 & 2032
- Table 20: Rest of Asia Pacific RV Industry Revenue (Million) Forecast, by Application 2019 & 2032
- Table 21: Global RV Industry Revenue Million Forecast, by Country 2019 & 2032
- Table 22: South America RV Industry Revenue (Million) Forecast, by Application 2019 & 2032
- Table 23: Middle East and Africa RV Industry Revenue (Million) Forecast, by Application 2019 & 2032
- Table 24: Global RV Industry Revenue Million Forecast, by Type 2019 & 2032
- Table 25: Global RV Industry Revenue Million Forecast, by Application 2019 & 2032
- Table 26: Global RV Industry Revenue Million Forecast, by Country 2019 & 2032
- Table 27: United states RV Industry Revenue (Million) Forecast, by Application 2019 & 2032
- Table 28: Canada RV Industry Revenue (Million) Forecast, by Application 2019 & 2032
- Table 29: Rest of North America RV Industry Revenue (Million) Forecast, by Application 2019 & 2032
- Table 30: Global RV Industry Revenue Million Forecast, by Type 2019 & 2032
- Table 31: Global RV Industry Revenue Million Forecast, by Application 2019 & 2032
- Table 32: Global RV Industry Revenue Million Forecast, by Country 2019 & 2032
- Table 33: United Kingdom RV Industry Revenue (Million) Forecast, by Application 2019 & 2032
- Table 34: Germany RV Industry Revenue (Million) Forecast, by Application 2019 & 2032
- Table 35: France RV Industry Revenue (Million) Forecast, by Application 2019 & 2032
- Table 36: Spain RV Industry Revenue (Million) Forecast, by Application 2019 & 2032
- Table 37: Rest of Europe RV Industry Revenue (Million) Forecast, by Application 2019 & 2032
- Table 38: Global RV Industry Revenue Million Forecast, by Type 2019 & 2032
- Table 39: Global RV Industry Revenue Million Forecast, by Application 2019 & 2032
- Table 40: Global RV Industry Revenue Million Forecast, by Country 2019 & 2032
- Table 41: China RV Industry Revenue (Million) Forecast, by Application 2019 & 2032
- Table 42: India RV Industry Revenue (Million) Forecast, by Application 2019 & 2032
- Table 43: Japan RV Industry Revenue (Million) Forecast, by Application 2019 & 2032
- Table 44: South Korea RV Industry Revenue (Million) Forecast, by Application 2019 & 2032
- Table 45: Rest of Asia Pacific RV Industry Revenue (Million) Forecast, by Application 2019 & 2032
- Table 46: Global RV Industry Revenue Million Forecast, by Type 2019 & 2032
- Table 47: Global RV Industry Revenue Million Forecast, by Application 2019 & 2032
- Table 48: Global RV Industry Revenue Million Forecast, by Country 2019 & 2032
- Table 49: South America RV Industry Revenue (Million) Forecast, by Application 2019 & 2032
- Table 50: Middle East and Africa RV Industry Revenue (Million) Forecast, by Application 2019 & 2032
Frequently Asked Questions
1. What is the projected Compound Annual Growth Rate (CAGR) of the RV Industry?
The projected CAGR is approximately 8.15%.
2. Which companies are prominent players in the RV Industry?
Key companies in the market include REV Group, NeXus RV, Burstner GmbH & Co KG, The Swift Group, Tiffin Motorhomes Inc, Thor Industries Inc, Winnebago Industries Inc, Dethleffs GmbH & Co KG, Triple E Recreational Vehicles, Rapido Motorhome, Forest River Inc.
3. What are the main segments of the RV Industry?
The market segments include Type, Application.
4. Can you provide details about the market size?
The market size is estimated to be USD 33.23 Million as of 2022.
5. What are some drivers contributing to market growth?
Increasing Sales of Electric Vehicles are Expected to Drive the Market.
6. What are the notable trends driving market growth?
Motorhomes Segment Expected to Lead the Market.
7. Are there any restraints impacting market growth?
Lack of Infrastructure May Hamper the growth of the Market.
8. Can you provide examples of recent developments in the market?
In January 2022, Thor unveiled a concept E.V motorhome with 300 miles range. The company stated that shifting consumer preferences in electric cars and trucks may also portray growth paths for electric motorhomes.
9. What pricing options are available for accessing the report?
Pricing options include single-user, multi-user, and enterprise licenses priced at USD 4750, USD 5250, and USD 8750 respectively.
10. Is the market size provided in terms of value or volume?
The market size is provided in terms of value, measured in Million.
11. Are there any specific market keywords associated with the report?
Yes, the market keyword associated with the report is "RV Industry," which aids in identifying and referencing the specific market segment covered.
12. How do I determine which pricing option suits my needs best?
The pricing options vary based on user requirements and access needs. Individual users may opt for single-user licenses, while businesses requiring broader access may choose multi-user or enterprise licenses for cost-effective access to the report.
13. Are there any additional resources or data provided in the RV Industry report?
While the report offers comprehensive insights, it's advisable to review the specific contents or supplementary materials provided to ascertain if additional resources or data are available.
14. How can I stay updated on further developments or reports in the RV Industry?
To stay informed about further developments, trends, and reports in the RV Industry, consider subscribing to industry newsletters, following relevant companies and organizations, or regularly checking reputable industry news sources and publications.
Methodology
Step 1 - Identification of Relevant Samples Size from Population Database


Step 2 - Approaches for Defining Global Market Size (Value, Volume* & Price*)

Note*: In applicable scenarios
Step 3 - Data Sources
Primary Research
- Web Analytics
- Survey Reports
- Research Institute
- Latest Research Reports
- Opinion Leaders
Secondary Research
- Annual Reports
- White Paper
- Latest Press Release
- Industry Association
- Paid Database
- Investor Presentations

Step 4 - Data Triangulation
Involves using different sources of information in order to increase the validity of a study
These sources are likely to be stakeholders in a program - participants, other researchers, program staff, other community members, and so on.
Then we put all data in single framework & apply various statistical tools to find out the dynamic on the market.
During the analysis stage, feedback from the stakeholder groups would be compared to determine areas of agreement as well as areas of divergence


