
Key Insights
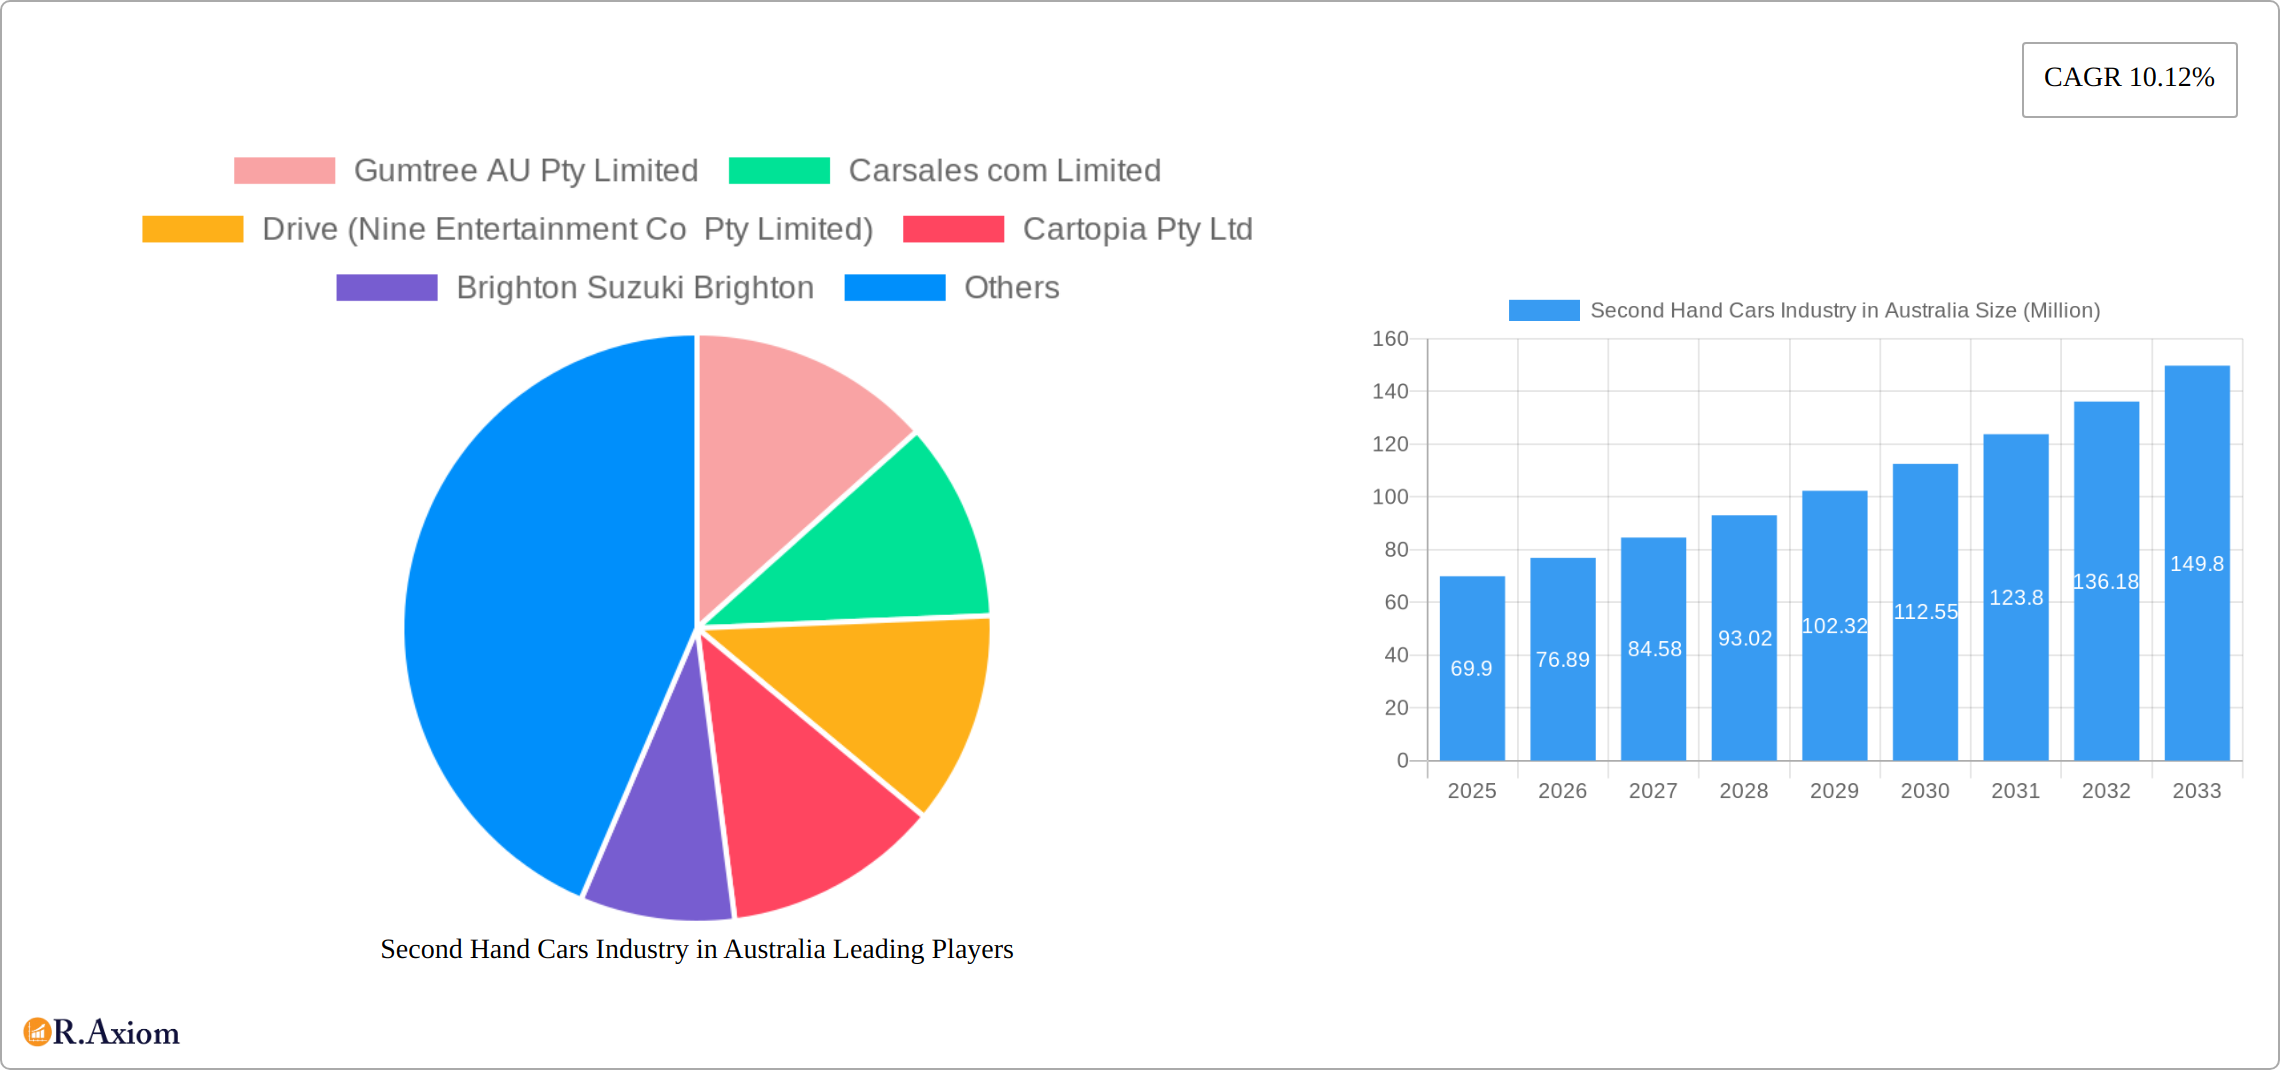
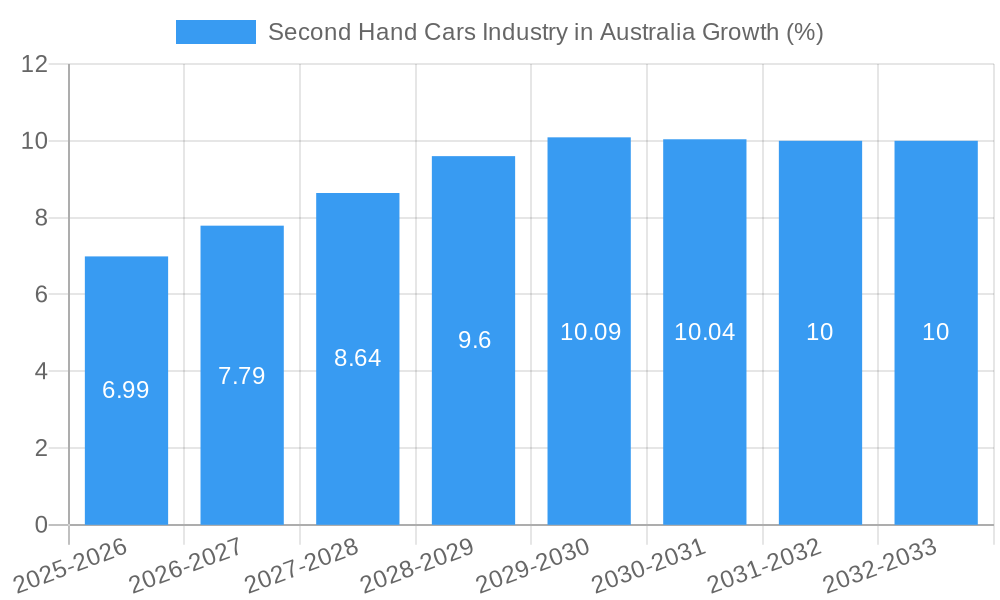
The Australian used car market, valued at $69.90 million in 2025, is experiencing robust growth, projected to expand at a Compound Annual Growth Rate (CAGR) of 10.12% from 2025 to 2033. This expansion is driven by several factors. Increasing consumer preference for pre-owned vehicles due to affordability concerns, coupled with the rising cost of new cars, is a significant contributor. Furthermore, the evolving landscape of online car sales platforms like Gumtree, Carsales, and Drive has improved accessibility and transparency, boosting market activity. The shift towards electric and hybrid vehicles is also impacting the market, creating new segments and opportunities. However, challenges remain, including concerns about vehicle reliability and the potential for fraud in the used car market. Segmentation by fuel type (petrol, diesel, electric, others), body type (hatchback, sedan, SUV, MPV), vendor type (organized, unorganized), and sales channel (online, offline) reveals diverse market dynamics. The presence of established players like Carsales and Gumtree alongside smaller dealerships and individual sellers indicates a competitive market landscape. Future growth will likely be influenced by government policies promoting sustainable transportation, technological advancements in vehicle inspection and certification, and the overall economic health of the Australian consumer.
The market's structure reveals a complex interplay of established players and emerging trends. Organized vendors, like those offering certified pre-owned vehicles from brands such as Toyota and BMW, are competing with the large online marketplaces and individual sellers in the unorganized sector. The dominance of petrol and diesel vehicles is gradually being challenged by the growing adoption of electric vehicles, albeit from a relatively small base. Effective marketing strategies, robust vehicle history reports, and consumer education on vehicle maintenance will be crucial for navigating this evolving market. The increasing preference for online sales channels suggests that digital marketing and online presence will play a critical role in the future success of used car businesses in Australia. The substantial forecast period (2025-2033) provides ample opportunity for growth and adaptation within the market.
This detailed report provides a comprehensive analysis of the Australian second-hand car market, covering market size, segmentation, key players, growth drivers, challenges, and future opportunities. The study period spans from 2019 to 2033, with 2025 serving as both the base and estimated year. The forecast period extends from 2025 to 2033, encompassing historical data from 2019 to 2024. This report is essential for industry stakeholders, investors, and businesses seeking to understand and capitalize on the dynamic second-hand car market in Australia.
Second Hand Cars Industry in Australia Market Concentration & Innovation
The Australian second-hand car market exhibits a moderately concentrated structure, with several large players holding significant market share. Carsales.com Limited and Gumtree AU Pty Limited are dominant online platforms, while established dealerships like Brighton Suzuki Brighton and others operate offline. Market share data for 2024 estimates Carsales at approximately 35%, Gumtree at 20%, and the remaining players sharing the rest. Innovation is driven by the increasing adoption of online platforms, technological advancements in vehicle inspection and valuation, and the rise of subscription services like HELLOCARS SUBSCRIPTION PTY LTD. Regulatory frameworks, including those concerning vehicle safety and emissions, significantly influence market dynamics. The emergence of electric vehicles is creating a new segment and altering consumer preferences, resulting in increased competition and the need for adaptable business models. Substitutes include public transportation and ride-sharing services. M&A activity, like the May 2023 acquisition of Albert Automotive Holdings Pty Ltd by Sojitz Corporation, indicates ongoing consolidation within the sector. The total value of M&A deals in the sector from 2019 to 2024 is estimated at xx Million.
- Key Players: Carsales.com Limited, Gumtree AU Pty Limited, Drive (Nine Entertainment Co Pty Limited), Cartopia Pty Ltd, Brighton Suzuki Brighton, Carsguide Autotrader Media Solutions Pty Ltd.
- Market Concentration: Moderately Concentrated.
- Innovation Drivers: Online platforms, technological advancements, subscription services.
- M&A Activity: Increasing consolidation; xx Million in deal value (2019-2024).
Second Hand Cars Industry in Australia Industry Trends & Insights
The Australian second-hand car market is experiencing robust growth, driven by several factors. Increasing consumer preference for used vehicles due to affordability and economic considerations is a key driver. Technological advancements like online marketplaces and digital vehicle inspection tools are enhancing transparency and convenience, boosting market penetration. The rise of subscription models offers flexibility, further expanding market reach. The market is witnessing a shift toward used electric vehicles due to environmental awareness and government incentives. Competitive dynamics are intensifying, with both online and offline players vying for market share. The Compound Annual Growth Rate (CAGR) for the second-hand car market from 2019 to 2024 is estimated at 5%, with market penetration exceeding 80% in major urban areas. This growth is projected to continue, albeit at a slightly moderated pace, in the forecast period, driven by the sustained demand and evolving consumer preferences. Challenges include fluctuating fuel prices and the potential impact of economic downturns on consumer spending.
Dominant Markets & Segments in Second Hand Cars Industry in Australia
The Australian second-hand car market is geographically widespread, with significant sales across all states and territories. However, major metropolitan areas such as Sydney, Melbourne, and Brisbane constitute the most dominant segments.
Vendor Type: The organized sector (dealerships, large online platforms) holds a larger share, estimated at 60% in 2024. The unorganized sector (private sellers) accounts for the remaining 40%.
Fuel Type: Petrol remains the dominant fuel type, accounting for approximately 75% of sales in 2024. Diesel accounts for 20%, while electric vehicles and other fuel types (e.g., hybrid) are still emerging.
Body Type: SUVs and MPVs are experiencing high demand, driven by changing family needs and preferences, holding approximately 45% market share in 2024. Sedans and hatchbacks constitute the remaining market share.
Sales Channel: Online sales are rapidly increasing, with online platforms like Carsales and Gumtree capturing a significant portion of the market. Online sales accounted for approximately 40% of total sales in 2024, while offline channels (dealerships) account for 60%.
Key Drivers:
- Strong consumer demand driven by affordability.
- Growth of online marketplaces enhancing market accessibility.
- Government incentives promoting used vehicle sales.
- Infrastructure supporting vehicle transportation and logistics.
Second Hand Cars Industry in Australia Product Developments
Recent innovations focus on enhancing transparency and convenience. Digital vehicle history reports, online valuation tools, and virtual inspections are gaining popularity. The increased availability of certified pre-owned vehicles (e.g., Toyota Certified Pre-Owned Vehicle, BMW Premium Certified) provides buyers with greater assurance. These developments aim to improve customer trust and reduce information asymmetry in the market. The integration of AI and big data in pricing and risk assessment is also shaping the future of the industry.
Report Scope & Segmentation Analysis
This report segments the Australian second-hand car market by various parameters.
Vendor Type: Organized (dealerships, large online platforms) and Unorganized (private sellers). Growth projections vary significantly, with organized vendors expected to grow faster due to their scalability and marketing reach.
Fuel Type: Petrol, Diesel, Electric, and Others. Electric vehicle sales are expected to increase significantly in the forecast period.
Body Type: Hatchback, Sedan, SUV, and MPV. Demand for SUVs and MPVs are predicted to remain high.
Sales Channel: Online and Offline. Online sales are projected to grow at a higher rate than offline sales. Competition is intensifying across all segments.
Key Drivers of Second Hand Cars Industry in Australia Growth
Several factors are driving growth in the Australian second-hand car market. Firstly, the increasing affordability of used cars compared to new vehicles is a significant driver. Secondly, the growth of online marketplaces improves market transparency and access for buyers. Finally, government policies and incentives promoting sustainable transportation options (including used electric vehicles) support market expansion.
Challenges in the Second Hand Cars Industry in Australia Sector
The Australian second-hand car market faces challenges such as fluctuating used car prices due to economic conditions. Supply chain disruptions and the availability of used vehicles can also impact market dynamics. Increased competition from both established players and new entrants increases pressure on margins. Moreover, regulatory changes around emission standards and vehicle safety could lead to increased compliance costs for businesses.
Emerging Opportunities in Second Hand Cars Industry in Australia
The growth of the used electric vehicle market presents a significant opportunity. The expansion of subscription services offers new revenue models for businesses. Developing innovative solutions that address consumer concerns, such as extended warranties and comprehensive vehicle inspection services, can create a competitive advantage. Furthermore, targeting niche segments with specialized used vehicles represents another potential growth area.
Leading Players in the Second Hand Cars Industry in Australia Market
- Gumtree AU Pty Limited
- Carsales com Limited
- Drive (Nine Entertainment Co Pty Limited)
- Cartopia Pty Ltd
- Brighton Suzuki Brighton
- Cars
- HELLOCARS SUBSCRIPTION PTY LTD
- BMW Premium Certified
- Carsguide Autotrader Media Solutions Pty Ltd
- Toyota Certified Pre-Owned Vehicle
Key Developments in Second Hand Cars Industry in Australia Industry
March 2023: Hyundai Australia launched used Ioniq 5 sales online. This signifies the growing importance of electric vehicles in the used car market.
May 2023: Sojitz Corporation acquired Albert Automotive Holdings Pty Ltd, indicating consolidation within the wholesale and retail used car sector. This acquisition potentially strengthens the market position of the acquiring company.
Strategic Outlook for Second Hand Cars Industry in Australia Market
The Australian second-hand car market is poised for continued growth, driven by sustained consumer demand, technological advancements, and the increasing prominence of electric vehicles. Opportunities exist for businesses to capitalize on evolving consumer preferences, integrate innovative technologies, and optimize operational efficiencies. Companies that can adapt to market dynamics, enhance customer experience, and manage regulatory changes effectively will be best positioned for success.
Second Hand Cars Industry in Australia Segmentation
-
1. Vendor Type
- 1.1. Organized
- 1.2. Unorganized
-
2. Fuel Type
- 2.1. Petrol
- 2.2. Diesel
- 2.3. Electric
- 2.4. Others
-
3. Body Type
- 3.1. Hatchback
- 3.2. Sedan
- 3.3. Sport Utility Vehicle and Multi-Purpose Vehicle
-
4. Sales Channel
- 4.1. Online
- 4.2. Offline
Second Hand Cars Industry in Australia Segmentation By Geography
-
1. North America
- 1.1. United States
- 1.2. Canada
- 1.3. Mexico
-
2. South America
- 2.1. Brazil
- 2.2. Argentina
- 2.3. Rest of South America
-
3. Europe
- 3.1. United Kingdom
- 3.2. Germany
- 3.3. France
- 3.4. Italy
- 3.5. Spain
- 3.6. Russia
- 3.7. Benelux
- 3.8. Nordics
- 3.9. Rest of Europe
-
4. Middle East & Africa
- 4.1. Turkey
- 4.2. Israel
- 4.3. GCC
- 4.4. North Africa
- 4.5. South Africa
- 4.6. Rest of Middle East & Africa
-
5. Asia Pacific
- 5.1. China
- 5.2. India
- 5.3. Japan
- 5.4. South Korea
- 5.5. ASEAN
- 5.6. Oceania
- 5.7. Rest of Asia Pacific
Second Hand Cars Industry in Australia REPORT HIGHLIGHTS
| Aspects | Details |
|---|---|
| Study Period | 2019-2033 |
| Base Year | 2024 |
| Estimated Year | 2025 |
| Forecast Period | 2025-2033 |
| Historical Period | 2019-2024 |
| Growth Rate | CAGR of 10.12% from 2019-2033 |
| Segmentation |
|
Table of Contents
- 1. Introduction
- 1.1. Research Scope
- 1.2. Market Segmentation
- 1.3. Research Methodology
- 1.4. Definitions and Assumptions
- 2. Executive Summary
- 2.1. Introduction
- 3. Market Dynamics
- 3.1. Introduction
- 3.2. Market Drivers
- 3.2.1. Quality Assurance is Driving Market Growth in the Country
- 3.3. Market Restrains
- 3.3.1. Trust and Transparency in Used Car Remained a Key Challenge for Consumers
- 3.4. Market Trends
- 3.4.1. The Online Sales Channel Segment is Expected to be the Fastest Growing Segment Between 2024 and 2029
- 4. Market Factor Analysis
- 4.1. Porters Five Forces
- 4.2. Supply/Value Chain
- 4.3. PESTEL analysis
- 4.4. Market Entropy
- 4.5. Patent/Trademark Analysis
- 5. Global Second Hand Cars Industry in Australia Analysis, Insights and Forecast, 2019-2031
- 5.1. Market Analysis, Insights and Forecast - by Vendor Type
- 5.1.1. Organized
- 5.1.2. Unorganized
- 5.2. Market Analysis, Insights and Forecast - by Fuel Type
- 5.2.1. Petrol
- 5.2.2. Diesel
- 5.2.3. Electric
- 5.2.4. Others
- 5.3. Market Analysis, Insights and Forecast - by Body Type
- 5.3.1. Hatchback
- 5.3.2. Sedan
- 5.3.3. Sport Utility Vehicle and Multi-Purpose Vehicle
- 5.4. Market Analysis, Insights and Forecast - by Sales Channel
- 5.4.1. Online
- 5.4.2. Offline
- 5.5. Market Analysis, Insights and Forecast - by Region
- 5.5.1. North America
- 5.5.2. South America
- 5.5.3. Europe
- 5.5.4. Middle East & Africa
- 5.5.5. Asia Pacific
- 5.1. Market Analysis, Insights and Forecast - by Vendor Type
- 6. North America Second Hand Cars Industry in Australia Analysis, Insights and Forecast, 2019-2031
- 6.1. Market Analysis, Insights and Forecast - by Vendor Type
- 6.1.1. Organized
- 6.1.2. Unorganized
- 6.2. Market Analysis, Insights and Forecast - by Fuel Type
- 6.2.1. Petrol
- 6.2.2. Diesel
- 6.2.3. Electric
- 6.2.4. Others
- 6.3. Market Analysis, Insights and Forecast - by Body Type
- 6.3.1. Hatchback
- 6.3.2. Sedan
- 6.3.3. Sport Utility Vehicle and Multi-Purpose Vehicle
- 6.4. Market Analysis, Insights and Forecast - by Sales Channel
- 6.4.1. Online
- 6.4.2. Offline
- 6.1. Market Analysis, Insights and Forecast - by Vendor Type
- 7. South America Second Hand Cars Industry in Australia Analysis, Insights and Forecast, 2019-2031
- 7.1. Market Analysis, Insights and Forecast - by Vendor Type
- 7.1.1. Organized
- 7.1.2. Unorganized
- 7.2. Market Analysis, Insights and Forecast - by Fuel Type
- 7.2.1. Petrol
- 7.2.2. Diesel
- 7.2.3. Electric
- 7.2.4. Others
- 7.3. Market Analysis, Insights and Forecast - by Body Type
- 7.3.1. Hatchback
- 7.3.2. Sedan
- 7.3.3. Sport Utility Vehicle and Multi-Purpose Vehicle
- 7.4. Market Analysis, Insights and Forecast - by Sales Channel
- 7.4.1. Online
- 7.4.2. Offline
- 7.1. Market Analysis, Insights and Forecast - by Vendor Type
- 8. Europe Second Hand Cars Industry in Australia Analysis, Insights and Forecast, 2019-2031
- 8.1. Market Analysis, Insights and Forecast - by Vendor Type
- 8.1.1. Organized
- 8.1.2. Unorganized
- 8.2. Market Analysis, Insights and Forecast - by Fuel Type
- 8.2.1. Petrol
- 8.2.2. Diesel
- 8.2.3. Electric
- 8.2.4. Others
- 8.3. Market Analysis, Insights and Forecast - by Body Type
- 8.3.1. Hatchback
- 8.3.2. Sedan
- 8.3.3. Sport Utility Vehicle and Multi-Purpose Vehicle
- 8.4. Market Analysis, Insights and Forecast - by Sales Channel
- 8.4.1. Online
- 8.4.2. Offline
- 8.1. Market Analysis, Insights and Forecast - by Vendor Type
- 9. Middle East & Africa Second Hand Cars Industry in Australia Analysis, Insights and Forecast, 2019-2031
- 9.1. Market Analysis, Insights and Forecast - by Vendor Type
- 9.1.1. Organized
- 9.1.2. Unorganized
- 9.2. Market Analysis, Insights and Forecast - by Fuel Type
- 9.2.1. Petrol
- 9.2.2. Diesel
- 9.2.3. Electric
- 9.2.4. Others
- 9.3. Market Analysis, Insights and Forecast - by Body Type
- 9.3.1. Hatchback
- 9.3.2. Sedan
- 9.3.3. Sport Utility Vehicle and Multi-Purpose Vehicle
- 9.4. Market Analysis, Insights and Forecast - by Sales Channel
- 9.4.1. Online
- 9.4.2. Offline
- 9.1. Market Analysis, Insights and Forecast - by Vendor Type
- 10. Asia Pacific Second Hand Cars Industry in Australia Analysis, Insights and Forecast, 2019-2031
- 10.1. Market Analysis, Insights and Forecast - by Vendor Type
- 10.1.1. Organized
- 10.1.2. Unorganized
- 10.2. Market Analysis, Insights and Forecast - by Fuel Type
- 10.2.1. Petrol
- 10.2.2. Diesel
- 10.2.3. Electric
- 10.2.4. Others
- 10.3. Market Analysis, Insights and Forecast - by Body Type
- 10.3.1. Hatchback
- 10.3.2. Sedan
- 10.3.3. Sport Utility Vehicle and Multi-Purpose Vehicle
- 10.4. Market Analysis, Insights and Forecast - by Sales Channel
- 10.4.1. Online
- 10.4.2. Offline
- 10.1. Market Analysis, Insights and Forecast - by Vendor Type
- 11. Competitive Analysis
- 11.1. Global Market Share Analysis 2024
- 11.2. Company Profiles
- 11.2.1 Gumtree AU Pty Limited
- 11.2.1.1. Overview
- 11.2.1.2. Products
- 11.2.1.3. SWOT Analysis
- 11.2.1.4. Recent Developments
- 11.2.1.5. Financials (Based on Availability)
- 11.2.2 Carsales com Limited
- 11.2.2.1. Overview
- 11.2.2.2. Products
- 11.2.2.3. SWOT Analysis
- 11.2.2.4. Recent Developments
- 11.2.2.5. Financials (Based on Availability)
- 11.2.3 Drive (Nine Entertainment Co Pty Limited)
- 11.2.3.1. Overview
- 11.2.3.2. Products
- 11.2.3.3. SWOT Analysis
- 11.2.3.4. Recent Developments
- 11.2.3.5. Financials (Based on Availability)
- 11.2.4 Cartopia Pty Ltd
- 11.2.4.1. Overview
- 11.2.4.2. Products
- 11.2.4.3. SWOT Analysis
- 11.2.4.4. Recent Developments
- 11.2.4.5. Financials (Based on Availability)
- 11.2.5 Brighton Suzuki Brighton
- 11.2.5.1. Overview
- 11.2.5.2. Products
- 11.2.5.3. SWOT Analysis
- 11.2.5.4. Recent Developments
- 11.2.5.5. Financials (Based on Availability)
- 11.2.6 Cars
- 11.2.6.1. Overview
- 11.2.6.2. Products
- 11.2.6.3. SWOT Analysis
- 11.2.6.4. Recent Developments
- 11.2.6.5. Financials (Based on Availability)
- 11.2.7 HELLOCARS SUBSCRIPTION PTY LTD
- 11.2.7.1. Overview
- 11.2.7.2. Products
- 11.2.7.3. SWOT Analysis
- 11.2.7.4. Recent Developments
- 11.2.7.5. Financials (Based on Availability)
- 11.2.8 BMW Premium Certified*List Not Exhaustive
- 11.2.8.1. Overview
- 11.2.8.2. Products
- 11.2.8.3. SWOT Analysis
- 11.2.8.4. Recent Developments
- 11.2.8.5. Financials (Based on Availability)
- 11.2.9 Carsguide Autotrader Media Solutions Pty Ltd
- 11.2.9.1. Overview
- 11.2.9.2. Products
- 11.2.9.3. SWOT Analysis
- 11.2.9.4. Recent Developments
- 11.2.9.5. Financials (Based on Availability)
- 11.2.10 Toyota Certified Pre-Owned Vehicle
- 11.2.10.1. Overview
- 11.2.10.2. Products
- 11.2.10.3. SWOT Analysis
- 11.2.10.4. Recent Developments
- 11.2.10.5. Financials (Based on Availability)
- 11.2.1 Gumtree AU Pty Limited
List of Figures
- Figure 1: Global Second Hand Cars Industry in Australia Revenue Breakdown (Million, %) by Region 2024 & 2032
- Figure 2: Australia Second Hand Cars Industry in Australia Revenue (Million), by Country 2024 & 2032
- Figure 3: Australia Second Hand Cars Industry in Australia Revenue Share (%), by Country 2024 & 2032
- Figure 4: North America Second Hand Cars Industry in Australia Revenue (Million), by Vendor Type 2024 & 2032
- Figure 5: North America Second Hand Cars Industry in Australia Revenue Share (%), by Vendor Type 2024 & 2032
- Figure 6: North America Second Hand Cars Industry in Australia Revenue (Million), by Fuel Type 2024 & 2032
- Figure 7: North America Second Hand Cars Industry in Australia Revenue Share (%), by Fuel Type 2024 & 2032
- Figure 8: North America Second Hand Cars Industry in Australia Revenue (Million), by Body Type 2024 & 2032
- Figure 9: North America Second Hand Cars Industry in Australia Revenue Share (%), by Body Type 2024 & 2032
- Figure 10: North America Second Hand Cars Industry in Australia Revenue (Million), by Sales Channel 2024 & 2032
- Figure 11: North America Second Hand Cars Industry in Australia Revenue Share (%), by Sales Channel 2024 & 2032
- Figure 12: North America Second Hand Cars Industry in Australia Revenue (Million), by Country 2024 & 2032
- Figure 13: North America Second Hand Cars Industry in Australia Revenue Share (%), by Country 2024 & 2032
- Figure 14: South America Second Hand Cars Industry in Australia Revenue (Million), by Vendor Type 2024 & 2032
- Figure 15: South America Second Hand Cars Industry in Australia Revenue Share (%), by Vendor Type 2024 & 2032
- Figure 16: South America Second Hand Cars Industry in Australia Revenue (Million), by Fuel Type 2024 & 2032
- Figure 17: South America Second Hand Cars Industry in Australia Revenue Share (%), by Fuel Type 2024 & 2032
- Figure 18: South America Second Hand Cars Industry in Australia Revenue (Million), by Body Type 2024 & 2032
- Figure 19: South America Second Hand Cars Industry in Australia Revenue Share (%), by Body Type 2024 & 2032
- Figure 20: South America Second Hand Cars Industry in Australia Revenue (Million), by Sales Channel 2024 & 2032
- Figure 21: South America Second Hand Cars Industry in Australia Revenue Share (%), by Sales Channel 2024 & 2032
- Figure 22: South America Second Hand Cars Industry in Australia Revenue (Million), by Country 2024 & 2032
- Figure 23: South America Second Hand Cars Industry in Australia Revenue Share (%), by Country 2024 & 2032
- Figure 24: Europe Second Hand Cars Industry in Australia Revenue (Million), by Vendor Type 2024 & 2032
- Figure 25: Europe Second Hand Cars Industry in Australia Revenue Share (%), by Vendor Type 2024 & 2032
- Figure 26: Europe Second Hand Cars Industry in Australia Revenue (Million), by Fuel Type 2024 & 2032
- Figure 27: Europe Second Hand Cars Industry in Australia Revenue Share (%), by Fuel Type 2024 & 2032
- Figure 28: Europe Second Hand Cars Industry in Australia Revenue (Million), by Body Type 2024 & 2032
- Figure 29: Europe Second Hand Cars Industry in Australia Revenue Share (%), by Body Type 2024 & 2032
- Figure 30: Europe Second Hand Cars Industry in Australia Revenue (Million), by Sales Channel 2024 & 2032
- Figure 31: Europe Second Hand Cars Industry in Australia Revenue Share (%), by Sales Channel 2024 & 2032
- Figure 32: Europe Second Hand Cars Industry in Australia Revenue (Million), by Country 2024 & 2032
- Figure 33: Europe Second Hand Cars Industry in Australia Revenue Share (%), by Country 2024 & 2032
- Figure 34: Middle East & Africa Second Hand Cars Industry in Australia Revenue (Million), by Vendor Type 2024 & 2032
- Figure 35: Middle East & Africa Second Hand Cars Industry in Australia Revenue Share (%), by Vendor Type 2024 & 2032
- Figure 36: Middle East & Africa Second Hand Cars Industry in Australia Revenue (Million), by Fuel Type 2024 & 2032
- Figure 37: Middle East & Africa Second Hand Cars Industry in Australia Revenue Share (%), by Fuel Type 2024 & 2032
- Figure 38: Middle East & Africa Second Hand Cars Industry in Australia Revenue (Million), by Body Type 2024 & 2032
- Figure 39: Middle East & Africa Second Hand Cars Industry in Australia Revenue Share (%), by Body Type 2024 & 2032
- Figure 40: Middle East & Africa Second Hand Cars Industry in Australia Revenue (Million), by Sales Channel 2024 & 2032
- Figure 41: Middle East & Africa Second Hand Cars Industry in Australia Revenue Share (%), by Sales Channel 2024 & 2032
- Figure 42: Middle East & Africa Second Hand Cars Industry in Australia Revenue (Million), by Country 2024 & 2032
- Figure 43: Middle East & Africa Second Hand Cars Industry in Australia Revenue Share (%), by Country 2024 & 2032
- Figure 44: Asia Pacific Second Hand Cars Industry in Australia Revenue (Million), by Vendor Type 2024 & 2032
- Figure 45: Asia Pacific Second Hand Cars Industry in Australia Revenue Share (%), by Vendor Type 2024 & 2032
- Figure 46: Asia Pacific Second Hand Cars Industry in Australia Revenue (Million), by Fuel Type 2024 & 2032
- Figure 47: Asia Pacific Second Hand Cars Industry in Australia Revenue Share (%), by Fuel Type 2024 & 2032
- Figure 48: Asia Pacific Second Hand Cars Industry in Australia Revenue (Million), by Body Type 2024 & 2032
- Figure 49: Asia Pacific Second Hand Cars Industry in Australia Revenue Share (%), by Body Type 2024 & 2032
- Figure 50: Asia Pacific Second Hand Cars Industry in Australia Revenue (Million), by Sales Channel 2024 & 2032
- Figure 51: Asia Pacific Second Hand Cars Industry in Australia Revenue Share (%), by Sales Channel 2024 & 2032
- Figure 52: Asia Pacific Second Hand Cars Industry in Australia Revenue (Million), by Country 2024 & 2032
- Figure 53: Asia Pacific Second Hand Cars Industry in Australia Revenue Share (%), by Country 2024 & 2032
List of Tables
- Table 1: Global Second Hand Cars Industry in Australia Revenue Million Forecast, by Region 2019 & 2032
- Table 2: Global Second Hand Cars Industry in Australia Revenue Million Forecast, by Vendor Type 2019 & 2032
- Table 3: Global Second Hand Cars Industry in Australia Revenue Million Forecast, by Fuel Type 2019 & 2032
- Table 4: Global Second Hand Cars Industry in Australia Revenue Million Forecast, by Body Type 2019 & 2032
- Table 5: Global Second Hand Cars Industry in Australia Revenue Million Forecast, by Sales Channel 2019 & 2032
- Table 6: Global Second Hand Cars Industry in Australia Revenue Million Forecast, by Region 2019 & 2032
- Table 7: Global Second Hand Cars Industry in Australia Revenue Million Forecast, by Country 2019 & 2032
- Table 8: Global Second Hand Cars Industry in Australia Revenue Million Forecast, by Vendor Type 2019 & 2032
- Table 9: Global Second Hand Cars Industry in Australia Revenue Million Forecast, by Fuel Type 2019 & 2032
- Table 10: Global Second Hand Cars Industry in Australia Revenue Million Forecast, by Body Type 2019 & 2032
- Table 11: Global Second Hand Cars Industry in Australia Revenue Million Forecast, by Sales Channel 2019 & 2032
- Table 12: Global Second Hand Cars Industry in Australia Revenue Million Forecast, by Country 2019 & 2032
- Table 13: United States Second Hand Cars Industry in Australia Revenue (Million) Forecast, by Application 2019 & 2032
- Table 14: Canada Second Hand Cars Industry in Australia Revenue (Million) Forecast, by Application 2019 & 2032
- Table 15: Mexico Second Hand Cars Industry in Australia Revenue (Million) Forecast, by Application 2019 & 2032
- Table 16: Global Second Hand Cars Industry in Australia Revenue Million Forecast, by Vendor Type 2019 & 2032
- Table 17: Global Second Hand Cars Industry in Australia Revenue Million Forecast, by Fuel Type 2019 & 2032
- Table 18: Global Second Hand Cars Industry in Australia Revenue Million Forecast, by Body Type 2019 & 2032
- Table 19: Global Second Hand Cars Industry in Australia Revenue Million Forecast, by Sales Channel 2019 & 2032
- Table 20: Global Second Hand Cars Industry in Australia Revenue Million Forecast, by Country 2019 & 2032
- Table 21: Brazil Second Hand Cars Industry in Australia Revenue (Million) Forecast, by Application 2019 & 2032
- Table 22: Argentina Second Hand Cars Industry in Australia Revenue (Million) Forecast, by Application 2019 & 2032
- Table 23: Rest of South America Second Hand Cars Industry in Australia Revenue (Million) Forecast, by Application 2019 & 2032
- Table 24: Global Second Hand Cars Industry in Australia Revenue Million Forecast, by Vendor Type 2019 & 2032
- Table 25: Global Second Hand Cars Industry in Australia Revenue Million Forecast, by Fuel Type 2019 & 2032
- Table 26: Global Second Hand Cars Industry in Australia Revenue Million Forecast, by Body Type 2019 & 2032
- Table 27: Global Second Hand Cars Industry in Australia Revenue Million Forecast, by Sales Channel 2019 & 2032
- Table 28: Global Second Hand Cars Industry in Australia Revenue Million Forecast, by Country 2019 & 2032
- Table 29: United Kingdom Second Hand Cars Industry in Australia Revenue (Million) Forecast, by Application 2019 & 2032
- Table 30: Germany Second Hand Cars Industry in Australia Revenue (Million) Forecast, by Application 2019 & 2032
- Table 31: France Second Hand Cars Industry in Australia Revenue (Million) Forecast, by Application 2019 & 2032
- Table 32: Italy Second Hand Cars Industry in Australia Revenue (Million) Forecast, by Application 2019 & 2032
- Table 33: Spain Second Hand Cars Industry in Australia Revenue (Million) Forecast, by Application 2019 & 2032
- Table 34: Russia Second Hand Cars Industry in Australia Revenue (Million) Forecast, by Application 2019 & 2032
- Table 35: Benelux Second Hand Cars Industry in Australia Revenue (Million) Forecast, by Application 2019 & 2032
- Table 36: Nordics Second Hand Cars Industry in Australia Revenue (Million) Forecast, by Application 2019 & 2032
- Table 37: Rest of Europe Second Hand Cars Industry in Australia Revenue (Million) Forecast, by Application 2019 & 2032
- Table 38: Global Second Hand Cars Industry in Australia Revenue Million Forecast, by Vendor Type 2019 & 2032
- Table 39: Global Second Hand Cars Industry in Australia Revenue Million Forecast, by Fuel Type 2019 & 2032
- Table 40: Global Second Hand Cars Industry in Australia Revenue Million Forecast, by Body Type 2019 & 2032
- Table 41: Global Second Hand Cars Industry in Australia Revenue Million Forecast, by Sales Channel 2019 & 2032
- Table 42: Global Second Hand Cars Industry in Australia Revenue Million Forecast, by Country 2019 & 2032
- Table 43: Turkey Second Hand Cars Industry in Australia Revenue (Million) Forecast, by Application 2019 & 2032
- Table 44: Israel Second Hand Cars Industry in Australia Revenue (Million) Forecast, by Application 2019 & 2032
- Table 45: GCC Second Hand Cars Industry in Australia Revenue (Million) Forecast, by Application 2019 & 2032
- Table 46: North Africa Second Hand Cars Industry in Australia Revenue (Million) Forecast, by Application 2019 & 2032
- Table 47: South Africa Second Hand Cars Industry in Australia Revenue (Million) Forecast, by Application 2019 & 2032
- Table 48: Rest of Middle East & Africa Second Hand Cars Industry in Australia Revenue (Million) Forecast, by Application 2019 & 2032
- Table 49: Global Second Hand Cars Industry in Australia Revenue Million Forecast, by Vendor Type 2019 & 2032
- Table 50: Global Second Hand Cars Industry in Australia Revenue Million Forecast, by Fuel Type 2019 & 2032
- Table 51: Global Second Hand Cars Industry in Australia Revenue Million Forecast, by Body Type 2019 & 2032
- Table 52: Global Second Hand Cars Industry in Australia Revenue Million Forecast, by Sales Channel 2019 & 2032
- Table 53: Global Second Hand Cars Industry in Australia Revenue Million Forecast, by Country 2019 & 2032
- Table 54: China Second Hand Cars Industry in Australia Revenue (Million) Forecast, by Application 2019 & 2032
- Table 55: India Second Hand Cars Industry in Australia Revenue (Million) Forecast, by Application 2019 & 2032
- Table 56: Japan Second Hand Cars Industry in Australia Revenue (Million) Forecast, by Application 2019 & 2032
- Table 57: South Korea Second Hand Cars Industry in Australia Revenue (Million) Forecast, by Application 2019 & 2032
- Table 58: ASEAN Second Hand Cars Industry in Australia Revenue (Million) Forecast, by Application 2019 & 2032
- Table 59: Oceania Second Hand Cars Industry in Australia Revenue (Million) Forecast, by Application 2019 & 2032
- Table 60: Rest of Asia Pacific Second Hand Cars Industry in Australia Revenue (Million) Forecast, by Application 2019 & 2032
Frequently Asked Questions
1. What is the projected Compound Annual Growth Rate (CAGR) of the Second Hand Cars Industry in Australia?
The projected CAGR is approximately 10.12%.
2. Which companies are prominent players in the Second Hand Cars Industry in Australia?
Key companies in the market include Gumtree AU Pty Limited, Carsales com Limited, Drive (Nine Entertainment Co Pty Limited), Cartopia Pty Ltd, Brighton Suzuki Brighton, Cars, HELLOCARS SUBSCRIPTION PTY LTD, BMW Premium Certified*List Not Exhaustive, Carsguide Autotrader Media Solutions Pty Ltd, Toyota Certified Pre-Owned Vehicle.
3. What are the main segments of the Second Hand Cars Industry in Australia?
The market segments include Vendor Type, Fuel Type, Body Type, Sales Channel.
4. Can you provide details about the market size?
The market size is estimated to be USD 69.90 Million as of 2022.
5. What are some drivers contributing to market growth?
Quality Assurance is Driving Market Growth in the Country.
6. What are the notable trends driving market growth?
The Online Sales Channel Segment is Expected to be the Fastest Growing Segment Between 2024 and 2029.
7. Are there any restraints impacting market growth?
Trust and Transparency in Used Car Remained a Key Challenge for Consumers.
8. Can you provide examples of recent developments in the market?
March 2023: Hyundai Australia announced that it has begun selling used Ioniq 5 models on its company’s website, beginning with 23 vehicles initially.
9. What pricing options are available for accessing the report?
Pricing options include single-user, multi-user, and enterprise licenses priced at USD 3800, USD 4500, and USD 5800 respectively.
10. Is the market size provided in terms of value or volume?
The market size is provided in terms of value, measured in Million.
11. Are there any specific market keywords associated with the report?
Yes, the market keyword associated with the report is "Second Hand Cars Industry in Australia," which aids in identifying and referencing the specific market segment covered.
12. How do I determine which pricing option suits my needs best?
The pricing options vary based on user requirements and access needs. Individual users may opt for single-user licenses, while businesses requiring broader access may choose multi-user or enterprise licenses for cost-effective access to the report.
13. Are there any additional resources or data provided in the Second Hand Cars Industry in Australia report?
While the report offers comprehensive insights, it's advisable to review the specific contents or supplementary materials provided to ascertain if additional resources or data are available.
14. How can I stay updated on further developments or reports in the Second Hand Cars Industry in Australia?
To stay informed about further developments, trends, and reports in the Second Hand Cars Industry in Australia, consider subscribing to industry newsletters, following relevant companies and organizations, or regularly checking reputable industry news sources and publications.
Methodology
Step 1 - Identification of Relevant Samples Size from Population Database


Step 2 - Approaches for Defining Global Market Size (Value, Volume* & Price*)

Note*: In applicable scenarios
Step 3 - Data Sources
Primary Research
- Web Analytics
- Survey Reports
- Research Institute
- Latest Research Reports
- Opinion Leaders
Secondary Research
- Annual Reports
- White Paper
- Latest Press Release
- Industry Association
- Paid Database
- Investor Presentations

Step 4 - Data Triangulation
Involves using different sources of information in order to increase the validity of a study
These sources are likely to be stakeholders in a program - participants, other researchers, program staff, other community members, and so on.
Then we put all data in single framework & apply various statistical tools to find out the dynamic on the market.
During the analysis stage, feedback from the stakeholder groups would be compared to determine areas of agreement as well as areas of divergence


