
Key Insights
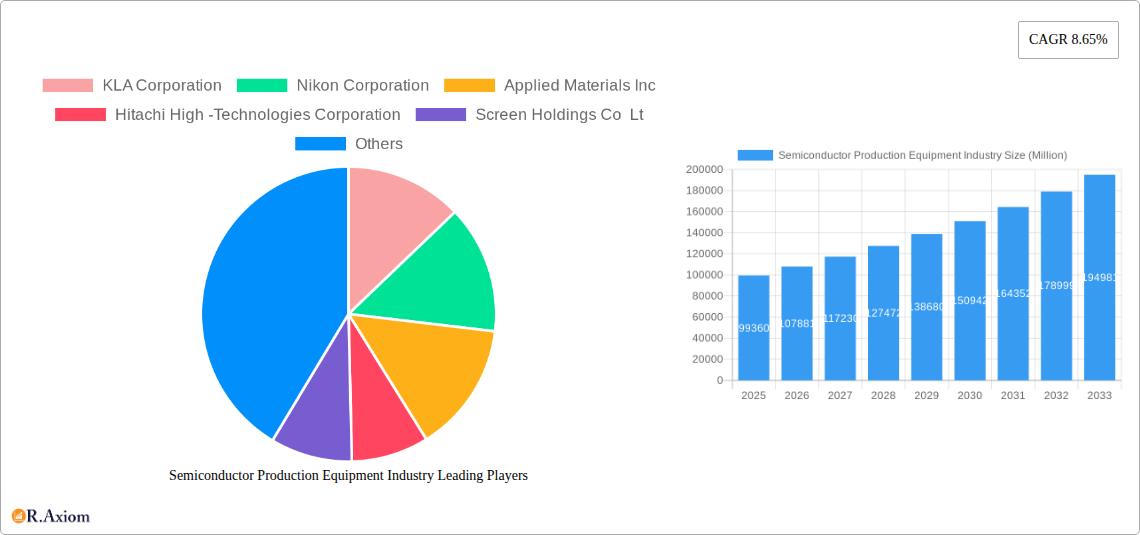
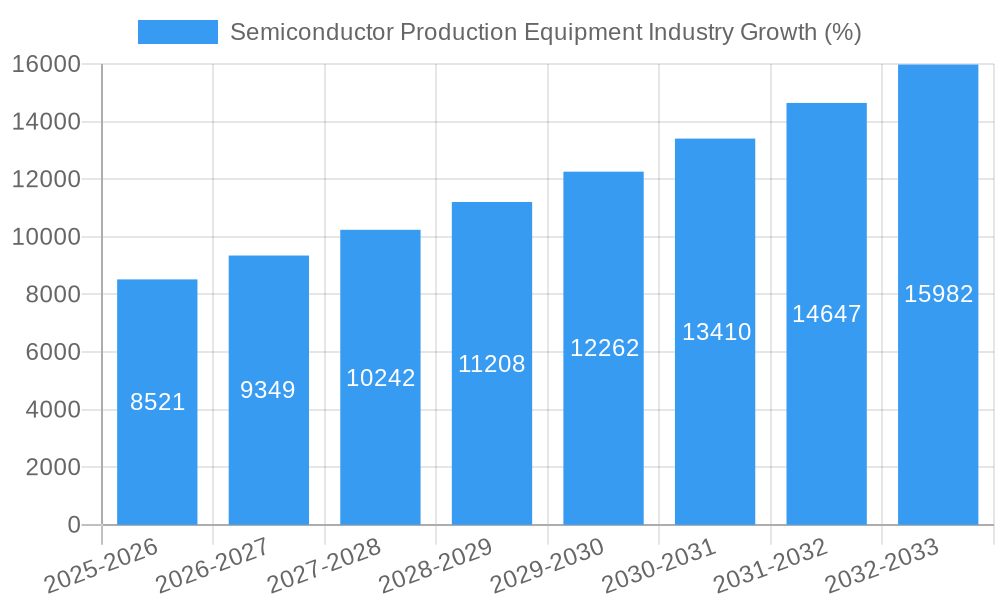
The Semiconductor Production Equipment market, valued at $99.36 billion in 2025, is projected to experience robust growth, driven by the increasing demand for advanced semiconductor devices across various end-user industries. The Compound Annual Growth Rate (CAGR) of 8.65% from 2025 to 2033 indicates a significant expansion, fueled by technological advancements such as the development of extreme ultraviolet (EUV) lithography and advanced packaging technologies. Growth is further propelled by the rising adoption of 5G and other wireless communication technologies, the proliferation of AI and high-performance computing, and the surging demand for automotive electronics and IoT devices. Key segments driving this growth include lithography equipment, crucial for creating intricate chip patterns, and etching equipment, essential for removing unwanted material. The semiconductor fabrication plant segment dominates the end-user industry, reflecting the central role of these plants in the overall semiconductor manufacturing process. Leading players like Applied Materials, ASML, and Tokyo Electron Limited are significantly shaping the market landscape through continuous innovation and strategic partnerships. However, potential restraints include supply chain disruptions, geopolitical instability affecting manufacturing locations, and the cyclical nature of the semiconductor industry.
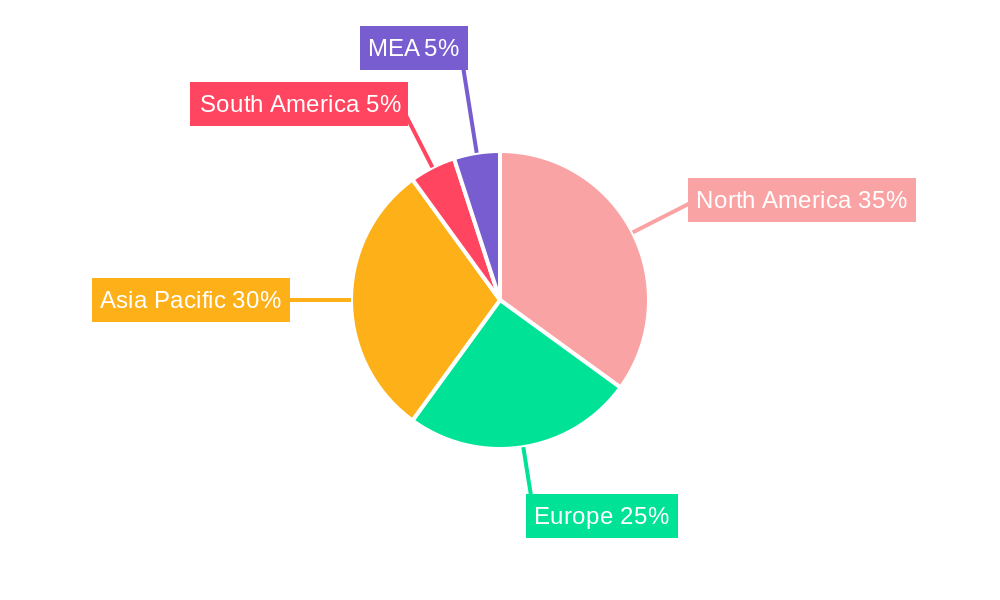
Despite these challenges, the long-term outlook for the Semiconductor Production Equipment market remains positive. The ongoing miniaturization of semiconductor chips necessitates continuous innovation in production equipment, ensuring consistent market growth. Regional analysis reveals strong growth in the Asia-Pacific region, particularly in China, South Korea, and Taiwan, due to the concentration of major semiconductor manufacturers and growing domestic demand. North America and Europe maintain significant market shares, owing to the presence of established players and advanced research facilities. The market's trajectory suggests a continuous need for sophisticated and efficient equipment to meet the ever-increasing demand for advanced semiconductors across multiple sectors, fostering ongoing investment and technological advancement within the industry.
Semiconductor Production Equipment Industry: A Comprehensive Market Report (2019-2033)
This comprehensive report provides an in-depth analysis of the Semiconductor Production Equipment industry, covering market size, segmentation, key players, growth drivers, challenges, and future outlook. The study period spans from 2019 to 2033, with 2025 as the base and estimated year. The report offers actionable insights for industry stakeholders, investors, and businesses seeking to navigate this dynamic market.
Semiconductor Production Equipment Industry Market Concentration & Innovation
The semiconductor production equipment market is characterized by high concentration among a few dominant players, exhibiting significant economies of scale and technological prowess. Key players like Applied Materials, Tokyo Electron, ASML, and Lam Research command substantial market share, often exceeding xx% collectively. This oligopolistic structure fosters both intense competition and strategic collaborations.
Innovation is a critical driver, fueled by the relentless demand for smaller, faster, and more energy-efficient chips. Advancements in lithography (EUV and high-NA EUV), etching, deposition, and metrology technologies constantly push the boundaries of chip fabrication. Stringent regulatory frameworks, particularly concerning environmental impact and safety standards, influence equipment design and manufacturing processes. The market also witnesses continuous development of product substitutes, particularly in materials and processes aiming for cost-effectiveness and enhanced performance. End-user trends, focused on advanced packaging and specialized semiconductor applications, shape equipment demand.
M&A activity is another defining feature, with major players strategically acquiring smaller companies to bolster their technology portfolios and expand their market reach. Recent deals have involved significant investments, with average M&A deal values reaching xx Million in recent years. Examples include (specific examples of M&A deals would go here if available, otherwise, a general statement regarding recent activity).
- Market Concentration: High, with top 5 players controlling xx% of the market.
- Innovation Drivers: Miniaturization, performance enhancement, power efficiency.
- Regulatory Impact: Stringent environmental and safety standards.
- M&A Activity: Significant investments in acquisitions to enhance technology and market share.
Semiconductor Production Equipment Industry Industry Trends & Insights
The semiconductor production equipment market exhibits robust growth, driven by the explosive demand for semiconductors across various applications, including 5G, AI, IoT, and automotive electronics. The Compound Annual Growth Rate (CAGR) during the forecast period (2025-2033) is projected to be xx%, exceeding the historical CAGR of xx% (2019-2024). This growth reflects increasing investments in advanced chip manufacturing capabilities and the expansion of semiconductor fabrication plants globally. Technological disruptions, particularly the widespread adoption of EUV lithography, are fundamentally transforming the industry landscape. Consumer preferences for high-performance computing devices, faster data transfer speeds, and energy-efficient electronics consistently fuel demand for advanced semiconductor production equipment. Competitive dynamics are marked by both intense rivalry among leading players and strategic partnerships focused on joint development of cutting-edge technologies. Market penetration of advanced equipment like high-NA EUV systems is steadily increasing, though adoption rates vary depending on process node and customer needs.
Dominant Markets & Segments in Semiconductor Production Equipment Industry
The Asia-Pacific region, particularly Taiwan, South Korea, and China, dominates the semiconductor production equipment market due to the significant concentration of semiconductor fabrication plants in these countries. This dominance is driven by robust economic policies promoting semiconductor manufacturing, substantial investments in infrastructure, and a large pool of skilled labor.
By Type:
- Lithography Equipment: This segment commands the largest market share, owing to its critical role in defining chip features. Growth is fueled by the adoption of EUV and high-NA EUV lithography.
- Etching Equipment: This segment is vital for creating patterns on wafers, with demand increasing alongside the complexity of chip designs.
- Deposition Equipment: This is essential for creating thin films on wafers, experiencing steady growth driven by the need for advanced materials.
- Other Equipment Types: This includes metrology, inspection, and testing equipment, contributing significantly to overall market value.
By End-user Industry:
- Semiconductor Fabrication Plants: This is the primary end-user segment, accounting for the vast majority of equipment demand. Expansion of fabrication plants and capacity upgrades are key drivers.
- Semiconductor Electronics Manufacturing: This includes companies involved in assembling and packaging semiconductors, with demand driven by the diversification of electronic devices.
Semiconductor Production Equipment Industry Product Developments
Recent product innovations focus on enhancing throughput, improving precision, and minimizing defects. Key trends include advancements in EUV and high-NA EUV lithography systems to address the challenges of creating smaller features, the development of advanced etching techniques for finer and more intricate patterns, and the introduction of innovative deposition methods for improved film quality and material properties. These innovations provide significant competitive advantages by enabling the production of higher-performance and more energy-efficient chips, aligning closely with evolving market requirements.
Report Scope & Segmentation Analysis
This report segments the semiconductor production equipment market by type (Lithography Equipment, Etching Equipment, Deposition Equipment, Other Equipment Types) and end-user industry (Semiconductor Fabrication Plant, Semiconductor Electronics Manufacturing). Each segment's market size, growth projections, and competitive dynamics are thoroughly analyzed. For instance, the Lithography Equipment segment is expected to witness significant growth, driven by the adoption of EUV and high-NA EUV technologies, while the Etching Equipment segment's growth is linked to advancements in plasma etching techniques. Similarly, the Semiconductor Fabrication Plant segment will continue to be the dominant end-user, fueled by increasing investments in new fabs and capacity expansion.
Key Drivers of Semiconductor Production Equipment Growth
Several factors drive the growth of the semiconductor production equipment market: The proliferation of smartphones, the increasing adoption of IoT devices, the growth of cloud computing and data centers, the development of artificial intelligence and machine learning technologies, and the rise of autonomous vehicles are all key drivers. These trends lead to an increasing demand for advanced semiconductors, driving investment in state-of-the-art production equipment. Government incentives and subsidies aimed at boosting domestic semiconductor manufacturing capabilities also contribute significantly to market expansion.
Challenges in the Semiconductor Production Equipment Industry Sector
The semiconductor production equipment industry faces challenges such as high capital expenditure requirements for new equipment, complex and lengthy supply chains vulnerable to disruptions, and intense competition among industry leaders. Geopolitical uncertainties and trade tensions can also significantly impact market stability and growth. The highly specialized nature of the equipment and the complex manufacturing processes contribute to significant barriers to entry for new competitors. The industry also faces pressure to reduce its environmental footprint and improve sustainability. These factors can collectively affect the overall growth trajectory of the market.
Emerging Opportunities in Semiconductor Production Equipment Industry
Emerging opportunities lie in advanced packaging technologies, specialized semiconductor applications (e.g., power semiconductors, sensors), and the development of equipment for producing next-generation chips using novel materials and processes. The increasing focus on sustainable manufacturing practices presents opportunities for environmentally friendly equipment solutions. Expansion into new markets, particularly in developing economies, offers significant growth potential. Furthermore, the development and integration of AI and machine learning in semiconductor manufacturing processes create opportunities for improved efficiency and yield.
Leading Players in the Semiconductor Production Equipment Industry Market
- KLA Corporation
- Nikon Corporation
- Applied Materials Inc
- Hitachi High-Technologies Corporation
- Screen Holdings Co Ltd
- Plasma Therm
- Tokyo Electron Limited
- ASML Holding NV
- Carl Zeiss AG
- LAM Research Corporation
- VEECO Instruments Inc
Key Developments in Semiconductor Production Equipment Industry
- December 2023: Tokyo Electron launched Ulucus G, a wafer thinning system enhancing silicon wafer quality and reducing workforce needs in 300 mm wafer fabrication.
- February 2024: Applied Materials unveiled new products for 2nm and below process nodes, addressing challenges in EUV and high-NA EUV patterning.
Strategic Outlook for Semiconductor Production Equipment Market
The semiconductor production equipment market is poised for sustained growth, driven by persistent demand for advanced semiconductors across various applications. Continuous innovation in materials science, process technologies, and equipment design will be crucial for navigating the challenges associated with miniaturization and performance enhancement. Strategic partnerships and collaborations will play a significant role in accelerating technology development and market expansion. The industry's future success hinges on adapting to evolving technological landscapes, addressing supply chain vulnerabilities, and meeting stringent sustainability standards.
Semiconductor Production Equipment Industry Segmentation
-
1. Type
- 1.1. Lithography Equipment
- 1.2. Etching Equipment
- 1.3. Deposition Equipment
- 1.4. Other Equipment Types
-
2. End-user Industry
- 2.1. Semiconductor Fabrication Plant
- 2.2. Semiconductor Electronics Manufacturing
Semiconductor Production Equipment Industry Segmentation By Geography
- 1. United States
- 2. Europe
- 3. China
- 4. South Korea
- 5. Taiwan
- 6. Japan
- 7. Latin America
- 8. Middle East and Africa
Semiconductor Production Equipment Industry REPORT HIGHLIGHTS
| Aspects | Details |
|---|---|
| Study Period | 2019-2033 |
| Base Year | 2024 |
| Estimated Year | 2025 |
| Forecast Period | 2025-2033 |
| Historical Period | 2019-2024 |
| Growth Rate | CAGR of 8.65% from 2019-2033 |
| Segmentation |
|
Table of Contents
- 1. Introduction
- 1.1. Research Scope
- 1.2. Market Segmentation
- 1.3. Research Methodology
- 1.4. Definitions and Assumptions
- 2. Executive Summary
- 2.1. Introduction
- 3. Market Dynamics
- 3.1. Introduction
- 3.2. Market Drivers
- 3.2.1 Increasing Needs of Consumer Electronic Devices Boosting the Manufacturing Prospects; Proliferation of Artificial Intelligence
- 3.2.2 IoT
- 3.2.3 and Connected Devices Across Industry Verticals
- 3.3. Market Restrains
- 3.3.1. Dynamic Nature of Technologies Requires Several Changes in Manufacturing Equipment
- 3.4. Market Trends
- 3.4.1. Semiconductor Fabrication Plant to be the Largest End-user Industry
- 4. Market Factor Analysis
- 4.1. Porters Five Forces
- 4.2. Supply/Value Chain
- 4.3. PESTEL analysis
- 4.4. Market Entropy
- 4.5. Patent/Trademark Analysis
- 5. Global Semiconductor Production Equipment Industry Analysis, Insights and Forecast, 2019-2031
- 5.1. Market Analysis, Insights and Forecast - by Type
- 5.1.1. Lithography Equipment
- 5.1.2. Etching Equipment
- 5.1.3. Deposition Equipment
- 5.1.4. Other Equipment Types
- 5.2. Market Analysis, Insights and Forecast - by End-user Industry
- 5.2.1. Semiconductor Fabrication Plant
- 5.2.2. Semiconductor Electronics Manufacturing
- 5.3. Market Analysis, Insights and Forecast - by Region
- 5.3.1. United States
- 5.3.2. Europe
- 5.3.3. China
- 5.3.4. South Korea
- 5.3.5. Taiwan
- 5.3.6. Japan
- 5.3.7. Latin America
- 5.3.8. Middle East and Africa
- 5.1. Market Analysis, Insights and Forecast - by Type
- 6. United States Semiconductor Production Equipment Industry Analysis, Insights and Forecast, 2019-2031
- 6.1. Market Analysis, Insights and Forecast - by Type
- 6.1.1. Lithography Equipment
- 6.1.2. Etching Equipment
- 6.1.3. Deposition Equipment
- 6.1.4. Other Equipment Types
- 6.2. Market Analysis, Insights and Forecast - by End-user Industry
- 6.2.1. Semiconductor Fabrication Plant
- 6.2.2. Semiconductor Electronics Manufacturing
- 6.1. Market Analysis, Insights and Forecast - by Type
- 7. Europe Semiconductor Production Equipment Industry Analysis, Insights and Forecast, 2019-2031
- 7.1. Market Analysis, Insights and Forecast - by Type
- 7.1.1. Lithography Equipment
- 7.1.2. Etching Equipment
- 7.1.3. Deposition Equipment
- 7.1.4. Other Equipment Types
- 7.2. Market Analysis, Insights and Forecast - by End-user Industry
- 7.2.1. Semiconductor Fabrication Plant
- 7.2.2. Semiconductor Electronics Manufacturing
- 7.1. Market Analysis, Insights and Forecast - by Type
- 8. China Semiconductor Production Equipment Industry Analysis, Insights and Forecast, 2019-2031
- 8.1. Market Analysis, Insights and Forecast - by Type
- 8.1.1. Lithography Equipment
- 8.1.2. Etching Equipment
- 8.1.3. Deposition Equipment
- 8.1.4. Other Equipment Types
- 8.2. Market Analysis, Insights and Forecast - by End-user Industry
- 8.2.1. Semiconductor Fabrication Plant
- 8.2.2. Semiconductor Electronics Manufacturing
- 8.1. Market Analysis, Insights and Forecast - by Type
- 9. South Korea Semiconductor Production Equipment Industry Analysis, Insights and Forecast, 2019-2031
- 9.1. Market Analysis, Insights and Forecast - by Type
- 9.1.1. Lithography Equipment
- 9.1.2. Etching Equipment
- 9.1.3. Deposition Equipment
- 9.1.4. Other Equipment Types
- 9.2. Market Analysis, Insights and Forecast - by End-user Industry
- 9.2.1. Semiconductor Fabrication Plant
- 9.2.2. Semiconductor Electronics Manufacturing
- 9.1. Market Analysis, Insights and Forecast - by Type
- 10. Taiwan Semiconductor Production Equipment Industry Analysis, Insights and Forecast, 2019-2031
- 10.1. Market Analysis, Insights and Forecast - by Type
- 10.1.1. Lithography Equipment
- 10.1.2. Etching Equipment
- 10.1.3. Deposition Equipment
- 10.1.4. Other Equipment Types
- 10.2. Market Analysis, Insights and Forecast - by End-user Industry
- 10.2.1. Semiconductor Fabrication Plant
- 10.2.2. Semiconductor Electronics Manufacturing
- 10.1. Market Analysis, Insights and Forecast - by Type
- 11. Japan Semiconductor Production Equipment Industry Analysis, Insights and Forecast, 2019-2031
- 11.1. Market Analysis, Insights and Forecast - by Type
- 11.1.1. Lithography Equipment
- 11.1.2. Etching Equipment
- 11.1.3. Deposition Equipment
- 11.1.4. Other Equipment Types
- 11.2. Market Analysis, Insights and Forecast - by End-user Industry
- 11.2.1. Semiconductor Fabrication Plant
- 11.2.2. Semiconductor Electronics Manufacturing
- 11.1. Market Analysis, Insights and Forecast - by Type
- 12. Latin America Semiconductor Production Equipment Industry Analysis, Insights and Forecast, 2019-2031
- 12.1. Market Analysis, Insights and Forecast - by Type
- 12.1.1. Lithography Equipment
- 12.1.2. Etching Equipment
- 12.1.3. Deposition Equipment
- 12.1.4. Other Equipment Types
- 12.2. Market Analysis, Insights and Forecast - by End-user Industry
- 12.2.1. Semiconductor Fabrication Plant
- 12.2.2. Semiconductor Electronics Manufacturing
- 12.1. Market Analysis, Insights and Forecast - by Type
- 13. Middle East and Africa Semiconductor Production Equipment Industry Analysis, Insights and Forecast, 2019-2031
- 13.1. Market Analysis, Insights and Forecast - by Type
- 13.1.1. Lithography Equipment
- 13.1.2. Etching Equipment
- 13.1.3. Deposition Equipment
- 13.1.4. Other Equipment Types
- 13.2. Market Analysis, Insights and Forecast - by End-user Industry
- 13.2.1. Semiconductor Fabrication Plant
- 13.2.2. Semiconductor Electronics Manufacturing
- 13.1. Market Analysis, Insights and Forecast - by Type
- 14. North America Semiconductor Production Equipment Industry Analysis, Insights and Forecast, 2019-2031
- 14.1. Market Analysis, Insights and Forecast - By Country/Sub-region
- 14.1.1 United States
- 14.1.2 Canada
- 14.1.3 Mexico
- 15. Europe Semiconductor Production Equipment Industry Analysis, Insights and Forecast, 2019-2031
- 15.1. Market Analysis, Insights and Forecast - By Country/Sub-region
- 15.1.1 Germany
- 15.1.2 United Kingdom
- 15.1.3 France
- 15.1.4 Spain
- 15.1.5 Italy
- 15.1.6 Spain
- 15.1.7 Belgium
- 15.1.8 Netherland
- 15.1.9 Nordics
- 15.1.10 Rest of Europe
- 16. Asia Pacific Semiconductor Production Equipment Industry Analysis, Insights and Forecast, 2019-2031
- 16.1. Market Analysis, Insights and Forecast - By Country/Sub-region
- 16.1.1 China
- 16.1.2 Japan
- 16.1.3 India
- 16.1.4 South Korea
- 16.1.5 Southeast Asia
- 16.1.6 Australia
- 16.1.7 Indonesia
- 16.1.8 Phillipes
- 16.1.9 Singapore
- 16.1.10 Thailandc
- 16.1.11 Rest of Asia Pacific
- 17. South America Semiconductor Production Equipment Industry Analysis, Insights and Forecast, 2019-2031
- 17.1. Market Analysis, Insights and Forecast - By Country/Sub-region
- 17.1.1 Brazil
- 17.1.2 Argentina
- 17.1.3 Peru
- 17.1.4 Chile
- 17.1.5 Colombia
- 17.1.6 Ecuador
- 17.1.7 Venezuela
- 17.1.8 Rest of South America
- 18. North America Semiconductor Production Equipment Industry Analysis, Insights and Forecast, 2019-2031
- 18.1. Market Analysis, Insights and Forecast - By Country/Sub-region
- 18.1.1 United States
- 18.1.2 Canada
- 18.1.3 Mexico
- 19. MEA Semiconductor Production Equipment Industry Analysis, Insights and Forecast, 2019-2031
- 19.1. Market Analysis, Insights and Forecast - By Country/Sub-region
- 19.1.1 United Arab Emirates
- 19.1.2 Saudi Arabia
- 19.1.3 South Africa
- 19.1.4 Rest of Middle East and Africa
- 20. Competitive Analysis
- 20.1. Global Market Share Analysis 2024
- 20.2. Company Profiles
- 20.2.1 KLA Corporation
- 20.2.1.1. Overview
- 20.2.1.2. Products
- 20.2.1.3. SWOT Analysis
- 20.2.1.4. Recent Developments
- 20.2.1.5. Financials (Based on Availability)
- 20.2.2 Nikon Corporation
- 20.2.2.1. Overview
- 20.2.2.2. Products
- 20.2.2.3. SWOT Analysis
- 20.2.2.4. Recent Developments
- 20.2.2.5. Financials (Based on Availability)
- 20.2.3 Applied Materials Inc
- 20.2.3.1. Overview
- 20.2.3.2. Products
- 20.2.3.3. SWOT Analysis
- 20.2.3.4. Recent Developments
- 20.2.3.5. Financials (Based on Availability)
- 20.2.4 Hitachi High -Technologies Corporation
- 20.2.4.1. Overview
- 20.2.4.2. Products
- 20.2.4.3. SWOT Analysis
- 20.2.4.4. Recent Developments
- 20.2.4.5. Financials (Based on Availability)
- 20.2.5 Screen Holdings Co Lt
- 20.2.5.1. Overview
- 20.2.5.2. Products
- 20.2.5.3. SWOT Analysis
- 20.2.5.4. Recent Developments
- 20.2.5.5. Financials (Based on Availability)
- 20.2.6 Plasma Therm
- 20.2.6.1. Overview
- 20.2.6.2. Products
- 20.2.6.3. SWOT Analysis
- 20.2.6.4. Recent Developments
- 20.2.6.5. Financials (Based on Availability)
- 20.2.7 Tokyo Electron Limited
- 20.2.7.1. Overview
- 20.2.7.2. Products
- 20.2.7.3. SWOT Analysis
- 20.2.7.4. Recent Developments
- 20.2.7.5. Financials (Based on Availability)
- 20.2.8 ASML Holding NV
- 20.2.8.1. Overview
- 20.2.8.2. Products
- 20.2.8.3. SWOT Analysis
- 20.2.8.4. Recent Developments
- 20.2.8.5. Financials (Based on Availability)
- 20.2.9 Carl Zeiss AG
- 20.2.9.1. Overview
- 20.2.9.2. Products
- 20.2.9.3. SWOT Analysis
- 20.2.9.4. Recent Developments
- 20.2.9.5. Financials (Based on Availability)
- 20.2.10 LAM Research Corporation
- 20.2.10.1. Overview
- 20.2.10.2. Products
- 20.2.10.3. SWOT Analysis
- 20.2.10.4. Recent Developments
- 20.2.10.5. Financials (Based on Availability)
- 20.2.11 VEECO Instruments Inc
- 20.2.11.1. Overview
- 20.2.11.2. Products
- 20.2.11.3. SWOT Analysis
- 20.2.11.4. Recent Developments
- 20.2.11.5. Financials (Based on Availability)
- 20.2.1 KLA Corporation
List of Figures
- Figure 1: Global Semiconductor Production Equipment Industry Revenue Breakdown (Million, %) by Region 2024 & 2032
- Figure 2: Global Semiconductor Production Equipment Industry Volume Breakdown (K Unit, %) by Region 2024 & 2032
- Figure 3: North America Semiconductor Production Equipment Industry Revenue (Million), by Country 2024 & 2032
- Figure 4: North America Semiconductor Production Equipment Industry Volume (K Unit), by Country 2024 & 2032
- Figure 5: North America Semiconductor Production Equipment Industry Revenue Share (%), by Country 2024 & 2032
- Figure 6: North America Semiconductor Production Equipment Industry Volume Share (%), by Country 2024 & 2032
- Figure 7: Europe Semiconductor Production Equipment Industry Revenue (Million), by Country 2024 & 2032
- Figure 8: Europe Semiconductor Production Equipment Industry Volume (K Unit), by Country 2024 & 2032
- Figure 9: Europe Semiconductor Production Equipment Industry Revenue Share (%), by Country 2024 & 2032
- Figure 10: Europe Semiconductor Production Equipment Industry Volume Share (%), by Country 2024 & 2032
- Figure 11: Asia Pacific Semiconductor Production Equipment Industry Revenue (Million), by Country 2024 & 2032
- Figure 12: Asia Pacific Semiconductor Production Equipment Industry Volume (K Unit), by Country 2024 & 2032
- Figure 13: Asia Pacific Semiconductor Production Equipment Industry Revenue Share (%), by Country 2024 & 2032
- Figure 14: Asia Pacific Semiconductor Production Equipment Industry Volume Share (%), by Country 2024 & 2032
- Figure 15: South America Semiconductor Production Equipment Industry Revenue (Million), by Country 2024 & 2032
- Figure 16: South America Semiconductor Production Equipment Industry Volume (K Unit), by Country 2024 & 2032
- Figure 17: South America Semiconductor Production Equipment Industry Revenue Share (%), by Country 2024 & 2032
- Figure 18: South America Semiconductor Production Equipment Industry Volume Share (%), by Country 2024 & 2032
- Figure 19: North America Semiconductor Production Equipment Industry Revenue (Million), by Country 2024 & 2032
- Figure 20: North America Semiconductor Production Equipment Industry Volume (K Unit), by Country 2024 & 2032
- Figure 21: North America Semiconductor Production Equipment Industry Revenue Share (%), by Country 2024 & 2032
- Figure 22: North America Semiconductor Production Equipment Industry Volume Share (%), by Country 2024 & 2032
- Figure 23: MEA Semiconductor Production Equipment Industry Revenue (Million), by Country 2024 & 2032
- Figure 24: MEA Semiconductor Production Equipment Industry Volume (K Unit), by Country 2024 & 2032
- Figure 25: MEA Semiconductor Production Equipment Industry Revenue Share (%), by Country 2024 & 2032
- Figure 26: MEA Semiconductor Production Equipment Industry Volume Share (%), by Country 2024 & 2032
- Figure 27: United States Semiconductor Production Equipment Industry Revenue (Million), by Type 2024 & 2032
- Figure 28: United States Semiconductor Production Equipment Industry Volume (K Unit), by Type 2024 & 2032
- Figure 29: United States Semiconductor Production Equipment Industry Revenue Share (%), by Type 2024 & 2032
- Figure 30: United States Semiconductor Production Equipment Industry Volume Share (%), by Type 2024 & 2032
- Figure 31: United States Semiconductor Production Equipment Industry Revenue (Million), by End-user Industry 2024 & 2032
- Figure 32: United States Semiconductor Production Equipment Industry Volume (K Unit), by End-user Industry 2024 & 2032
- Figure 33: United States Semiconductor Production Equipment Industry Revenue Share (%), by End-user Industry 2024 & 2032
- Figure 34: United States Semiconductor Production Equipment Industry Volume Share (%), by End-user Industry 2024 & 2032
- Figure 35: United States Semiconductor Production Equipment Industry Revenue (Million), by Country 2024 & 2032
- Figure 36: United States Semiconductor Production Equipment Industry Volume (K Unit), by Country 2024 & 2032
- Figure 37: United States Semiconductor Production Equipment Industry Revenue Share (%), by Country 2024 & 2032
- Figure 38: United States Semiconductor Production Equipment Industry Volume Share (%), by Country 2024 & 2032
- Figure 39: Europe Semiconductor Production Equipment Industry Revenue (Million), by Type 2024 & 2032
- Figure 40: Europe Semiconductor Production Equipment Industry Volume (K Unit), by Type 2024 & 2032
- Figure 41: Europe Semiconductor Production Equipment Industry Revenue Share (%), by Type 2024 & 2032
- Figure 42: Europe Semiconductor Production Equipment Industry Volume Share (%), by Type 2024 & 2032
- Figure 43: Europe Semiconductor Production Equipment Industry Revenue (Million), by End-user Industry 2024 & 2032
- Figure 44: Europe Semiconductor Production Equipment Industry Volume (K Unit), by End-user Industry 2024 & 2032
- Figure 45: Europe Semiconductor Production Equipment Industry Revenue Share (%), by End-user Industry 2024 & 2032
- Figure 46: Europe Semiconductor Production Equipment Industry Volume Share (%), by End-user Industry 2024 & 2032
- Figure 47: Europe Semiconductor Production Equipment Industry Revenue (Million), by Country 2024 & 2032
- Figure 48: Europe Semiconductor Production Equipment Industry Volume (K Unit), by Country 2024 & 2032
- Figure 49: Europe Semiconductor Production Equipment Industry Revenue Share (%), by Country 2024 & 2032
- Figure 50: Europe Semiconductor Production Equipment Industry Volume Share (%), by Country 2024 & 2032
- Figure 51: China Semiconductor Production Equipment Industry Revenue (Million), by Type 2024 & 2032
- Figure 52: China Semiconductor Production Equipment Industry Volume (K Unit), by Type 2024 & 2032
- Figure 53: China Semiconductor Production Equipment Industry Revenue Share (%), by Type 2024 & 2032
- Figure 54: China Semiconductor Production Equipment Industry Volume Share (%), by Type 2024 & 2032
- Figure 55: China Semiconductor Production Equipment Industry Revenue (Million), by End-user Industry 2024 & 2032
- Figure 56: China Semiconductor Production Equipment Industry Volume (K Unit), by End-user Industry 2024 & 2032
- Figure 57: China Semiconductor Production Equipment Industry Revenue Share (%), by End-user Industry 2024 & 2032
- Figure 58: China Semiconductor Production Equipment Industry Volume Share (%), by End-user Industry 2024 & 2032
- Figure 59: China Semiconductor Production Equipment Industry Revenue (Million), by Country 2024 & 2032
- Figure 60: China Semiconductor Production Equipment Industry Volume (K Unit), by Country 2024 & 2032
- Figure 61: China Semiconductor Production Equipment Industry Revenue Share (%), by Country 2024 & 2032
- Figure 62: China Semiconductor Production Equipment Industry Volume Share (%), by Country 2024 & 2032
- Figure 63: South Korea Semiconductor Production Equipment Industry Revenue (Million), by Type 2024 & 2032
- Figure 64: South Korea Semiconductor Production Equipment Industry Volume (K Unit), by Type 2024 & 2032
- Figure 65: South Korea Semiconductor Production Equipment Industry Revenue Share (%), by Type 2024 & 2032
- Figure 66: South Korea Semiconductor Production Equipment Industry Volume Share (%), by Type 2024 & 2032
- Figure 67: South Korea Semiconductor Production Equipment Industry Revenue (Million), by End-user Industry 2024 & 2032
- Figure 68: South Korea Semiconductor Production Equipment Industry Volume (K Unit), by End-user Industry 2024 & 2032
- Figure 69: South Korea Semiconductor Production Equipment Industry Revenue Share (%), by End-user Industry 2024 & 2032
- Figure 70: South Korea Semiconductor Production Equipment Industry Volume Share (%), by End-user Industry 2024 & 2032
- Figure 71: South Korea Semiconductor Production Equipment Industry Revenue (Million), by Country 2024 & 2032
- Figure 72: South Korea Semiconductor Production Equipment Industry Volume (K Unit), by Country 2024 & 2032
- Figure 73: South Korea Semiconductor Production Equipment Industry Revenue Share (%), by Country 2024 & 2032
- Figure 74: South Korea Semiconductor Production Equipment Industry Volume Share (%), by Country 2024 & 2032
- Figure 75: Taiwan Semiconductor Production Equipment Industry Revenue (Million), by Type 2024 & 2032
- Figure 76: Taiwan Semiconductor Production Equipment Industry Volume (K Unit), by Type 2024 & 2032
- Figure 77: Taiwan Semiconductor Production Equipment Industry Revenue Share (%), by Type 2024 & 2032
- Figure 78: Taiwan Semiconductor Production Equipment Industry Volume Share (%), by Type 2024 & 2032
- Figure 79: Taiwan Semiconductor Production Equipment Industry Revenue (Million), by End-user Industry 2024 & 2032
- Figure 80: Taiwan Semiconductor Production Equipment Industry Volume (K Unit), by End-user Industry 2024 & 2032
- Figure 81: Taiwan Semiconductor Production Equipment Industry Revenue Share (%), by End-user Industry 2024 & 2032
- Figure 82: Taiwan Semiconductor Production Equipment Industry Volume Share (%), by End-user Industry 2024 & 2032
- Figure 83: Taiwan Semiconductor Production Equipment Industry Revenue (Million), by Country 2024 & 2032
- Figure 84: Taiwan Semiconductor Production Equipment Industry Volume (K Unit), by Country 2024 & 2032
- Figure 85: Taiwan Semiconductor Production Equipment Industry Revenue Share (%), by Country 2024 & 2032
- Figure 86: Taiwan Semiconductor Production Equipment Industry Volume Share (%), by Country 2024 & 2032
- Figure 87: Japan Semiconductor Production Equipment Industry Revenue (Million), by Type 2024 & 2032
- Figure 88: Japan Semiconductor Production Equipment Industry Volume (K Unit), by Type 2024 & 2032
- Figure 89: Japan Semiconductor Production Equipment Industry Revenue Share (%), by Type 2024 & 2032
- Figure 90: Japan Semiconductor Production Equipment Industry Volume Share (%), by Type 2024 & 2032
- Figure 91: Japan Semiconductor Production Equipment Industry Revenue (Million), by End-user Industry 2024 & 2032
- Figure 92: Japan Semiconductor Production Equipment Industry Volume (K Unit), by End-user Industry 2024 & 2032
- Figure 93: Japan Semiconductor Production Equipment Industry Revenue Share (%), by End-user Industry 2024 & 2032
- Figure 94: Japan Semiconductor Production Equipment Industry Volume Share (%), by End-user Industry 2024 & 2032
- Figure 95: Japan Semiconductor Production Equipment Industry Revenue (Million), by Country 2024 & 2032
- Figure 96: Japan Semiconductor Production Equipment Industry Volume (K Unit), by Country 2024 & 2032
- Figure 97: Japan Semiconductor Production Equipment Industry Revenue Share (%), by Country 2024 & 2032
- Figure 98: Japan Semiconductor Production Equipment Industry Volume Share (%), by Country 2024 & 2032
- Figure 99: Latin America Semiconductor Production Equipment Industry Revenue (Million), by Type 2024 & 2032
- Figure 100: Latin America Semiconductor Production Equipment Industry Volume (K Unit), by Type 2024 & 2032
- Figure 101: Latin America Semiconductor Production Equipment Industry Revenue Share (%), by Type 2024 & 2032
- Figure 102: Latin America Semiconductor Production Equipment Industry Volume Share (%), by Type 2024 & 2032
- Figure 103: Latin America Semiconductor Production Equipment Industry Revenue (Million), by End-user Industry 2024 & 2032
- Figure 104: Latin America Semiconductor Production Equipment Industry Volume (K Unit), by End-user Industry 2024 & 2032
- Figure 105: Latin America Semiconductor Production Equipment Industry Revenue Share (%), by End-user Industry 2024 & 2032
- Figure 106: Latin America Semiconductor Production Equipment Industry Volume Share (%), by End-user Industry 2024 & 2032
- Figure 107: Latin America Semiconductor Production Equipment Industry Revenue (Million), by Country 2024 & 2032
- Figure 108: Latin America Semiconductor Production Equipment Industry Volume (K Unit), by Country 2024 & 2032
- Figure 109: Latin America Semiconductor Production Equipment Industry Revenue Share (%), by Country 2024 & 2032
- Figure 110: Latin America Semiconductor Production Equipment Industry Volume Share (%), by Country 2024 & 2032
- Figure 111: Middle East and Africa Semiconductor Production Equipment Industry Revenue (Million), by Type 2024 & 2032
- Figure 112: Middle East and Africa Semiconductor Production Equipment Industry Volume (K Unit), by Type 2024 & 2032
- Figure 113: Middle East and Africa Semiconductor Production Equipment Industry Revenue Share (%), by Type 2024 & 2032
- Figure 114: Middle East and Africa Semiconductor Production Equipment Industry Volume Share (%), by Type 2024 & 2032
- Figure 115: Middle East and Africa Semiconductor Production Equipment Industry Revenue (Million), by End-user Industry 2024 & 2032
- Figure 116: Middle East and Africa Semiconductor Production Equipment Industry Volume (K Unit), by End-user Industry 2024 & 2032
- Figure 117: Middle East and Africa Semiconductor Production Equipment Industry Revenue Share (%), by End-user Industry 2024 & 2032
- Figure 118: Middle East and Africa Semiconductor Production Equipment Industry Volume Share (%), by End-user Industry 2024 & 2032
- Figure 119: Middle East and Africa Semiconductor Production Equipment Industry Revenue (Million), by Country 2024 & 2032
- Figure 120: Middle East and Africa Semiconductor Production Equipment Industry Volume (K Unit), by Country 2024 & 2032
- Figure 121: Middle East and Africa Semiconductor Production Equipment Industry Revenue Share (%), by Country 2024 & 2032
- Figure 122: Middle East and Africa Semiconductor Production Equipment Industry Volume Share (%), by Country 2024 & 2032
List of Tables
- Table 1: Global Semiconductor Production Equipment Industry Revenue Million Forecast, by Region 2019 & 2032
- Table 2: Global Semiconductor Production Equipment Industry Volume K Unit Forecast, by Region 2019 & 2032
- Table 3: Global Semiconductor Production Equipment Industry Revenue Million Forecast, by Type 2019 & 2032
- Table 4: Global Semiconductor Production Equipment Industry Volume K Unit Forecast, by Type 2019 & 2032
- Table 5: Global Semiconductor Production Equipment Industry Revenue Million Forecast, by End-user Industry 2019 & 2032
- Table 6: Global Semiconductor Production Equipment Industry Volume K Unit Forecast, by End-user Industry 2019 & 2032
- Table 7: Global Semiconductor Production Equipment Industry Revenue Million Forecast, by Region 2019 & 2032
- Table 8: Global Semiconductor Production Equipment Industry Volume K Unit Forecast, by Region 2019 & 2032
- Table 9: Global Semiconductor Production Equipment Industry Revenue Million Forecast, by Country 2019 & 2032
- Table 10: Global Semiconductor Production Equipment Industry Volume K Unit Forecast, by Country 2019 & 2032
- Table 11: United States Semiconductor Production Equipment Industry Revenue (Million) Forecast, by Application 2019 & 2032
- Table 12: United States Semiconductor Production Equipment Industry Volume (K Unit) Forecast, by Application 2019 & 2032
- Table 13: Canada Semiconductor Production Equipment Industry Revenue (Million) Forecast, by Application 2019 & 2032
- Table 14: Canada Semiconductor Production Equipment Industry Volume (K Unit) Forecast, by Application 2019 & 2032
- Table 15: Mexico Semiconductor Production Equipment Industry Revenue (Million) Forecast, by Application 2019 & 2032
- Table 16: Mexico Semiconductor Production Equipment Industry Volume (K Unit) Forecast, by Application 2019 & 2032
- Table 17: Global Semiconductor Production Equipment Industry Revenue Million Forecast, by Country 2019 & 2032
- Table 18: Global Semiconductor Production Equipment Industry Volume K Unit Forecast, by Country 2019 & 2032
- Table 19: Germany Semiconductor Production Equipment Industry Revenue (Million) Forecast, by Application 2019 & 2032
- Table 20: Germany Semiconductor Production Equipment Industry Volume (K Unit) Forecast, by Application 2019 & 2032
- Table 21: United Kingdom Semiconductor Production Equipment Industry Revenue (Million) Forecast, by Application 2019 & 2032
- Table 22: United Kingdom Semiconductor Production Equipment Industry Volume (K Unit) Forecast, by Application 2019 & 2032
- Table 23: France Semiconductor Production Equipment Industry Revenue (Million) Forecast, by Application 2019 & 2032
- Table 24: France Semiconductor Production Equipment Industry Volume (K Unit) Forecast, by Application 2019 & 2032
- Table 25: Spain Semiconductor Production Equipment Industry Revenue (Million) Forecast, by Application 2019 & 2032
- Table 26: Spain Semiconductor Production Equipment Industry Volume (K Unit) Forecast, by Application 2019 & 2032
- Table 27: Italy Semiconductor Production Equipment Industry Revenue (Million) Forecast, by Application 2019 & 2032
- Table 28: Italy Semiconductor Production Equipment Industry Volume (K Unit) Forecast, by Application 2019 & 2032
- Table 29: Spain Semiconductor Production Equipment Industry Revenue (Million) Forecast, by Application 2019 & 2032
- Table 30: Spain Semiconductor Production Equipment Industry Volume (K Unit) Forecast, by Application 2019 & 2032
- Table 31: Belgium Semiconductor Production Equipment Industry Revenue (Million) Forecast, by Application 2019 & 2032
- Table 32: Belgium Semiconductor Production Equipment Industry Volume (K Unit) Forecast, by Application 2019 & 2032
- Table 33: Netherland Semiconductor Production Equipment Industry Revenue (Million) Forecast, by Application 2019 & 2032
- Table 34: Netherland Semiconductor Production Equipment Industry Volume (K Unit) Forecast, by Application 2019 & 2032
- Table 35: Nordics Semiconductor Production Equipment Industry Revenue (Million) Forecast, by Application 2019 & 2032
- Table 36: Nordics Semiconductor Production Equipment Industry Volume (K Unit) Forecast, by Application 2019 & 2032
- Table 37: Rest of Europe Semiconductor Production Equipment Industry Revenue (Million) Forecast, by Application 2019 & 2032
- Table 38: Rest of Europe Semiconductor Production Equipment Industry Volume (K Unit) Forecast, by Application 2019 & 2032
- Table 39: Global Semiconductor Production Equipment Industry Revenue Million Forecast, by Country 2019 & 2032
- Table 40: Global Semiconductor Production Equipment Industry Volume K Unit Forecast, by Country 2019 & 2032
- Table 41: China Semiconductor Production Equipment Industry Revenue (Million) Forecast, by Application 2019 & 2032
- Table 42: China Semiconductor Production Equipment Industry Volume (K Unit) Forecast, by Application 2019 & 2032
- Table 43: Japan Semiconductor Production Equipment Industry Revenue (Million) Forecast, by Application 2019 & 2032
- Table 44: Japan Semiconductor Production Equipment Industry Volume (K Unit) Forecast, by Application 2019 & 2032
- Table 45: India Semiconductor Production Equipment Industry Revenue (Million) Forecast, by Application 2019 & 2032
- Table 46: India Semiconductor Production Equipment Industry Volume (K Unit) Forecast, by Application 2019 & 2032
- Table 47: South Korea Semiconductor Production Equipment Industry Revenue (Million) Forecast, by Application 2019 & 2032
- Table 48: South Korea Semiconductor Production Equipment Industry Volume (K Unit) Forecast, by Application 2019 & 2032
- Table 49: Southeast Asia Semiconductor Production Equipment Industry Revenue (Million) Forecast, by Application 2019 & 2032
- Table 50: Southeast Asia Semiconductor Production Equipment Industry Volume (K Unit) Forecast, by Application 2019 & 2032
- Table 51: Australia Semiconductor Production Equipment Industry Revenue (Million) Forecast, by Application 2019 & 2032
- Table 52: Australia Semiconductor Production Equipment Industry Volume (K Unit) Forecast, by Application 2019 & 2032
- Table 53: Indonesia Semiconductor Production Equipment Industry Revenue (Million) Forecast, by Application 2019 & 2032
- Table 54: Indonesia Semiconductor Production Equipment Industry Volume (K Unit) Forecast, by Application 2019 & 2032
- Table 55: Phillipes Semiconductor Production Equipment Industry Revenue (Million) Forecast, by Application 2019 & 2032
- Table 56: Phillipes Semiconductor Production Equipment Industry Volume (K Unit) Forecast, by Application 2019 & 2032
- Table 57: Singapore Semiconductor Production Equipment Industry Revenue (Million) Forecast, by Application 2019 & 2032
- Table 58: Singapore Semiconductor Production Equipment Industry Volume (K Unit) Forecast, by Application 2019 & 2032
- Table 59: Thailandc Semiconductor Production Equipment Industry Revenue (Million) Forecast, by Application 2019 & 2032
- Table 60: Thailandc Semiconductor Production Equipment Industry Volume (K Unit) Forecast, by Application 2019 & 2032
- Table 61: Rest of Asia Pacific Semiconductor Production Equipment Industry Revenue (Million) Forecast, by Application 2019 & 2032
- Table 62: Rest of Asia Pacific Semiconductor Production Equipment Industry Volume (K Unit) Forecast, by Application 2019 & 2032
- Table 63: Global Semiconductor Production Equipment Industry Revenue Million Forecast, by Country 2019 & 2032
- Table 64: Global Semiconductor Production Equipment Industry Volume K Unit Forecast, by Country 2019 & 2032
- Table 65: Brazil Semiconductor Production Equipment Industry Revenue (Million) Forecast, by Application 2019 & 2032
- Table 66: Brazil Semiconductor Production Equipment Industry Volume (K Unit) Forecast, by Application 2019 & 2032
- Table 67: Argentina Semiconductor Production Equipment Industry Revenue (Million) Forecast, by Application 2019 & 2032
- Table 68: Argentina Semiconductor Production Equipment Industry Volume (K Unit) Forecast, by Application 2019 & 2032
- Table 69: Peru Semiconductor Production Equipment Industry Revenue (Million) Forecast, by Application 2019 & 2032
- Table 70: Peru Semiconductor Production Equipment Industry Volume (K Unit) Forecast, by Application 2019 & 2032
- Table 71: Chile Semiconductor Production Equipment Industry Revenue (Million) Forecast, by Application 2019 & 2032
- Table 72: Chile Semiconductor Production Equipment Industry Volume (K Unit) Forecast, by Application 2019 & 2032
- Table 73: Colombia Semiconductor Production Equipment Industry Revenue (Million) Forecast, by Application 2019 & 2032
- Table 74: Colombia Semiconductor Production Equipment Industry Volume (K Unit) Forecast, by Application 2019 & 2032
- Table 75: Ecuador Semiconductor Production Equipment Industry Revenue (Million) Forecast, by Application 2019 & 2032
- Table 76: Ecuador Semiconductor Production Equipment Industry Volume (K Unit) Forecast, by Application 2019 & 2032
- Table 77: Venezuela Semiconductor Production Equipment Industry Revenue (Million) Forecast, by Application 2019 & 2032
- Table 78: Venezuela Semiconductor Production Equipment Industry Volume (K Unit) Forecast, by Application 2019 & 2032
- Table 79: Rest of South America Semiconductor Production Equipment Industry Revenue (Million) Forecast, by Application 2019 & 2032
- Table 80: Rest of South America Semiconductor Production Equipment Industry Volume (K Unit) Forecast, by Application 2019 & 2032
- Table 81: Global Semiconductor Production Equipment Industry Revenue Million Forecast, by Country 2019 & 2032
- Table 82: Global Semiconductor Production Equipment Industry Volume K Unit Forecast, by Country 2019 & 2032
- Table 83: United States Semiconductor Production Equipment Industry Revenue (Million) Forecast, by Application 2019 & 2032
- Table 84: United States Semiconductor Production Equipment Industry Volume (K Unit) Forecast, by Application 2019 & 2032
- Table 85: Canada Semiconductor Production Equipment Industry Revenue (Million) Forecast, by Application 2019 & 2032
- Table 86: Canada Semiconductor Production Equipment Industry Volume (K Unit) Forecast, by Application 2019 & 2032
- Table 87: Mexico Semiconductor Production Equipment Industry Revenue (Million) Forecast, by Application 2019 & 2032
- Table 88: Mexico Semiconductor Production Equipment Industry Volume (K Unit) Forecast, by Application 2019 & 2032
- Table 89: Global Semiconductor Production Equipment Industry Revenue Million Forecast, by Country 2019 & 2032
- Table 90: Global Semiconductor Production Equipment Industry Volume K Unit Forecast, by Country 2019 & 2032
- Table 91: United Arab Emirates Semiconductor Production Equipment Industry Revenue (Million) Forecast, by Application 2019 & 2032
- Table 92: United Arab Emirates Semiconductor Production Equipment Industry Volume (K Unit) Forecast, by Application 2019 & 2032
- Table 93: Saudi Arabia Semiconductor Production Equipment Industry Revenue (Million) Forecast, by Application 2019 & 2032
- Table 94: Saudi Arabia Semiconductor Production Equipment Industry Volume (K Unit) Forecast, by Application 2019 & 2032
- Table 95: South Africa Semiconductor Production Equipment Industry Revenue (Million) Forecast, by Application 2019 & 2032
- Table 96: South Africa Semiconductor Production Equipment Industry Volume (K Unit) Forecast, by Application 2019 & 2032
- Table 97: Rest of Middle East and Africa Semiconductor Production Equipment Industry Revenue (Million) Forecast, by Application 2019 & 2032
- Table 98: Rest of Middle East and Africa Semiconductor Production Equipment Industry Volume (K Unit) Forecast, by Application 2019 & 2032
- Table 99: Global Semiconductor Production Equipment Industry Revenue Million Forecast, by Type 2019 & 2032
- Table 100: Global Semiconductor Production Equipment Industry Volume K Unit Forecast, by Type 2019 & 2032
- Table 101: Global Semiconductor Production Equipment Industry Revenue Million Forecast, by End-user Industry 2019 & 2032
- Table 102: Global Semiconductor Production Equipment Industry Volume K Unit Forecast, by End-user Industry 2019 & 2032
- Table 103: Global Semiconductor Production Equipment Industry Revenue Million Forecast, by Country 2019 & 2032
- Table 104: Global Semiconductor Production Equipment Industry Volume K Unit Forecast, by Country 2019 & 2032
- Table 105: Global Semiconductor Production Equipment Industry Revenue Million Forecast, by Type 2019 & 2032
- Table 106: Global Semiconductor Production Equipment Industry Volume K Unit Forecast, by Type 2019 & 2032
- Table 107: Global Semiconductor Production Equipment Industry Revenue Million Forecast, by End-user Industry 2019 & 2032
- Table 108: Global Semiconductor Production Equipment Industry Volume K Unit Forecast, by End-user Industry 2019 & 2032
- Table 109: Global Semiconductor Production Equipment Industry Revenue Million Forecast, by Country 2019 & 2032
- Table 110: Global Semiconductor Production Equipment Industry Volume K Unit Forecast, by Country 2019 & 2032
- Table 111: Global Semiconductor Production Equipment Industry Revenue Million Forecast, by Type 2019 & 2032
- Table 112: Global Semiconductor Production Equipment Industry Volume K Unit Forecast, by Type 2019 & 2032
- Table 113: Global Semiconductor Production Equipment Industry Revenue Million Forecast, by End-user Industry 2019 & 2032
- Table 114: Global Semiconductor Production Equipment Industry Volume K Unit Forecast, by End-user Industry 2019 & 2032
- Table 115: Global Semiconductor Production Equipment Industry Revenue Million Forecast, by Country 2019 & 2032
- Table 116: Global Semiconductor Production Equipment Industry Volume K Unit Forecast, by Country 2019 & 2032
- Table 117: Global Semiconductor Production Equipment Industry Revenue Million Forecast, by Type 2019 & 2032
- Table 118: Global Semiconductor Production Equipment Industry Volume K Unit Forecast, by Type 2019 & 2032
- Table 119: Global Semiconductor Production Equipment Industry Revenue Million Forecast, by End-user Industry 2019 & 2032
- Table 120: Global Semiconductor Production Equipment Industry Volume K Unit Forecast, by End-user Industry 2019 & 2032
- Table 121: Global Semiconductor Production Equipment Industry Revenue Million Forecast, by Country 2019 & 2032
- Table 122: Global Semiconductor Production Equipment Industry Volume K Unit Forecast, by Country 2019 & 2032
- Table 123: Global Semiconductor Production Equipment Industry Revenue Million Forecast, by Type 2019 & 2032
- Table 124: Global Semiconductor Production Equipment Industry Volume K Unit Forecast, by Type 2019 & 2032
- Table 125: Global Semiconductor Production Equipment Industry Revenue Million Forecast, by End-user Industry 2019 & 2032
- Table 126: Global Semiconductor Production Equipment Industry Volume K Unit Forecast, by End-user Industry 2019 & 2032
- Table 127: Global Semiconductor Production Equipment Industry Revenue Million Forecast, by Country 2019 & 2032
- Table 128: Global Semiconductor Production Equipment Industry Volume K Unit Forecast, by Country 2019 & 2032
- Table 129: Global Semiconductor Production Equipment Industry Revenue Million Forecast, by Type 2019 & 2032
- Table 130: Global Semiconductor Production Equipment Industry Volume K Unit Forecast, by Type 2019 & 2032
- Table 131: Global Semiconductor Production Equipment Industry Revenue Million Forecast, by End-user Industry 2019 & 2032
- Table 132: Global Semiconductor Production Equipment Industry Volume K Unit Forecast, by End-user Industry 2019 & 2032
- Table 133: Global Semiconductor Production Equipment Industry Revenue Million Forecast, by Country 2019 & 2032
- Table 134: Global Semiconductor Production Equipment Industry Volume K Unit Forecast, by Country 2019 & 2032
- Table 135: Global Semiconductor Production Equipment Industry Revenue Million Forecast, by Type 2019 & 2032
- Table 136: Global Semiconductor Production Equipment Industry Volume K Unit Forecast, by Type 2019 & 2032
- Table 137: Global Semiconductor Production Equipment Industry Revenue Million Forecast, by End-user Industry 2019 & 2032
- Table 138: Global Semiconductor Production Equipment Industry Volume K Unit Forecast, by End-user Industry 2019 & 2032
- Table 139: Global Semiconductor Production Equipment Industry Revenue Million Forecast, by Country 2019 & 2032
- Table 140: Global Semiconductor Production Equipment Industry Volume K Unit Forecast, by Country 2019 & 2032
- Table 141: Global Semiconductor Production Equipment Industry Revenue Million Forecast, by Type 2019 & 2032
- Table 142: Global Semiconductor Production Equipment Industry Volume K Unit Forecast, by Type 2019 & 2032
- Table 143: Global Semiconductor Production Equipment Industry Revenue Million Forecast, by End-user Industry 2019 & 2032
- Table 144: Global Semiconductor Production Equipment Industry Volume K Unit Forecast, by End-user Industry 2019 & 2032
- Table 145: Global Semiconductor Production Equipment Industry Revenue Million Forecast, by Country 2019 & 2032
- Table 146: Global Semiconductor Production Equipment Industry Volume K Unit Forecast, by Country 2019 & 2032
Frequently Asked Questions
1. What is the projected Compound Annual Growth Rate (CAGR) of the Semiconductor Production Equipment Industry?
The projected CAGR is approximately 8.65%.
2. Which companies are prominent players in the Semiconductor Production Equipment Industry?
Key companies in the market include KLA Corporation, Nikon Corporation, Applied Materials Inc, Hitachi High -Technologies Corporation, Screen Holdings Co Lt, Plasma Therm, Tokyo Electron Limited, ASML Holding NV, Carl Zeiss AG, LAM Research Corporation, VEECO Instruments Inc.
3. What are the main segments of the Semiconductor Production Equipment Industry?
The market segments include Type, End-user Industry.
4. Can you provide details about the market size?
The market size is estimated to be USD 99.36 Million as of 2022.
5. What are some drivers contributing to market growth?
Increasing Needs of Consumer Electronic Devices Boosting the Manufacturing Prospects; Proliferation of Artificial Intelligence. IoT. and Connected Devices Across Industry Verticals.
6. What are the notable trends driving market growth?
Semiconductor Fabrication Plant to be the Largest End-user Industry.
7. Are there any restraints impacting market growth?
Dynamic Nature of Technologies Requires Several Changes in Manufacturing Equipment.
8. Can you provide examples of recent developments in the market?
February 2024 - At the SPIE Advanced Lithography + Patterning conference, Applied Materials unveiled a new lineup of products to address the intricate patterning demands of chips in the "Angstrom era," specifically at 2nm and below process nodes. The portfolio leverages innovative materials engineering and metrology techniques to tackle challenges associated with EUV and high-NA EUV patterning, such as line edge roughness and edge placement errors. This expansion in Applied Materials' Patterning Solutions Portfolio aims to assist chipmakers in navigating issues like tip-to-tip spacing limitations and bridge defects as they advance towards increasingly minuscule chip dimensions.
9. What pricing options are available for accessing the report?
Pricing options include single-user, multi-user, and enterprise licenses priced at USD 4750, USD 5250, and USD 8750 respectively.
10. Is the market size provided in terms of value or volume?
The market size is provided in terms of value, measured in Million and volume, measured in K Unit.
11. Are there any specific market keywords associated with the report?
Yes, the market keyword associated with the report is "Semiconductor Production Equipment Industry," which aids in identifying and referencing the specific market segment covered.
12. How do I determine which pricing option suits my needs best?
The pricing options vary based on user requirements and access needs. Individual users may opt for single-user licenses, while businesses requiring broader access may choose multi-user or enterprise licenses for cost-effective access to the report.
13. Are there any additional resources or data provided in the Semiconductor Production Equipment Industry report?
While the report offers comprehensive insights, it's advisable to review the specific contents or supplementary materials provided to ascertain if additional resources or data are available.
14. How can I stay updated on further developments or reports in the Semiconductor Production Equipment Industry?
To stay informed about further developments, trends, and reports in the Semiconductor Production Equipment Industry, consider subscribing to industry newsletters, following relevant companies and organizations, or regularly checking reputable industry news sources and publications.
Methodology
Step 1 - Identification of Relevant Samples Size from Population Database


Step 2 - Approaches for Defining Global Market Size (Value, Volume* & Price*)

Note*: In applicable scenarios
Step 3 - Data Sources
Primary Research
- Web Analytics
- Survey Reports
- Research Institute
- Latest Research Reports
- Opinion Leaders
Secondary Research
- Annual Reports
- White Paper
- Latest Press Release
- Industry Association
- Paid Database
- Investor Presentations

Step 4 - Data Triangulation
Involves using different sources of information in order to increase the validity of a study
These sources are likely to be stakeholders in a program - participants, other researchers, program staff, other community members, and so on.
Then we put all data in single framework & apply various statistical tools to find out the dynamic on the market.
During the analysis stage, feedback from the stakeholder groups would be compared to determine areas of agreement as well as areas of divergence


