

Key Insights
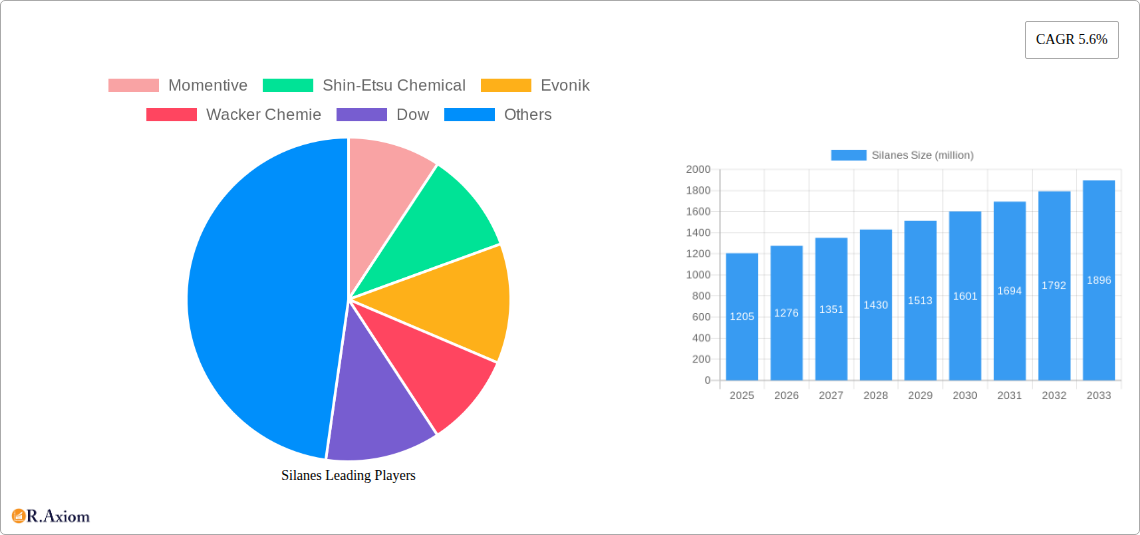
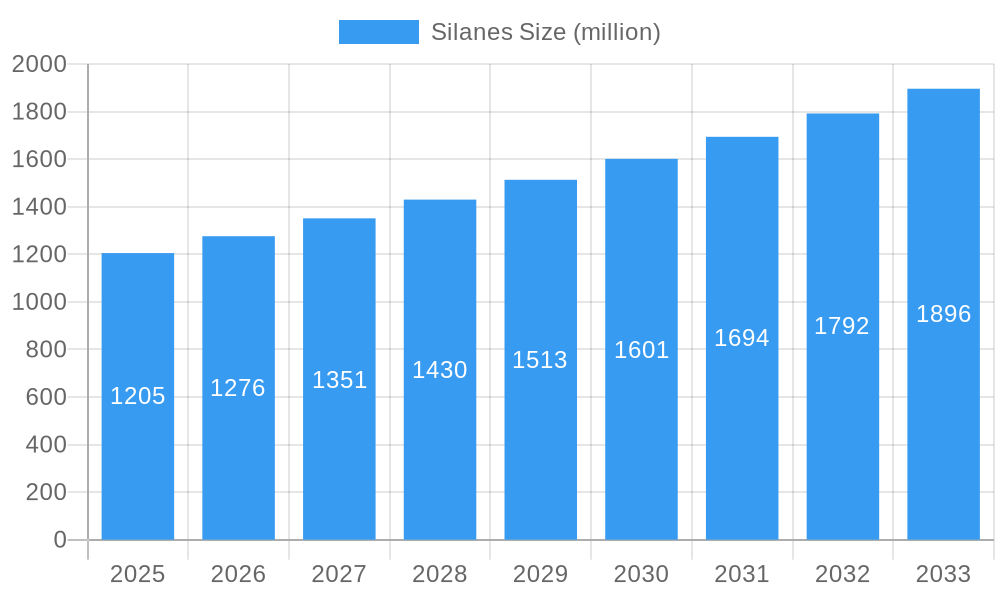
The global silanes market, valued at $1205 million in 2025, is projected to experience robust growth, driven by increasing demand across diverse sectors. The 5.6% CAGR from 2025 to 2033 indicates a significant expansion, fueled by several key factors. The rising construction industry, particularly in developing economies, necessitates substantial use of silanes in sealants, adhesives, and coatings, boosting market volume. Furthermore, the growth of the automotive and electronics industries contributes significantly, with silanes playing a crucial role in enhancing material properties and durability. Technological advancements leading to the development of high-performance silanes with improved efficiency and sustainability are further propelling market expansion. While potential supply chain disruptions and raw material price fluctuations could pose challenges, the overall market outlook remains positive, driven by continuous innovation and expanding application areas.
Silanes Market Size (In Billion)
Despite potential headwinds, the long-term prospects for silanes remain bright. The increasing focus on sustainable materials and environmentally friendly construction practices is fostering demand for silane-based solutions that offer enhanced durability and longevity. Moreover, ongoing research and development efforts are expected to yield novel silane applications in emerging fields, such as renewable energy and advanced materials manufacturing. Major players like Momentive, Shin-Etsu Chemical, and Evonik are actively investing in research and development, aiming to enhance product offerings and expand their market share. This competitive landscape, coupled with the inherent growth drivers, strongly suggests a promising future for the global silanes market throughout the forecast period.
Silanes Company Market Share
This comprehensive report provides a detailed analysis of the global silanes market, offering invaluable insights for industry stakeholders, investors, and researchers. Covering the period from 2019 to 2033, with a focus on 2025, this report meticulously examines market dynamics, growth drivers, challenges, and future opportunities. The study incorporates rigorous data analysis and forecasts, utilizing both historical data and predictive modeling to provide a robust and reliable outlook for the silanes market. The report's findings are supported by extensive research, including interviews with industry experts and a thorough review of publicly available information.
Silanes Market Concentration & Innovation
The global silanes market exhibits a moderately concentrated landscape, dominated by several key players. Momentive, Shin-Etsu Chemical, Evonik, Wacker Chemie, and Dow collectively hold a significant market share, estimated at xx million USD in 2025, representing approximately xx% of the total market. These companies benefit from economies of scale, established distribution networks, and extensive R&D capabilities. However, the market is also witnessing increased participation from regional players like Chengdu Guibao Science and Technology, Hubei Jianghan New Materials, and Wynca Group, signifying a shift towards greater competition.
- Market Share (2025 Estimate): Momentive (xx%), Shin-Etsu Chemical (xx%), Evonik (xx%), Wacker Chemie (xx%), Dow (xx%), Others (xx%).
- Innovation Drivers: Growing demand for high-performance materials in construction, electronics, and automotive sectors is driving innovation in silane chemistry. The focus is on developing silanes with enhanced properties such as improved adhesion, water repellency, and UV resistance.
- Regulatory Framework: Stringent environmental regulations regarding volatile organic compounds (VOCs) are pushing the development of eco-friendly silane alternatives.
- Product Substitutes: Competition comes from other bonding agents and surface treatment technologies, but silanes maintain a strong position due to their versatility and performance characteristics.
- M&A Activities: The past five years have witnessed xx million USD worth of M&A activity in the silanes sector, primarily driven by strategic acquisitions aimed at expanding product portfolios and market reach.
Silanes Industry Trends & Insights
The global silanes market is experiencing robust growth, driven by increasing demand from diverse end-use industries. The compound annual growth rate (CAGR) during the forecast period (2025-2033) is projected to be xx%, reaching a market value of xx million USD by 2033. This growth is fueled by several key factors:
- Technological Disruptions: Advancements in nanotechnology and materials science are leading to the development of novel silane-based materials with enhanced properties, expanding their applications across various sectors.
- Consumer Preferences: The increasing preference for durable, high-performance, and environmentally friendly products is driving the demand for silanes in construction, coatings, and adhesives.
- Market Penetration: Silanes are steadily penetrating new markets, including renewable energy and medical devices, further contributing to market growth.
- Competitive Dynamics: The market is characterized by both intense competition among established players and the emergence of new entrants, leading to innovation and price competitiveness.
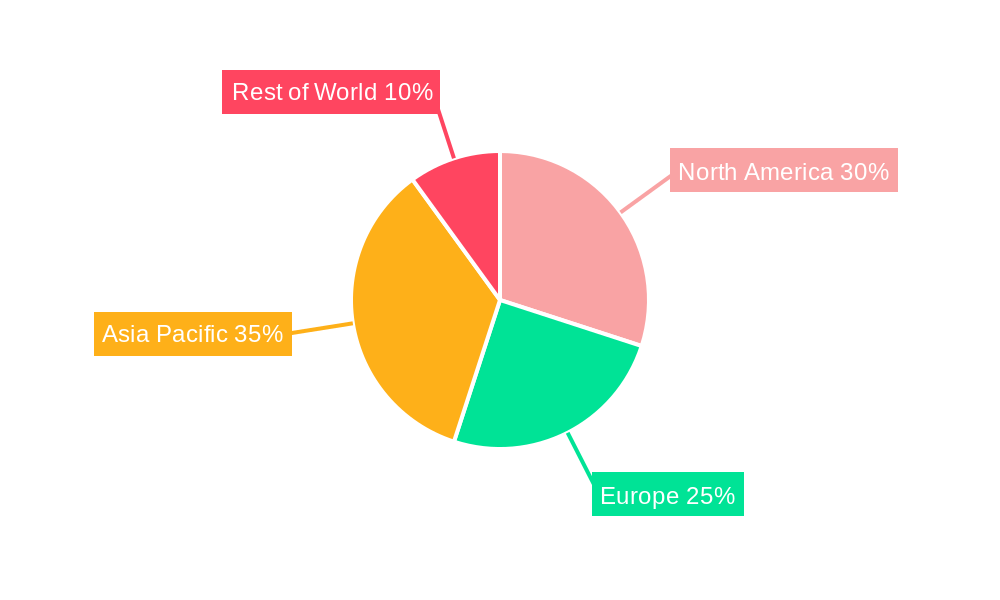
Dominant Markets & Segments in Silanes
The Asia-Pacific region is currently the dominant market for silanes, driven by rapid industrialization, infrastructure development, and a burgeoning construction sector. China, in particular, holds a significant market share.
- Key Drivers in Asia-Pacific:
- Rapid urbanization and infrastructure development.
- Growing automotive and electronics industries.
- Favorable government policies promoting industrial growth.
- Dominance Analysis: The region's large and expanding industrial base, coupled with a rising middle class and increased disposable income, contribute significantly to the high demand for silanes. Competitive pricing from regional manufacturers further strengthens the region's dominant position.
Silanes Product Developments
Recent innovations in silanes include the development of multifunctional silanes with improved adhesion, water repellency, and UV resistance. These advanced silanes are finding applications in high-performance coatings, adhesives, and sealants, catering to the increasing demand for durable and environmentally friendly materials. The focus is on developing silanes with tailored properties to meet the specific needs of various industries.
Report Scope & Segmentation Analysis
This report segments the silanes market based on several factors, including type (alkoxysilanes, chlorosilanes, others), application (adhesives & sealants, coatings, construction, textiles, others), and region (North America, Europe, Asia Pacific, Rest of the World). Each segment presents unique growth prospects and competitive dynamics. For example, the alkoxysilanes segment is expected to witness significant growth due to its widespread use in various applications. Detailed growth projections and market sizes are provided for each segment within the full report.
Key Drivers of Silanes Growth
Several factors are driving the growth of the silanes market. These include:
- Technological advancements: Continuous innovation in silane chemistry is leading to the development of novel products with enhanced properties.
- Economic growth: Expansion of various end-use industries, especially construction and automotive, is boosting the demand for silanes.
- Favorable government policies: Government initiatives promoting sustainable construction and infrastructure development are indirectly increasing silane demand.
Challenges in the Silanes Sector
The silanes market faces several challenges, including:
- Fluctuating raw material prices: The price volatility of raw materials used in silane production can impact profitability.
- Stringent environmental regulations: Compliance with stringent environmental regulations can increase production costs.
- Intense competition: The presence of numerous established and emerging players creates a competitive market landscape.
Emerging Opportunities in Silanes
The silanes market presents several promising opportunities:
- Expanding applications: Silanes are finding increasing applications in emerging sectors like renewable energy and medical devices.
- Development of novel silanes: Innovation in silane chemistry offers opportunities to develop products with enhanced properties and functionalities.
- Growth in developing economies: Developing economies present significant growth potential for silanes due to rapid industrialization and infrastructure development.
Leading Players in the Silanes Market
- Momentive
- Shin-Etsu Chemical
- Evonik
- Wacker Chemie
- Dow
- Chengdu Guibao Science and Technology
- Hubei Jianghan New Materials
- Wynca Group
- Tangshan Sunfar Silicon
- Hubei BlueSky New Material
- WD Silicone
- Jiangxi Chenguang New Materials
- Jiangxi Hungpai New Materials
Key Developments in Silanes Industry
- Jan 2023: Momentive launched a new line of high-performance silanes for automotive applications.
- Oct 2022: Shin-Etsu Chemical announced a significant investment in its silane production facility.
- (Add more key developments with specific dates and impact on market dynamics)
Strategic Outlook for Silanes Market
The silanes market is poised for continued growth, driven by technological advancements, expanding applications, and increasing demand from diverse end-use industries. The focus on developing sustainable and high-performance silanes will further fuel market expansion, creating significant opportunities for both established players and new entrants. The market is expected to remain moderately concentrated, with key players continually investing in R&D and expanding their product portfolios to maintain their competitive edge.
Silanes Segmentation
-
1. Application
- 1.1. Intermediates
- 1.2. Rubber
- 1.3. Adhesion Promoter
- 1.4. Others
-
2. Type
- 2.1. Chloromethyltrichlorosilane
- 2.2. Chloromethyltriethoxysilane
- 2.3. Chloromethylmethyldimethoxysilane
- 2.4. Others
Silanes Segmentation By Geography
-
1. North America
- 1.1. United States
- 1.2. Canada
- 1.3. Mexico
-
2. South America
- 2.1. Brazil
- 2.2. Argentina
- 2.3. Rest of South America
-
3. Europe
- 3.1. United Kingdom
- 3.2. Germany
- 3.3. France
- 3.4. Italy
- 3.5. Spain
- 3.6. Russia
- 3.7. Benelux
- 3.8. Nordics
- 3.9. Rest of Europe
-
4. Middle East & Africa
- 4.1. Turkey
- 4.2. Israel
- 4.3. GCC
- 4.4. North Africa
- 4.5. South Africa
- 4.6. Rest of Middle East & Africa
-
5. Asia Pacific
- 5.1. China
- 5.2. India
- 5.3. Japan
- 5.4. South Korea
- 5.5. ASEAN
- 5.6. Oceania
- 5.7. Rest of Asia Pacific
Silanes Regional Market Share
Geographic Coverage of Silanes
Silanes REPORT HIGHLIGHTS
| Aspects | Details |
|---|---|
| Study Period | 2020-2034 |
| Base Year | 2025 |
| Estimated Year | 2026 |
| Forecast Period | 2026-2034 |
| Historical Period | 2020-2025 |
| Growth Rate | CAGR of 5.6% from 2020-2034 |
| Segmentation |
|
Table of Contents
- 1. Introduction
- 1.1. Research Scope
- 1.2. Market Segmentation
- 1.3. Research Objective
- 1.4. Definitions and Assumptions
- 2. Executive Summary
- 2.1. Market Snapshot
- 3. Market Dynamics
- 3.1. Market Drivers
- 3.2. Market Restrains
- 3.3. Market Trends
- 3.4. Market Opportunities
- 4. Market Factor Analysis
- 4.1. Porters Five Forces
- 4.1.1. Bargaining Power of Suppliers
- 4.1.2. Bargaining Power of Buyers
- 4.1.3. Threat of New Entrants
- 4.1.4. Threat of Substitutes
- 4.1.5. Competitive Rivalry
- 4.2. PESTEL analysis
- 4.3. BCG Analysis
- 4.3.1. Stars (High Growth, High Market Share)
- 4.3.2. Cash Cows (Low Growth, High Market Share)
- 4.3.3. Question Mark (High Growth, Low Market Share)
- 4.3.4. Dogs (Low Growth, Low Market Share)
- 4.4. Ansoff Matrix Analysis
- 4.5. Supply Chain Analysis
- 4.6. Regulatory Landscape
- 4.7. Current Market Potential and Opportunity Assessment (TAM–SAM–SOM Framework)
- 4.8. RAX Analyst Note
- 4.1. Porters Five Forces
- 5. Market Analysis, Insights and Forecast 2021-2033
- 5.1. Market Analysis, Insights and Forecast - by Application
- 5.1.1. Intermediates
- 5.1.2. Rubber
- 5.1.3. Adhesion Promoter
- 5.1.4. Others
- 5.2. Market Analysis, Insights and Forecast - by Type
- 5.2.1. Chloromethyltrichlorosilane
- 5.2.2. Chloromethyltriethoxysilane
- 5.2.3. Chloromethylmethyldimethoxysilane
- 5.2.4. Others
- 5.3. Market Analysis, Insights and Forecast - by Region
- 5.3.1. North America
- 5.3.2. South America
- 5.3.3. Europe
- 5.3.4. Middle East & Africa
- 5.3.5. Asia Pacific
- 5.1. Market Analysis, Insights and Forecast - by Application
- 6. Global Silanes Analysis, Insights and Forecast, 2021-2033
- 6.1. Market Analysis, Insights and Forecast - by Application
- 6.1.1. Intermediates
- 6.1.2. Rubber
- 6.1.3. Adhesion Promoter
- 6.1.4. Others
- 6.2. Market Analysis, Insights and Forecast - by Type
- 6.2.1. Chloromethyltrichlorosilane
- 6.2.2. Chloromethyltriethoxysilane
- 6.2.3. Chloromethylmethyldimethoxysilane
- 6.2.4. Others
- 6.1. Market Analysis, Insights and Forecast - by Application
- 7. North America Silanes Analysis, Insights and Forecast, 2020-2032
- 7.1. Market Analysis, Insights and Forecast - by Application
- 7.1.1. Intermediates
- 7.1.2. Rubber
- 7.1.3. Adhesion Promoter
- 7.1.4. Others
- 7.2. Market Analysis, Insights and Forecast - by Type
- 7.2.1. Chloromethyltrichlorosilane
- 7.2.2. Chloromethyltriethoxysilane
- 7.2.3. Chloromethylmethyldimethoxysilane
- 7.2.4. Others
- 7.1. Market Analysis, Insights and Forecast - by Application
- 8. South America Silanes Analysis, Insights and Forecast, 2020-2032
- 8.1. Market Analysis, Insights and Forecast - by Application
- 8.1.1. Intermediates
- 8.1.2. Rubber
- 8.1.3. Adhesion Promoter
- 8.1.4. Others
- 8.2. Market Analysis, Insights and Forecast - by Type
- 8.2.1. Chloromethyltrichlorosilane
- 8.2.2. Chloromethyltriethoxysilane
- 8.2.3. Chloromethylmethyldimethoxysilane
- 8.2.4. Others
- 8.1. Market Analysis, Insights and Forecast - by Application
- 9. Europe Silanes Analysis, Insights and Forecast, 2020-2032
- 9.1. Market Analysis, Insights and Forecast - by Application
- 9.1.1. Intermediates
- 9.1.2. Rubber
- 9.1.3. Adhesion Promoter
- 9.1.4. Others
- 9.2. Market Analysis, Insights and Forecast - by Type
- 9.2.1. Chloromethyltrichlorosilane
- 9.2.2. Chloromethyltriethoxysilane
- 9.2.3. Chloromethylmethyldimethoxysilane
- 9.2.4. Others
- 9.1. Market Analysis, Insights and Forecast - by Application
- 10. Middle East & Africa Silanes Analysis, Insights and Forecast, 2020-2032
- 10.1. Market Analysis, Insights and Forecast - by Application
- 10.1.1. Intermediates
- 10.1.2. Rubber
- 10.1.3. Adhesion Promoter
- 10.1.4. Others
- 10.2. Market Analysis, Insights and Forecast - by Type
- 10.2.1. Chloromethyltrichlorosilane
- 10.2.2. Chloromethyltriethoxysilane
- 10.2.3. Chloromethylmethyldimethoxysilane
- 10.2.4. Others
- 10.1. Market Analysis, Insights and Forecast - by Application
- 11. Asia Pacific Silanes Analysis, Insights and Forecast, 2020-2032
- 11.1. Market Analysis, Insights and Forecast - by Application
- 11.1.1. Intermediates
- 11.1.2. Rubber
- 11.1.3. Adhesion Promoter
- 11.1.4. Others
- 11.2. Market Analysis, Insights and Forecast - by Type
- 11.2.1. Chloromethyltrichlorosilane
- 11.2.2. Chloromethyltriethoxysilane
- 11.2.3. Chloromethylmethyldimethoxysilane
- 11.2.4. Others
- 11.1. Market Analysis, Insights and Forecast - by Application
- 12. Competitive Analysis
- 12.1. Company Profiles
- 12.1.1 Momentive
- 12.1.1.1. Company Overview
- 12.1.1.2. Products
- 12.1.1.3. Company Financials
- 12.1.1.4. SWOT Analysis
- 12.1.2 Shin-Etsu Chemical
- 12.1.2.1. Company Overview
- 12.1.2.2. Products
- 12.1.2.3. Company Financials
- 12.1.2.4. SWOT Analysis
- 12.1.3 Evonik
- 12.1.3.1. Company Overview
- 12.1.3.2. Products
- 12.1.3.3. Company Financials
- 12.1.3.4. SWOT Analysis
- 12.1.4 Wacker Chemie
- 12.1.4.1. Company Overview
- 12.1.4.2. Products
- 12.1.4.3. Company Financials
- 12.1.4.4. SWOT Analysis
- 12.1.5 Dow
- 12.1.5.1. Company Overview
- 12.1.5.2. Products
- 12.1.5.3. Company Financials
- 12.1.5.4. SWOT Analysis
- 12.1.6 Chengdu Guibao Science and Technology
- 12.1.6.1. Company Overview
- 12.1.6.2. Products
- 12.1.6.3. Company Financials
- 12.1.6.4. SWOT Analysis
- 12.1.7 Hubei Jianghan New Materials
- 12.1.7.1. Company Overview
- 12.1.7.2. Products
- 12.1.7.3. Company Financials
- 12.1.7.4. SWOT Analysis
- 12.1.8 Wynca Group
- 12.1.8.1. Company Overview
- 12.1.8.2. Products
- 12.1.8.3. Company Financials
- 12.1.8.4. SWOT Analysis
- 12.1.9 Tangshan Sunfar Silicon
- 12.1.9.1. Company Overview
- 12.1.9.2. Products
- 12.1.9.3. Company Financials
- 12.1.9.4. SWOT Analysis
- 12.1.10 Hubei BlueSky New Material
- 12.1.10.1. Company Overview
- 12.1.10.2. Products
- 12.1.10.3. Company Financials
- 12.1.10.4. SWOT Analysis
- 12.1.11 WD Silicone
- 12.1.11.1. Company Overview
- 12.1.11.2. Products
- 12.1.11.3. Company Financials
- 12.1.11.4. SWOT Analysis
- 12.1.12 Jiangxi Chenguang New Materials
- 12.1.12.1. Company Overview
- 12.1.12.2. Products
- 12.1.12.3. Company Financials
- 12.1.12.4. SWOT Analysis
- 12.1.13 Jiangxi Hungpai New Materials
- 12.1.13.1. Company Overview
- 12.1.13.2. Products
- 12.1.13.3. Company Financials
- 12.1.13.4. SWOT Analysis
- 12.1.1 Momentive
- 12.2. Market Entropy
- 12.2.1 Company's Key Areas Served
- 12.2.2 Recent Developments
- 12.3. Company Market Share Analysis 2025
- 12.3.1 Top 5 Companies Market Share Analysis
- 12.3.2 Top 3 Companies Market Share Analysis
- 12.4. List of Potential Customers
- 13. Research Methodology
List of Figures
- Figure 1: Global Silanes Revenue Breakdown (million, %) by Region 2025 & 2033
- Figure 2: Global Silanes Volume Breakdown (K, %) by Region 2025 & 2033
- Figure 3: North America Silanes Revenue (million), by Application 2025 & 2033
- Figure 4: North America Silanes Volume (K), by Application 2025 & 2033
- Figure 5: North America Silanes Revenue Share (%), by Application 2025 & 2033
- Figure 6: North America Silanes Volume Share (%), by Application 2025 & 2033
- Figure 7: North America Silanes Revenue (million), by Type 2025 & 2033
- Figure 8: North America Silanes Volume (K), by Type 2025 & 2033
- Figure 9: North America Silanes Revenue Share (%), by Type 2025 & 2033
- Figure 10: North America Silanes Volume Share (%), by Type 2025 & 2033
- Figure 11: North America Silanes Revenue (million), by Country 2025 & 2033
- Figure 12: North America Silanes Volume (K), by Country 2025 & 2033
- Figure 13: North America Silanes Revenue Share (%), by Country 2025 & 2033
- Figure 14: North America Silanes Volume Share (%), by Country 2025 & 2033
- Figure 15: South America Silanes Revenue (million), by Application 2025 & 2033
- Figure 16: South America Silanes Volume (K), by Application 2025 & 2033
- Figure 17: South America Silanes Revenue Share (%), by Application 2025 & 2033
- Figure 18: South America Silanes Volume Share (%), by Application 2025 & 2033
- Figure 19: South America Silanes Revenue (million), by Type 2025 & 2033
- Figure 20: South America Silanes Volume (K), by Type 2025 & 2033
- Figure 21: South America Silanes Revenue Share (%), by Type 2025 & 2033
- Figure 22: South America Silanes Volume Share (%), by Type 2025 & 2033
- Figure 23: South America Silanes Revenue (million), by Country 2025 & 2033
- Figure 24: South America Silanes Volume (K), by Country 2025 & 2033
- Figure 25: South America Silanes Revenue Share (%), by Country 2025 & 2033
- Figure 26: South America Silanes Volume Share (%), by Country 2025 & 2033
- Figure 27: Europe Silanes Revenue (million), by Application 2025 & 2033
- Figure 28: Europe Silanes Volume (K), by Application 2025 & 2033
- Figure 29: Europe Silanes Revenue Share (%), by Application 2025 & 2033
- Figure 30: Europe Silanes Volume Share (%), by Application 2025 & 2033
- Figure 31: Europe Silanes Revenue (million), by Type 2025 & 2033
- Figure 32: Europe Silanes Volume (K), by Type 2025 & 2033
- Figure 33: Europe Silanes Revenue Share (%), by Type 2025 & 2033
- Figure 34: Europe Silanes Volume Share (%), by Type 2025 & 2033
- Figure 35: Europe Silanes Revenue (million), by Country 2025 & 2033
- Figure 36: Europe Silanes Volume (K), by Country 2025 & 2033
- Figure 37: Europe Silanes Revenue Share (%), by Country 2025 & 2033
- Figure 38: Europe Silanes Volume Share (%), by Country 2025 & 2033
- Figure 39: Middle East & Africa Silanes Revenue (million), by Application 2025 & 2033
- Figure 40: Middle East & Africa Silanes Volume (K), by Application 2025 & 2033
- Figure 41: Middle East & Africa Silanes Revenue Share (%), by Application 2025 & 2033
- Figure 42: Middle East & Africa Silanes Volume Share (%), by Application 2025 & 2033
- Figure 43: Middle East & Africa Silanes Revenue (million), by Type 2025 & 2033
- Figure 44: Middle East & Africa Silanes Volume (K), by Type 2025 & 2033
- Figure 45: Middle East & Africa Silanes Revenue Share (%), by Type 2025 & 2033
- Figure 46: Middle East & Africa Silanes Volume Share (%), by Type 2025 & 2033
- Figure 47: Middle East & Africa Silanes Revenue (million), by Country 2025 & 2033
- Figure 48: Middle East & Africa Silanes Volume (K), by Country 2025 & 2033
- Figure 49: Middle East & Africa Silanes Revenue Share (%), by Country 2025 & 2033
- Figure 50: Middle East & Africa Silanes Volume Share (%), by Country 2025 & 2033
- Figure 51: Asia Pacific Silanes Revenue (million), by Application 2025 & 2033
- Figure 52: Asia Pacific Silanes Volume (K), by Application 2025 & 2033
- Figure 53: Asia Pacific Silanes Revenue Share (%), by Application 2025 & 2033
- Figure 54: Asia Pacific Silanes Volume Share (%), by Application 2025 & 2033
- Figure 55: Asia Pacific Silanes Revenue (million), by Type 2025 & 2033
- Figure 56: Asia Pacific Silanes Volume (K), by Type 2025 & 2033
- Figure 57: Asia Pacific Silanes Revenue Share (%), by Type 2025 & 2033
- Figure 58: Asia Pacific Silanes Volume Share (%), by Type 2025 & 2033
- Figure 59: Asia Pacific Silanes Revenue (million), by Country 2025 & 2033
- Figure 60: Asia Pacific Silanes Volume (K), by Country 2025 & 2033
- Figure 61: Asia Pacific Silanes Revenue Share (%), by Country 2025 & 2033
- Figure 62: Asia Pacific Silanes Volume Share (%), by Country 2025 & 2033
List of Tables
- Table 1: Global Silanes Revenue million Forecast, by Application 2020 & 2033
- Table 2: Global Silanes Volume K Forecast, by Application 2020 & 2033
- Table 3: Global Silanes Revenue million Forecast, by Type 2020 & 2033
- Table 4: Global Silanes Volume K Forecast, by Type 2020 & 2033
- Table 5: Global Silanes Revenue million Forecast, by Region 2020 & 2033
- Table 6: Global Silanes Volume K Forecast, by Region 2020 & 2033
- Table 7: Global Silanes Revenue million Forecast, by Application 2020 & 2033
- Table 8: Global Silanes Volume K Forecast, by Application 2020 & 2033
- Table 9: Global Silanes Revenue million Forecast, by Type 2020 & 2033
- Table 10: Global Silanes Volume K Forecast, by Type 2020 & 2033
- Table 11: Global Silanes Revenue million Forecast, by Country 2020 & 2033
- Table 12: Global Silanes Volume K Forecast, by Country 2020 & 2033
- Table 13: United States Silanes Revenue (million) Forecast, by Application 2020 & 2033
- Table 14: United States Silanes Volume (K) Forecast, by Application 2020 & 2033
- Table 15: Canada Silanes Revenue (million) Forecast, by Application 2020 & 2033
- Table 16: Canada Silanes Volume (K) Forecast, by Application 2020 & 2033
- Table 17: Mexico Silanes Revenue (million) Forecast, by Application 2020 & 2033
- Table 18: Mexico Silanes Volume (K) Forecast, by Application 2020 & 2033
- Table 19: Global Silanes Revenue million Forecast, by Application 2020 & 2033
- Table 20: Global Silanes Volume K Forecast, by Application 2020 & 2033
- Table 21: Global Silanes Revenue million Forecast, by Type 2020 & 2033
- Table 22: Global Silanes Volume K Forecast, by Type 2020 & 2033
- Table 23: Global Silanes Revenue million Forecast, by Country 2020 & 2033
- Table 24: Global Silanes Volume K Forecast, by Country 2020 & 2033
- Table 25: Brazil Silanes Revenue (million) Forecast, by Application 2020 & 2033
- Table 26: Brazil Silanes Volume (K) Forecast, by Application 2020 & 2033
- Table 27: Argentina Silanes Revenue (million) Forecast, by Application 2020 & 2033
- Table 28: Argentina Silanes Volume (K) Forecast, by Application 2020 & 2033
- Table 29: Rest of South America Silanes Revenue (million) Forecast, by Application 2020 & 2033
- Table 30: Rest of South America Silanes Volume (K) Forecast, by Application 2020 & 2033
- Table 31: Global Silanes Revenue million Forecast, by Application 2020 & 2033
- Table 32: Global Silanes Volume K Forecast, by Application 2020 & 2033
- Table 33: Global Silanes Revenue million Forecast, by Type 2020 & 2033
- Table 34: Global Silanes Volume K Forecast, by Type 2020 & 2033
- Table 35: Global Silanes Revenue million Forecast, by Country 2020 & 2033
- Table 36: Global Silanes Volume K Forecast, by Country 2020 & 2033
- Table 37: United Kingdom Silanes Revenue (million) Forecast, by Application 2020 & 2033
- Table 38: United Kingdom Silanes Volume (K) Forecast, by Application 2020 & 2033
- Table 39: Germany Silanes Revenue (million) Forecast, by Application 2020 & 2033
- Table 40: Germany Silanes Volume (K) Forecast, by Application 2020 & 2033
- Table 41: France Silanes Revenue (million) Forecast, by Application 2020 & 2033
- Table 42: France Silanes Volume (K) Forecast, by Application 2020 & 2033
- Table 43: Italy Silanes Revenue (million) Forecast, by Application 2020 & 2033
- Table 44: Italy Silanes Volume (K) Forecast, by Application 2020 & 2033
- Table 45: Spain Silanes Revenue (million) Forecast, by Application 2020 & 2033
- Table 46: Spain Silanes Volume (K) Forecast, by Application 2020 & 2033
- Table 47: Russia Silanes Revenue (million) Forecast, by Application 2020 & 2033
- Table 48: Russia Silanes Volume (K) Forecast, by Application 2020 & 2033
- Table 49: Benelux Silanes Revenue (million) Forecast, by Application 2020 & 2033
- Table 50: Benelux Silanes Volume (K) Forecast, by Application 2020 & 2033
- Table 51: Nordics Silanes Revenue (million) Forecast, by Application 2020 & 2033
- Table 52: Nordics Silanes Volume (K) Forecast, by Application 2020 & 2033
- Table 53: Rest of Europe Silanes Revenue (million) Forecast, by Application 2020 & 2033
- Table 54: Rest of Europe Silanes Volume (K) Forecast, by Application 2020 & 2033
- Table 55: Global Silanes Revenue million Forecast, by Application 2020 & 2033
- Table 56: Global Silanes Volume K Forecast, by Application 2020 & 2033
- Table 57: Global Silanes Revenue million Forecast, by Type 2020 & 2033
- Table 58: Global Silanes Volume K Forecast, by Type 2020 & 2033
- Table 59: Global Silanes Revenue million Forecast, by Country 2020 & 2033
- Table 60: Global Silanes Volume K Forecast, by Country 2020 & 2033
- Table 61: Turkey Silanes Revenue (million) Forecast, by Application 2020 & 2033
- Table 62: Turkey Silanes Volume (K) Forecast, by Application 2020 & 2033
- Table 63: Israel Silanes Revenue (million) Forecast, by Application 2020 & 2033
- Table 64: Israel Silanes Volume (K) Forecast, by Application 2020 & 2033
- Table 65: GCC Silanes Revenue (million) Forecast, by Application 2020 & 2033
- Table 66: GCC Silanes Volume (K) Forecast, by Application 2020 & 2033
- Table 67: North Africa Silanes Revenue (million) Forecast, by Application 2020 & 2033
- Table 68: North Africa Silanes Volume (K) Forecast, by Application 2020 & 2033
- Table 69: South Africa Silanes Revenue (million) Forecast, by Application 2020 & 2033
- Table 70: South Africa Silanes Volume (K) Forecast, by Application 2020 & 2033
- Table 71: Rest of Middle East & Africa Silanes Revenue (million) Forecast, by Application 2020 & 2033
- Table 72: Rest of Middle East & Africa Silanes Volume (K) Forecast, by Application 2020 & 2033
- Table 73: Global Silanes Revenue million Forecast, by Application 2020 & 2033
- Table 74: Global Silanes Volume K Forecast, by Application 2020 & 2033
- Table 75: Global Silanes Revenue million Forecast, by Type 2020 & 2033
- Table 76: Global Silanes Volume K Forecast, by Type 2020 & 2033
- Table 77: Global Silanes Revenue million Forecast, by Country 2020 & 2033
- Table 78: Global Silanes Volume K Forecast, by Country 2020 & 2033
- Table 79: China Silanes Revenue (million) Forecast, by Application 2020 & 2033
- Table 80: China Silanes Volume (K) Forecast, by Application 2020 & 2033
- Table 81: India Silanes Revenue (million) Forecast, by Application 2020 & 2033
- Table 82: India Silanes Volume (K) Forecast, by Application 2020 & 2033
- Table 83: Japan Silanes Revenue (million) Forecast, by Application 2020 & 2033
- Table 84: Japan Silanes Volume (K) Forecast, by Application 2020 & 2033
- Table 85: South Korea Silanes Revenue (million) Forecast, by Application 2020 & 2033
- Table 86: South Korea Silanes Volume (K) Forecast, by Application 2020 & 2033
- Table 87: ASEAN Silanes Revenue (million) Forecast, by Application 2020 & 2033
- Table 88: ASEAN Silanes Volume (K) Forecast, by Application 2020 & 2033
- Table 89: Oceania Silanes Revenue (million) Forecast, by Application 2020 & 2033
- Table 90: Oceania Silanes Volume (K) Forecast, by Application 2020 & 2033
- Table 91: Rest of Asia Pacific Silanes Revenue (million) Forecast, by Application 2020 & 2033
- Table 92: Rest of Asia Pacific Silanes Volume (K) Forecast, by Application 2020 & 2033
Frequently Asked Questions
1. What is the projected Compound Annual Growth Rate (CAGR) of the Silanes?
The projected CAGR is approximately 5.6%.
2. Which companies are prominent players in the Silanes?
Key companies in the market include Momentive, Shin-Etsu Chemical, Evonik, Wacker Chemie, Dow, Chengdu Guibao Science and Technology, Hubei Jianghan New Materials, Wynca Group, Tangshan Sunfar Silicon, Hubei BlueSky New Material, WD Silicone, Jiangxi Chenguang New Materials, Jiangxi Hungpai New Materials.
3. What are the main segments of the Silanes?
The market segments include Application, Type.
4. Can you provide details about the market size?
The market size is estimated to be USD 1205 million as of 2022.
5. What are some drivers contributing to market growth?
N/A
6. What are the notable trends driving market growth?
N/A
7. Are there any restraints impacting market growth?
N/A
8. Can you provide examples of recent developments in the market?
N/A
9. What pricing options are available for accessing the report?
Pricing options include single-user, multi-user, and enterprise licenses priced at USD 3950.00, USD 5925.00, and USD 7900.00 respectively.
10. Is the market size provided in terms of value or volume?
The market size is provided in terms of value, measured in million and volume, measured in K.
11. Are there any specific market keywords associated with the report?
Yes, the market keyword associated with the report is "Silanes," which aids in identifying and referencing the specific market segment covered.
12. How do I determine which pricing option suits my needs best?
The pricing options vary based on user requirements and access needs. Individual users may opt for single-user licenses, while businesses requiring broader access may choose multi-user or enterprise licenses for cost-effective access to the report.
13. Are there any additional resources or data provided in the Silanes report?
While the report offers comprehensive insights, it's advisable to review the specific contents or supplementary materials provided to ascertain if additional resources or data are available.
14. How can I stay updated on further developments or reports in the Silanes?
To stay informed about further developments, trends, and reports in the Silanes, consider subscribing to industry newsletters, following relevant companies and organizations, or regularly checking reputable industry news sources and publications.
Methodology
Step 1 - Identification of Relevant Samples Size from Population Database


Step 2 - Approaches for Defining Global Market Size (Value, Volume* & Price*)

Note*: In applicable scenarios
Step 3 - Data Sources
Primary Research
- Web Analytics
- Survey Reports
- Research Institute
- Latest Research Reports
- Opinion Leaders
Secondary Research
- Annual Reports
- White Paper
- Latest Press Release
- Industry Association
- Paid Database
- Investor Presentations

Step 4 - Data Triangulation
Involves using different sources of information in order to increase the validity of a study
These sources are likely to be stakeholders in a program - participants, other researchers, program staff, other community members, and so on.
Then we put all data in single framework & apply various statistical tools to find out the dynamic on the market.
During the analysis stage, feedback from the stakeholder groups would be compared to determine areas of agreement as well as areas of divergence