

Key Insights
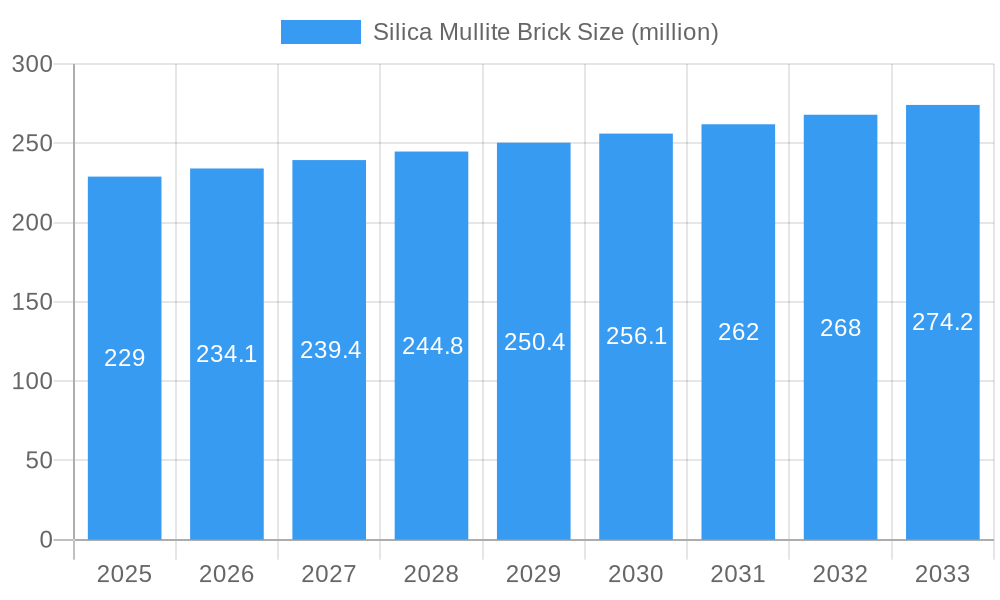
The global silica mullite brick market, currently valued at $229 million in 2025, is projected to experience steady growth with a compound annual growth rate (CAGR) of 2.2% from 2025 to 2033. This growth is driven primarily by the increasing demand from the refractory industry, particularly within the steel, cement, and glass manufacturing sectors. These industries rely heavily on high-temperature resistant materials like silica mullite bricks for furnace linings and other critical components, necessitating consistent replacement and upgrades. Furthermore, ongoing advancements in material science are leading to the development of improved silica mullite bricks with enhanced properties such as higher thermal shock resistance and improved durability, further fueling market expansion. However, the market faces constraints such as fluctuating raw material prices and the emergence of alternative refractory materials. The competitive landscape is relatively concentrated, with key players like Zhengzhou Rongsheng Refractory, Stanford Advanced Materials (SAM), and Sijihuo Refractory dominating the market share. Geographic distribution likely shows a concentration in regions with established industrial bases, though specific regional data is unavailable. Future growth will likely depend on technological innovations, sustainable manufacturing practices, and the overall health of the global manufacturing sector.
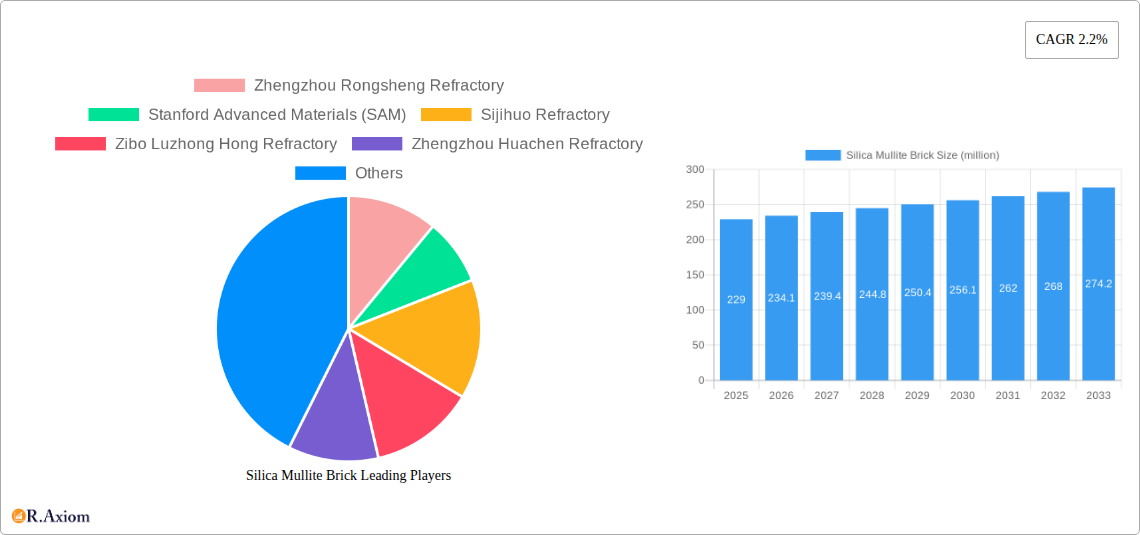
Silica Mullite Brick Market Size (In Million)
The sustained, albeit modest, growth trajectory of the silica mullite brick market suggests a stable and reliable investment opportunity within the refractory materials sector. While fluctuations in raw material costs present challenges, ongoing technological advancements and the persistent demand from core industries are likely to offset these pressures. Companies are strategically investing in research and development to enhance product quality and introduce innovative solutions to cater to the evolving needs of their customers. The focus on sustainability and environmentally friendly production methods will also play a crucial role in shaping the future of the silica mullite brick market. Analyzing specific regional markets and understanding the impact of government regulations will be crucial for companies seeking a competitive edge within this sector. Considering the historical period (2019-2024) and the projected growth rate, the market size is anticipated to remain relatively stable with moderate expansion over the forecast period.
Silica Mullite Brick Company Market Share
Silica Mullite Brick Market Report: A Comprehensive Analysis (2019-2033)
This comprehensive report provides a detailed analysis of the global Silica Mullite Brick market, offering valuable insights for industry stakeholders, investors, and strategic decision-makers. The report covers the period from 2019 to 2033, with a focus on the forecast period of 2025-2033 and a base year of 2025. The study incorporates extensive market data, expert analysis, and future projections to present a holistic view of this dynamic industry. The market size is estimated at xx million in 2025 and is projected to reach xx million by 2033, exhibiting a CAGR of xx%.
Silica Mullite Brick Market Concentration & Innovation
The global Silica Mullite Brick market exhibits a moderately concentrated landscape, with several key players commanding significant market share. Zhengzhou Rongsheng Refractory, Stanford Advanced Materials (SAM), Sijihuo Refractory, Zibo Luzhong Hong Refractory, Zhengzhou Huachen Refractory, Shandong Robert New Material, Henan Fire Ramo Industrial, and Henan SNR Refractory are among the prominent companies shaping market dynamics. Market share data for 2024 reveals that the top five players collectively hold approximately 45% of the market.
- Innovation Drivers: Ongoing research and development efforts are focused on enhancing the thermal shock resistance, corrosion resistance, and overall durability of silica mullite bricks. The integration of advanced materials and manufacturing techniques is driving innovation.
- Regulatory Frameworks: Stringent environmental regulations related to emissions and waste management are influencing manufacturing processes and material selection. Safety standards also play a significant role.
- Product Substitutes: Competition from alternative refractory materials, such as alumina-based bricks and zirconia bricks, necessitates continuous innovation to maintain market competitiveness.
- End-User Trends: The increasing demand for high-performance refractory materials across diverse industries, including steel, cement, and glass, is a key growth driver.
- M&A Activities: The past five years have witnessed xx million in M&A deals in the Silica Mullite Brick sector, primarily driven by consolidation efforts and the pursuit of technological advancements.
Silica Mullite Brick Industry Trends & Insights
The Silica Mullite Brick market is experiencing robust growth, driven by several factors. The increasing adoption of advanced manufacturing techniques across various industries, coupled with rising infrastructure investments in emerging economies, is fueling demand. Furthermore, the rising need for energy efficiency and the development of high-temperature applications are significant growth catalysts. The market is also experiencing technological disruptions with the introduction of new materials and manufacturing processes that improve the properties of silica mullite bricks, enabling their use in more demanding applications. Consumer preferences are increasingly shifting towards environmentally friendly and sustainable refractory materials, pushing manufacturers to adopt eco-friendly production methods. Competitive dynamics are characterized by intense competition among established players and the emergence of new entrants, resulting in price pressures and a constant drive for innovation.
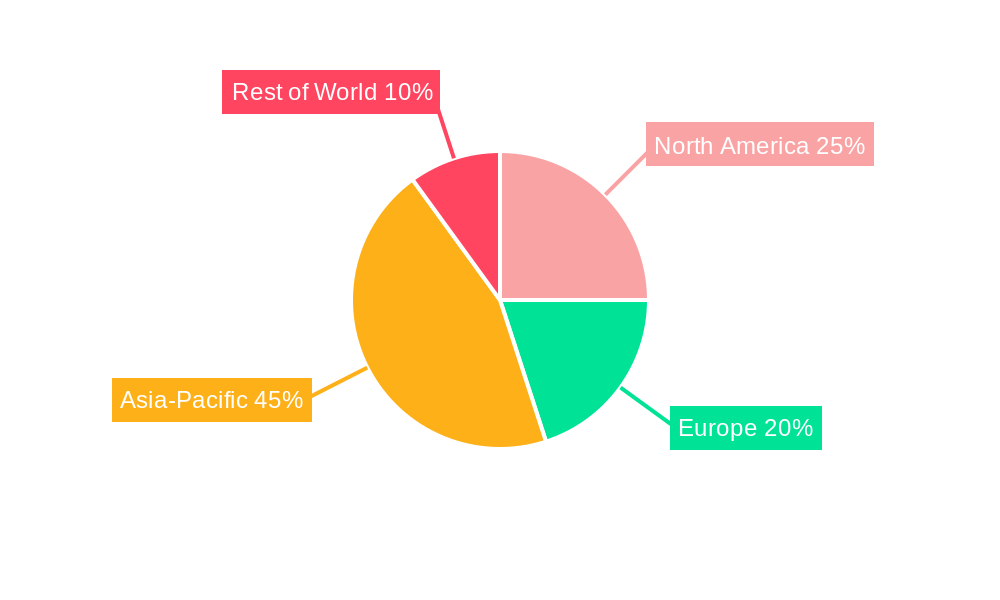
Dominant Markets & Segments in Silica Mullite Brick
The Asia-Pacific region dominates the global Silica Mullite Brick market, driven by rapid industrialization, significant infrastructure development, and robust economic growth. China, in particular, accounts for a substantial portion of the market share.
- Key Drivers in Asia-Pacific:
- Rapid industrialization and urbanization
- Massive investments in infrastructure projects (e.g., power plants, steel mills)
- Favorable government policies supporting industrial growth
- Increasing demand for high-quality refractory materials across various industries.
The dominance of the Asia-Pacific region is expected to continue throughout the forecast period due to sustained economic growth, substantial investment in infrastructure development and continued demand across major industries such as steel, cement and glass. Other regions, such as Europe and North America, contribute significantly to the market; however, their growth rates are relatively slower compared to the Asia-Pacific region.
Silica Mullite Brick Product Developments
Recent product innovations focus on enhancing the thermal shock resistance, creep resistance, and corrosion resistance of silica mullite bricks through advancements in material composition and manufacturing processes. New formulations incorporate additives to improve specific properties, leading to wider applications in diverse high-temperature environments. The development of lightweight and high-strength silica mullite bricks is a key area of innovation, addressing the need for enhanced energy efficiency and reduced operational costs in various industrial applications. This enhances the market fit of silica mullite bricks across various industries.
Report Scope & Segmentation Analysis
This report segments the Silica Mullite Brick market based on several key parameters:
- By Type: This segment categorizes silica mullite bricks based on their composition, density, and other physical properties. The market is further segmented into standard and high-performance varieties, each exhibiting unique characteristics and applications.
- By Application: The report analyzes the application of silica mullite bricks in various industries, including steel, cement, glass, and ceramics. Growth projections and competitive dynamics are detailed for each segment.
- By Region: The report provides a regional breakdown of the market, analyzing market size, growth rates, and key trends in major regions such as Asia-Pacific, North America, Europe, and the rest of the world.
Each segment offers unique growth opportunities and competitive landscapes, requiring specialized strategies for success.
Key Drivers of Silica Mullite Brick Growth
The growth of the Silica Mullite Brick market is propelled by several factors: The booming construction and infrastructure development sectors are driving demand for refractory materials. Furthermore, the increasing production of steel, cement, and glass necessitates robust refractory lining, boosting the consumption of silica mullite bricks. Technological advancements in manufacturing processes are leading to the production of higher-quality bricks with improved properties. Stringent environmental regulations are pushing for the use of more durable and energy-efficient materials, further benefiting the market.
Challenges in the Silica Mullite Brick Sector
The Silica Mullite Brick sector faces several challenges. Fluctuations in raw material prices, particularly silica and alumina, directly impact production costs and profitability. Intense competition among manufacturers results in price pressures. Stringent environmental regulations and safety standards demand compliance, increasing operational costs. Supply chain disruptions and geopolitical instability can also impact production and market availability. These challenges collectively impact profitability and necessitate continuous innovation for sustainable growth.
Emerging Opportunities in Silica Mullite Brick
Emerging opportunities exist in the development of specialized silica mullite bricks for niche applications, such as high-temperature furnaces in the aerospace and semiconductor industries. The growing demand for sustainable and eco-friendly refractory materials presents an opportunity to develop bricks with improved environmental performance. Technological advancements in materials science and manufacturing are opening avenues for producing bricks with superior properties. Exploration of new markets in developing economies offers significant growth potential.
Leading Players in the Silica Mullite Brick Market
- Zhengzhou Rongsheng Refractory
- Stanford Advanced Materials (SAM)
- Sijihuo Refractory
- Zibo Luzhong Hong Refractory
- Zhengzhou Huachen Refractory
- Shandong Robert New Material
- Henan Fire Ramo Industrial
- Henan SNR Refractory
Key Developments in Silica Mullite Brick Industry
- 2022 Q3: Zhengzhou Rongsheng Refractory launched a new line of high-performance silica mullite bricks with enhanced thermal shock resistance.
- 2023 Q1: Stanford Advanced Materials (SAM) announced a strategic partnership to expand its production capacity for specialized silica mullite bricks.
- 2024 Q2: Sijihuo Refractory invested in advanced manufacturing technology to improve the efficiency and quality of its silica mullite brick production. (Further specific examples could be added here based on actual market data.)
Strategic Outlook for Silica Mullite Brick Market
The Silica Mullite Brick market is poised for sustained growth, driven by continuous advancements in material science and manufacturing processes, increasing demand from diverse industries and ongoing investments in infrastructure development globally. The focus on sustainability and the development of eco-friendly materials will further shape market dynamics. The emergence of new applications in niche industries presents opportunities for specialized product development and market expansion. Players who can effectively navigate the challenges and capitalize on the emerging opportunities are expected to achieve significant growth in the coming years.
Silica Mullite Brick Segmentation
-
1. Application
- 1.1. Cement Industry
- 1.2. Glass Industry
- 1.3. Metallurgical Industry
- 1.4. Ceramics Industry
- 1.5. Other
-
2. Type
- 2.1. Low Aluminum Silicon Mullite Bricks
- 2.2. Medium Aluminum Silicon Mullite Bricks
- 2.3. High Aluminum Silicon Mullite Bricks
Silica Mullite Brick Segmentation By Geography
-
1. North America
- 1.1. United States
- 1.2. Canada
- 1.3. Mexico
-
2. South America
- 2.1. Brazil
- 2.2. Argentina
- 2.3. Rest of South America
-
3. Europe
- 3.1. United Kingdom
- 3.2. Germany
- 3.3. France
- 3.4. Italy
- 3.5. Spain
- 3.6. Russia
- 3.7. Benelux
- 3.8. Nordics
- 3.9. Rest of Europe
-
4. Middle East & Africa
- 4.1. Turkey
- 4.2. Israel
- 4.3. GCC
- 4.4. North Africa
- 4.5. South Africa
- 4.6. Rest of Middle East & Africa
-
5. Asia Pacific
- 5.1. China
- 5.2. India
- 5.3. Japan
- 5.4. South Korea
- 5.5. ASEAN
- 5.6. Oceania
- 5.7. Rest of Asia Pacific
Silica Mullite Brick Regional Market Share
Geographic Coverage of Silica Mullite Brick
Silica Mullite Brick REPORT HIGHLIGHTS
| Aspects | Details |
|---|---|
| Study Period | 2020-2034 |
| Base Year | 2025 |
| Estimated Year | 2026 |
| Forecast Period | 2026-2034 |
| Historical Period | 2020-2025 |
| Growth Rate | CAGR of 2.2% from 2020-2034 |
| Segmentation |
|
Table of Contents
- 1. Introduction
- 1.1. Research Scope
- 1.2. Market Segmentation
- 1.3. Research Objective
- 1.4. Definitions and Assumptions
- 2. Executive Summary
- 2.1. Market Snapshot
- 3. Market Dynamics
- 3.1. Market Drivers
- 3.2. Market Restrains
- 3.3. Market Trends
- 3.4. Market Opportunities
- 4. Market Factor Analysis
- 4.1. Porters Five Forces
- 4.1.1. Bargaining Power of Suppliers
- 4.1.2. Bargaining Power of Buyers
- 4.1.3. Threat of New Entrants
- 4.1.4. Threat of Substitutes
- 4.1.5. Competitive Rivalry
- 4.2. PESTEL analysis
- 4.3. BCG Analysis
- 4.3.1. Stars (High Growth, High Market Share)
- 4.3.2. Cash Cows (Low Growth, High Market Share)
- 4.3.3. Question Mark (High Growth, Low Market Share)
- 4.3.4. Dogs (Low Growth, Low Market Share)
- 4.4. Ansoff Matrix Analysis
- 4.5. Supply Chain Analysis
- 4.6. Regulatory Landscape
- 4.7. Current Market Potential and Opportunity Assessment (TAM–SAM–SOM Framework)
- 4.8. RAX Analyst Note
- 4.1. Porters Five Forces
- 5. Market Analysis, Insights and Forecast 2021-2033
- 5.1. Market Analysis, Insights and Forecast - by Application
- 5.1.1. Cement Industry
- 5.1.2. Glass Industry
- 5.1.3. Metallurgical Industry
- 5.1.4. Ceramics Industry
- 5.1.5. Other
- 5.2. Market Analysis, Insights and Forecast - by Type
- 5.2.1. Low Aluminum Silicon Mullite Bricks
- 5.2.2. Medium Aluminum Silicon Mullite Bricks
- 5.2.3. High Aluminum Silicon Mullite Bricks
- 5.3. Market Analysis, Insights and Forecast - by Region
- 5.3.1. North America
- 5.3.2. South America
- 5.3.3. Europe
- 5.3.4. Middle East & Africa
- 5.3.5. Asia Pacific
- 5.1. Market Analysis, Insights and Forecast - by Application
- 6. Global Silica Mullite Brick Analysis, Insights and Forecast, 2021-2033
- 6.1. Market Analysis, Insights and Forecast - by Application
- 6.1.1. Cement Industry
- 6.1.2. Glass Industry
- 6.1.3. Metallurgical Industry
- 6.1.4. Ceramics Industry
- 6.1.5. Other
- 6.2. Market Analysis, Insights and Forecast - by Type
- 6.2.1. Low Aluminum Silicon Mullite Bricks
- 6.2.2. Medium Aluminum Silicon Mullite Bricks
- 6.2.3. High Aluminum Silicon Mullite Bricks
- 6.1. Market Analysis, Insights and Forecast - by Application
- 7. North America Silica Mullite Brick Analysis, Insights and Forecast, 2020-2032
- 7.1. Market Analysis, Insights and Forecast - by Application
- 7.1.1. Cement Industry
- 7.1.2. Glass Industry
- 7.1.3. Metallurgical Industry
- 7.1.4. Ceramics Industry
- 7.1.5. Other
- 7.2. Market Analysis, Insights and Forecast - by Type
- 7.2.1. Low Aluminum Silicon Mullite Bricks
- 7.2.2. Medium Aluminum Silicon Mullite Bricks
- 7.2.3. High Aluminum Silicon Mullite Bricks
- 7.1. Market Analysis, Insights and Forecast - by Application
- 8. South America Silica Mullite Brick Analysis, Insights and Forecast, 2020-2032
- 8.1. Market Analysis, Insights and Forecast - by Application
- 8.1.1. Cement Industry
- 8.1.2. Glass Industry
- 8.1.3. Metallurgical Industry
- 8.1.4. Ceramics Industry
- 8.1.5. Other
- 8.2. Market Analysis, Insights and Forecast - by Type
- 8.2.1. Low Aluminum Silicon Mullite Bricks
- 8.2.2. Medium Aluminum Silicon Mullite Bricks
- 8.2.3. High Aluminum Silicon Mullite Bricks
- 8.1. Market Analysis, Insights and Forecast - by Application
- 9. Europe Silica Mullite Brick Analysis, Insights and Forecast, 2020-2032
- 9.1. Market Analysis, Insights and Forecast - by Application
- 9.1.1. Cement Industry
- 9.1.2. Glass Industry
- 9.1.3. Metallurgical Industry
- 9.1.4. Ceramics Industry
- 9.1.5. Other
- 9.2. Market Analysis, Insights and Forecast - by Type
- 9.2.1. Low Aluminum Silicon Mullite Bricks
- 9.2.2. Medium Aluminum Silicon Mullite Bricks
- 9.2.3. High Aluminum Silicon Mullite Bricks
- 9.1. Market Analysis, Insights and Forecast - by Application
- 10. Middle East & Africa Silica Mullite Brick Analysis, Insights and Forecast, 2020-2032
- 10.1. Market Analysis, Insights and Forecast - by Application
- 10.1.1. Cement Industry
- 10.1.2. Glass Industry
- 10.1.3. Metallurgical Industry
- 10.1.4. Ceramics Industry
- 10.1.5. Other
- 10.2. Market Analysis, Insights and Forecast - by Type
- 10.2.1. Low Aluminum Silicon Mullite Bricks
- 10.2.2. Medium Aluminum Silicon Mullite Bricks
- 10.2.3. High Aluminum Silicon Mullite Bricks
- 10.1. Market Analysis, Insights and Forecast - by Application
- 11. Asia Pacific Silica Mullite Brick Analysis, Insights and Forecast, 2020-2032
- 11.1. Market Analysis, Insights and Forecast - by Application
- 11.1.1. Cement Industry
- 11.1.2. Glass Industry
- 11.1.3. Metallurgical Industry
- 11.1.4. Ceramics Industry
- 11.1.5. Other
- 11.2. Market Analysis, Insights and Forecast - by Type
- 11.2.1. Low Aluminum Silicon Mullite Bricks
- 11.2.2. Medium Aluminum Silicon Mullite Bricks
- 11.2.3. High Aluminum Silicon Mullite Bricks
- 11.1. Market Analysis, Insights and Forecast - by Application
- 12. Competitive Analysis
- 12.1. Company Profiles
- 12.1.1 Zhengzhou Rongsheng Refractory
- 12.1.1.1. Company Overview
- 12.1.1.2. Products
- 12.1.1.3. Company Financials
- 12.1.1.4. SWOT Analysis
- 12.1.2 Stanford Advanced Materials (SAM)
- 12.1.2.1. Company Overview
- 12.1.2.2. Products
- 12.1.2.3. Company Financials
- 12.1.2.4. SWOT Analysis
- 12.1.3 Sijihuo Refractory
- 12.1.3.1. Company Overview
- 12.1.3.2. Products
- 12.1.3.3. Company Financials
- 12.1.3.4. SWOT Analysis
- 12.1.4 Zibo Luzhong Hong Refractory
- 12.1.4.1. Company Overview
- 12.1.4.2. Products
- 12.1.4.3. Company Financials
- 12.1.4.4. SWOT Analysis
- 12.1.5 Zhengzhou Huachen Refractory
- 12.1.5.1. Company Overview
- 12.1.5.2. Products
- 12.1.5.3. Company Financials
- 12.1.5.4. SWOT Analysis
- 12.1.6 Shandong Robert New Material
- 12.1.6.1. Company Overview
- 12.1.6.2. Products
- 12.1.6.3. Company Financials
- 12.1.6.4. SWOT Analysis
- 12.1.7 Henan Fire Ramo Industrial
- 12.1.7.1. Company Overview
- 12.1.7.2. Products
- 12.1.7.3. Company Financials
- 12.1.7.4. SWOT Analysis
- 12.1.8 Henan SNR Refractory
- 12.1.8.1. Company Overview
- 12.1.8.2. Products
- 12.1.8.3. Company Financials
- 12.1.8.4. SWOT Analysis
- 12.1.1 Zhengzhou Rongsheng Refractory
- 12.2. Market Entropy
- 12.2.1 Company's Key Areas Served
- 12.2.2 Recent Developments
- 12.3. Company Market Share Analysis 2025
- 12.3.1 Top 5 Companies Market Share Analysis
- 12.3.2 Top 3 Companies Market Share Analysis
- 12.4. List of Potential Customers
- 13. Research Methodology
List of Figures
- Figure 1: Global Silica Mullite Brick Revenue Breakdown (million, %) by Region 2025 & 2033
- Figure 2: North America Silica Mullite Brick Revenue (million), by Application 2025 & 2033
- Figure 3: North America Silica Mullite Brick Revenue Share (%), by Application 2025 & 2033
- Figure 4: North America Silica Mullite Brick Revenue (million), by Type 2025 & 2033
- Figure 5: North America Silica Mullite Brick Revenue Share (%), by Type 2025 & 2033
- Figure 6: North America Silica Mullite Brick Revenue (million), by Country 2025 & 2033
- Figure 7: North America Silica Mullite Brick Revenue Share (%), by Country 2025 & 2033
- Figure 8: South America Silica Mullite Brick Revenue (million), by Application 2025 & 2033
- Figure 9: South America Silica Mullite Brick Revenue Share (%), by Application 2025 & 2033
- Figure 10: South America Silica Mullite Brick Revenue (million), by Type 2025 & 2033
- Figure 11: South America Silica Mullite Brick Revenue Share (%), by Type 2025 & 2033
- Figure 12: South America Silica Mullite Brick Revenue (million), by Country 2025 & 2033
- Figure 13: South America Silica Mullite Brick Revenue Share (%), by Country 2025 & 2033
- Figure 14: Europe Silica Mullite Brick Revenue (million), by Application 2025 & 2033
- Figure 15: Europe Silica Mullite Brick Revenue Share (%), by Application 2025 & 2033
- Figure 16: Europe Silica Mullite Brick Revenue (million), by Type 2025 & 2033
- Figure 17: Europe Silica Mullite Brick Revenue Share (%), by Type 2025 & 2033
- Figure 18: Europe Silica Mullite Brick Revenue (million), by Country 2025 & 2033
- Figure 19: Europe Silica Mullite Brick Revenue Share (%), by Country 2025 & 2033
- Figure 20: Middle East & Africa Silica Mullite Brick Revenue (million), by Application 2025 & 2033
- Figure 21: Middle East & Africa Silica Mullite Brick Revenue Share (%), by Application 2025 & 2033
- Figure 22: Middle East & Africa Silica Mullite Brick Revenue (million), by Type 2025 & 2033
- Figure 23: Middle East & Africa Silica Mullite Brick Revenue Share (%), by Type 2025 & 2033
- Figure 24: Middle East & Africa Silica Mullite Brick Revenue (million), by Country 2025 & 2033
- Figure 25: Middle East & Africa Silica Mullite Brick Revenue Share (%), by Country 2025 & 2033
- Figure 26: Asia Pacific Silica Mullite Brick Revenue (million), by Application 2025 & 2033
- Figure 27: Asia Pacific Silica Mullite Brick Revenue Share (%), by Application 2025 & 2033
- Figure 28: Asia Pacific Silica Mullite Brick Revenue (million), by Type 2025 & 2033
- Figure 29: Asia Pacific Silica Mullite Brick Revenue Share (%), by Type 2025 & 2033
- Figure 30: Asia Pacific Silica Mullite Brick Revenue (million), by Country 2025 & 2033
- Figure 31: Asia Pacific Silica Mullite Brick Revenue Share (%), by Country 2025 & 2033
List of Tables
- Table 1: Global Silica Mullite Brick Revenue million Forecast, by Application 2020 & 2033
- Table 2: Global Silica Mullite Brick Revenue million Forecast, by Type 2020 & 2033
- Table 3: Global Silica Mullite Brick Revenue million Forecast, by Region 2020 & 2033
- Table 4: Global Silica Mullite Brick Revenue million Forecast, by Application 2020 & 2033
- Table 5: Global Silica Mullite Brick Revenue million Forecast, by Type 2020 & 2033
- Table 6: Global Silica Mullite Brick Revenue million Forecast, by Country 2020 & 2033
- Table 7: United States Silica Mullite Brick Revenue (million) Forecast, by Application 2020 & 2033
- Table 8: Canada Silica Mullite Brick Revenue (million) Forecast, by Application 2020 & 2033
- Table 9: Mexico Silica Mullite Brick Revenue (million) Forecast, by Application 2020 & 2033
- Table 10: Global Silica Mullite Brick Revenue million Forecast, by Application 2020 & 2033
- Table 11: Global Silica Mullite Brick Revenue million Forecast, by Type 2020 & 2033
- Table 12: Global Silica Mullite Brick Revenue million Forecast, by Country 2020 & 2033
- Table 13: Brazil Silica Mullite Brick Revenue (million) Forecast, by Application 2020 & 2033
- Table 14: Argentina Silica Mullite Brick Revenue (million) Forecast, by Application 2020 & 2033
- Table 15: Rest of South America Silica Mullite Brick Revenue (million) Forecast, by Application 2020 & 2033
- Table 16: Global Silica Mullite Brick Revenue million Forecast, by Application 2020 & 2033
- Table 17: Global Silica Mullite Brick Revenue million Forecast, by Type 2020 & 2033
- Table 18: Global Silica Mullite Brick Revenue million Forecast, by Country 2020 & 2033
- Table 19: United Kingdom Silica Mullite Brick Revenue (million) Forecast, by Application 2020 & 2033
- Table 20: Germany Silica Mullite Brick Revenue (million) Forecast, by Application 2020 & 2033
- Table 21: France Silica Mullite Brick Revenue (million) Forecast, by Application 2020 & 2033
- Table 22: Italy Silica Mullite Brick Revenue (million) Forecast, by Application 2020 & 2033
- Table 23: Spain Silica Mullite Brick Revenue (million) Forecast, by Application 2020 & 2033
- Table 24: Russia Silica Mullite Brick Revenue (million) Forecast, by Application 2020 & 2033
- Table 25: Benelux Silica Mullite Brick Revenue (million) Forecast, by Application 2020 & 2033
- Table 26: Nordics Silica Mullite Brick Revenue (million) Forecast, by Application 2020 & 2033
- Table 27: Rest of Europe Silica Mullite Brick Revenue (million) Forecast, by Application 2020 & 2033
- Table 28: Global Silica Mullite Brick Revenue million Forecast, by Application 2020 & 2033
- Table 29: Global Silica Mullite Brick Revenue million Forecast, by Type 2020 & 2033
- Table 30: Global Silica Mullite Brick Revenue million Forecast, by Country 2020 & 2033
- Table 31: Turkey Silica Mullite Brick Revenue (million) Forecast, by Application 2020 & 2033
- Table 32: Israel Silica Mullite Brick Revenue (million) Forecast, by Application 2020 & 2033
- Table 33: GCC Silica Mullite Brick Revenue (million) Forecast, by Application 2020 & 2033
- Table 34: North Africa Silica Mullite Brick Revenue (million) Forecast, by Application 2020 & 2033
- Table 35: South Africa Silica Mullite Brick Revenue (million) Forecast, by Application 2020 & 2033
- Table 36: Rest of Middle East & Africa Silica Mullite Brick Revenue (million) Forecast, by Application 2020 & 2033
- Table 37: Global Silica Mullite Brick Revenue million Forecast, by Application 2020 & 2033
- Table 38: Global Silica Mullite Brick Revenue million Forecast, by Type 2020 & 2033
- Table 39: Global Silica Mullite Brick Revenue million Forecast, by Country 2020 & 2033
- Table 40: China Silica Mullite Brick Revenue (million) Forecast, by Application 2020 & 2033
- Table 41: India Silica Mullite Brick Revenue (million) Forecast, by Application 2020 & 2033
- Table 42: Japan Silica Mullite Brick Revenue (million) Forecast, by Application 2020 & 2033
- Table 43: South Korea Silica Mullite Brick Revenue (million) Forecast, by Application 2020 & 2033
- Table 44: ASEAN Silica Mullite Brick Revenue (million) Forecast, by Application 2020 & 2033
- Table 45: Oceania Silica Mullite Brick Revenue (million) Forecast, by Application 2020 & 2033
- Table 46: Rest of Asia Pacific Silica Mullite Brick Revenue (million) Forecast, by Application 2020 & 2033
Frequently Asked Questions
1. What is the projected Compound Annual Growth Rate (CAGR) of the Silica Mullite Brick?
The projected CAGR is approximately 2.2%.
2. Which companies are prominent players in the Silica Mullite Brick?
Key companies in the market include Zhengzhou Rongsheng Refractory, Stanford Advanced Materials (SAM), Sijihuo Refractory, Zibo Luzhong Hong Refractory, Zhengzhou Huachen Refractory, Shandong Robert New Material, Henan Fire Ramo Industrial, Henan SNR Refractory.
3. What are the main segments of the Silica Mullite Brick?
The market segments include Application, Type.
4. Can you provide details about the market size?
The market size is estimated to be USD 229 million as of 2022.
5. What are some drivers contributing to market growth?
N/A
6. What are the notable trends driving market growth?
N/A
7. Are there any restraints impacting market growth?
N/A
8. Can you provide examples of recent developments in the market?
N/A
9. What pricing options are available for accessing the report?
Pricing options include single-user, multi-user, and enterprise licenses priced at USD 2900.00, USD 4350.00, and USD 5800.00 respectively.
10. Is the market size provided in terms of value or volume?
The market size is provided in terms of value, measured in million.
11. Are there any specific market keywords associated with the report?
Yes, the market keyword associated with the report is "Silica Mullite Brick," which aids in identifying and referencing the specific market segment covered.
12. How do I determine which pricing option suits my needs best?
The pricing options vary based on user requirements and access needs. Individual users may opt for single-user licenses, while businesses requiring broader access may choose multi-user or enterprise licenses for cost-effective access to the report.
13. Are there any additional resources or data provided in the Silica Mullite Brick report?
While the report offers comprehensive insights, it's advisable to review the specific contents or supplementary materials provided to ascertain if additional resources or data are available.
14. How can I stay updated on further developments or reports in the Silica Mullite Brick?
To stay informed about further developments, trends, and reports in the Silica Mullite Brick, consider subscribing to industry newsletters, following relevant companies and organizations, or regularly checking reputable industry news sources and publications.
Methodology
Step 1 - Identification of Relevant Samples Size from Population Database


Step 2 - Approaches for Defining Global Market Size (Value, Volume* & Price*)

Note*: In applicable scenarios
Step 3 - Data Sources
Primary Research
- Web Analytics
- Survey Reports
- Research Institute
- Latest Research Reports
- Opinion Leaders
Secondary Research
- Annual Reports
- White Paper
- Latest Press Release
- Industry Association
- Paid Database
- Investor Presentations

Step 4 - Data Triangulation
Involves using different sources of information in order to increase the validity of a study
These sources are likely to be stakeholders in a program - participants, other researchers, program staff, other community members, and so on.
Then we put all data in single framework & apply various statistical tools to find out the dynamic on the market.
During the analysis stage, feedback from the stakeholder groups would be compared to determine areas of agreement as well as areas of divergence