
Key Insights
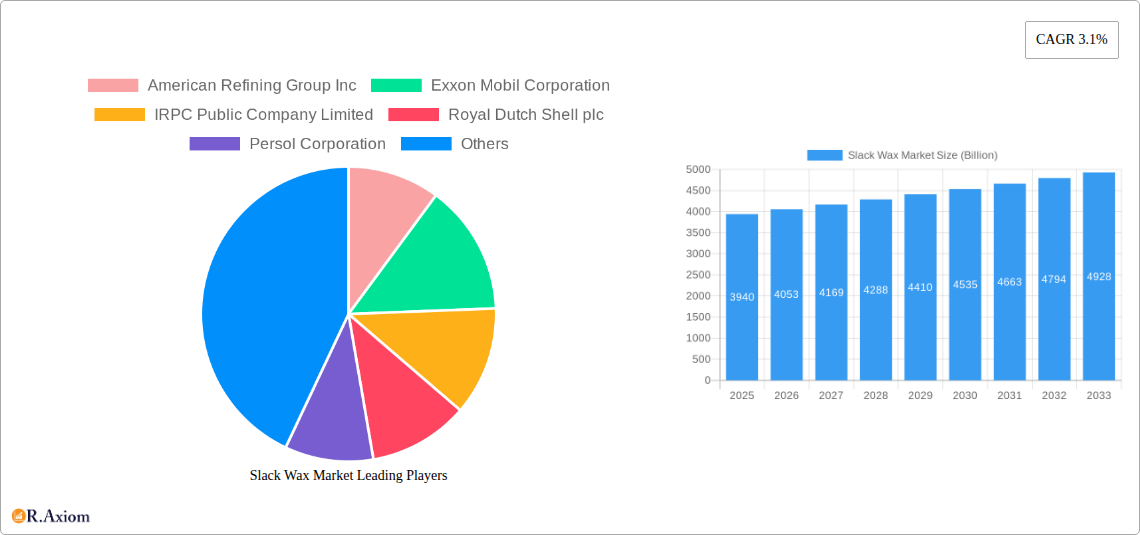
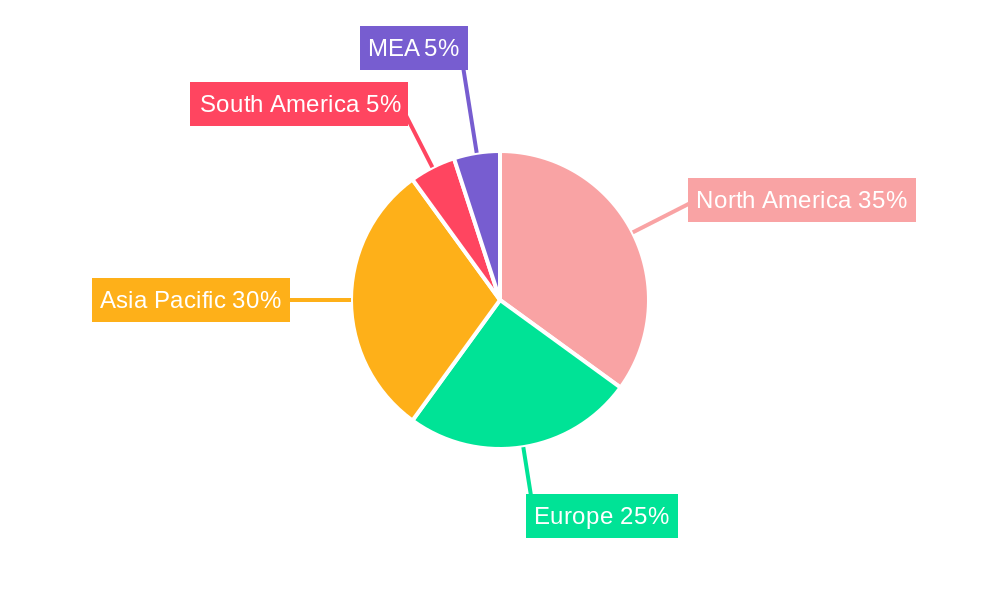
The slack wax market, valued at $3.94 billion in 2025, is projected to experience steady growth, driven by increasing demand across diverse applications. A Compound Annual Growth Rate (CAGR) of 3.1% from 2025 to 2033 indicates a positive market outlook, primarily fueled by the expanding construction and packaging industries' reliance on slack wax for its waterproofing and protective properties. The market segmentation reveals significant opportunities within the light slack wax category, particularly in applications like candle manufacturing and cosmetics, which are projected to experience faster growth than the heavy slack wax segment due to evolving consumer preferences and increased use in specialty products. The dominant regional markets are expected to remain North America and Asia-Pacific, reflecting robust industrial activity and substantial consumption in these regions. However, emerging economies in regions such as South America and the Middle East & Africa present considerable untapped potential for future growth, driven by infrastructure development and rising disposable incomes. Competition within the market is moderate, with key players like ExxonMobil, Shell, and IRPC focusing on expanding their product portfolios and geographical reach to maintain market share. Challenges include fluctuating crude oil prices, which directly impact production costs, and environmental concerns related to the manufacturing process, necessitating the adoption of sustainable practices to maintain market competitiveness.
Further analysis suggests that the growth in the candle and cosmetic sectors, coupled with the increasing use of slack wax in construction boards for insulation and waterproofing, will be key drivers for market expansion. The diversification of applications, including rust protection and paraffin manufacturing, contributes to market resilience. While factors like price volatility and environmental regulations might present challenges, the overall trend points towards continued growth, with regional variations influenced by economic development and specific industry demands. The market is expected to see innovation in sustainable production methods and higher-value applications, which will further influence its trajectory. The competitive landscape favors established players with strong global reach, but also presents openings for specialized companies catering to niche applications.
Slack Wax Market: A Comprehensive Analysis & Forecast (2019-2033)
This comprehensive report provides a detailed analysis of the global Slack Wax market, projecting a market valuation exceeding $XX Billion by 2033. The study covers the historical period (2019-2024), the base year (2025), and the forecast period (2025-2033), offering valuable insights for industry stakeholders seeking to navigate this dynamic market. Key players like American Refining Group Inc, Exxon Mobil Corporation, IRPC Public Company Limited, Royal Dutch Shell plc, and others are profiled, enabling strategic decision-making.
Slack Wax Market Market Concentration & Innovation
The Slack Wax market exhibits a moderately concentrated landscape, with a few major players holding significant market share. American Refining Group Inc and Exxon Mobil Corporation are estimated to collectively hold over XX% of the market share in 2025, demonstrating their established presence and significant production capacity. However, smaller players, particularly regional producers, contribute considerably to overall market volume.
Innovation in the Slack Wax market is primarily driven by the need for higher-quality products catering to specialized applications, necessitating advancements in refining processes and product formulations. Regulatory frameworks concerning environmental impact and product safety are also shaping innovation. Significant M&A activity is observed, with several deals exceeding $XX Billion in value over the past five years, aiming to consolidate market share and expand product portfolios. The introduction of bio-based slack wax alternatives is another key innovative development affecting market dynamics.
- Market Concentration: High, with top 5 players holding approximately XX% of market share in 2025.
- Innovation Drivers: Demand for specialized applications, environmental regulations, and M&A activity.
- M&A Activity: Several deals exceeding $XX Billion in value between 2020 and 2024.
- Regulatory Frameworks: Stringent environmental regulations impacting production processes and product composition.
- Product Substitutes: Bio-based alternatives are emerging and increasing competition.
Slack Wax Market Industry Trends & Insights
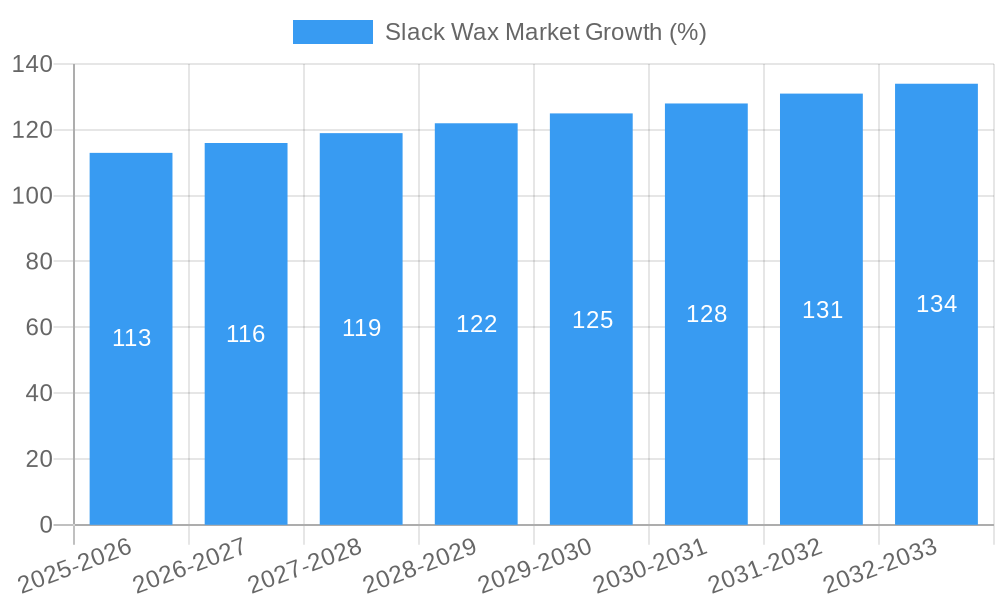
The Slack Wax market is experiencing robust growth, with a projected CAGR of XX% during the forecast period. Several factors contribute to this growth, including increasing demand from key application segments like candles, polishes, and construction materials. Technological advancements in refining techniques are also leading to improved product quality and cost efficiency. Changing consumer preferences toward eco-friendly products are influencing the adoption of sustainable slack wax alternatives. Competitive dynamics are marked by ongoing innovation, strategic partnerships, and increased investments in research and development. Market penetration in emerging economies is expected to propel future growth. The shift towards specialized slack wax types tailored for specific applications is further contributing to the expansion of the market. The overall growth is further influenced by the global economic environment and fluctuations in crude oil prices.
Dominant Markets & Segments in Slack Wax Market
The Asia-Pacific region, particularly countries like China and India, holds a dominant position in the Slack Wax market, driven by robust economic growth, expanding infrastructure development, and increasing consumption in various application segments. The dominance of the region is also influenced by the high concentration of major players and substantial production capacity.
- Leading Region: Asia-Pacific
- Key Drivers in Asia-Pacific: Rapid industrialization, expanding infrastructure projects, increasing population, and rising demand for candles and polishes.
- Dominant Segment (Type): Heavy slack wax accounts for a larger market share due to its versatility in applications like construction boards and rust protection.
- Dominant Segment (Application): The construction board segment demonstrates strong growth, driven by the booming construction industry in developing economies. This segment is predicted to represent approximately $XX Billion in revenue by 2033.
Slack Wax Market Product Developments
Recent product developments focus on enhanced purity, improved performance characteristics, and specialized formulations tailored for specific applications. Innovations include the development of bio-based slack wax alternatives to cater to the growing demand for sustainable products and meet stringent environmental regulations. These developments contribute to competitive advantages by providing superior product quality and improved market fit.
Report Scope & Segmentation Analysis
This report segments the Slack Wax market by type (Light and Heavy) and application (Emulsions, Candles, Construction Boards, Polishes, Rust Protection, Paraffin Manufacturing, and Other Applications). Each segment is analyzed based on market size, growth projections, and competitive dynamics. For example, the heavy slack wax segment is expected to grow at a faster rate than the light slack wax segment due to its prevalent use in diverse applications. Similarly, the construction board application is projected to witness significant growth driven by the expanding global construction sector.
Key Drivers of Slack Wax Market Growth
Several factors contribute to the growth of the Slack Wax market. These include the increasing demand from various industries such as construction, cosmetics, and pharmaceuticals; the continuous technological advancements in refining processes resulting in better quality and cost-effective production; favorable government policies promoting industrial development, and the rising consumer preference for eco-friendly products that drive the adoption of bio-based alternatives.
Challenges in the Slack Wax Market Sector
The Slack Wax market faces challenges such as fluctuations in crude oil prices impacting production costs, stringent environmental regulations increasing compliance costs, and intense competition from existing and emerging players. Supply chain disruptions and the need for sustainable and eco-friendly products present additional challenges for market players. These factors collectively impact overall market profitability and growth.
Emerging Opportunities in Slack Wax Market
Emerging opportunities lie in the growing demand for bio-based slack wax and the development of specialized formulations for niche applications. Expanding into new markets, particularly in developing economies, presents significant growth potential. Advancements in refining technologies leading to higher product purity and efficiency provide further opportunities.
Leading Players in the Slack Wax Market Market
- American Refining Group Inc
- Exxon Mobil Corporation
- IRPC Public Company Limited
- Royal Dutch Shell plc
- Persol Corporation
- IRANOL
- Industrial Raw Materials LLC
- Carmel Industries
- Panama Petrochem Ltd
- THAI OIL
- Meade-King Robinson & Co Ltd
Key Developments in Slack Wax Market Industry
- 2022-Q4: Exxon Mobil Corporation announces a significant investment in upgrading its slack wax refining facilities.
- 2023-Q1: Introduction of a new bio-based slack wax alternative by a leading European producer.
- 2023-Q3: Merger between two mid-sized Slack Wax producers in North America.
Strategic Outlook for Slack Wax Market Market
The Slack Wax market holds immense growth potential, driven by increasing demand from diverse sectors and ongoing technological advancements. Strategic investments in research and development, focus on sustainable and eco-friendly products, and exploration of emerging markets will be key factors determining future success in this dynamic market. The continuous shift towards higher value-added applications will further contribute to the growth trajectory of the market.
Slack Wax Market Segmentation
-
1. Type
- 1.1. Light
- 1.2. Heavy
-
2. Application
- 2.1. Emulsions
- 2.2. Candles
- 2.3. Construction Boards
- 2.4. Polishes
- 2.5. Rust Protection
- 2.6. Paraffin Manufacturing
- 2.7. Other Applications
Slack Wax Market Segmentation By Geography
-
1. Asia Pacific
- 1.1. China
- 1.2. India
- 1.3. Japan
- 1.4. South Korea
- 1.5. ASEAN Countries
- 1.6. Rest of Asia Pacific
-
2. North America
- 2.1. United States
- 2.2. Canada
- 2.3. Mexico
-
3. Europe
- 3.1. Germany
- 3.2. United Kingdom
- 3.3. Italy
- 3.4. France
- 3.5. Rest of Europe
-
4. South America
- 4.1. Brazil
- 4.2. Argentina
- 4.3. Rest of South America
-
5. Middle East and Africa
- 5.1. Saudi Arabia
- 5.2. South Africa
- 5.3. Rest of Middle East and Africa
Slack Wax Market REPORT HIGHLIGHTS
| Aspects | Details |
|---|---|
| Study Period | 2019-2033 |
| Base Year | 2024 |
| Estimated Year | 2025 |
| Forecast Period | 2025-2033 |
| Historical Period | 2019-2024 |
| Growth Rate | CAGR of 3.1% from 2019-2033 |
| Segmentation |
|
Table of Contents
- 1. Introduction
- 1.1. Research Scope
- 1.2. Market Segmentation
- 1.3. Research Methodology
- 1.4. Definitions and Assumptions
- 2. Executive Summary
- 2.1. Introduction
- 3. Market Dynamics
- 3.1. Introduction
- 3.2. Market Drivers
- 3.2.1. ; Increasing Usage of Wax Emulsions in Various End-user Industries; Other Drivers
- 3.3. Market Restrains
- 3.3.1. Fluctuation in Prices of Metal
- 3.4. Market Trends
- 3.4.1. Increasing Demand for Emulsions in Personal Care Industry
- 4. Market Factor Analysis
- 4.1. Porters Five Forces
- 4.2. Supply/Value Chain
- 4.3. PESTEL analysis
- 4.4. Market Entropy
- 4.5. Patent/Trademark Analysis
- 5. Global Slack Wax Market Analysis, Insights and Forecast, 2019-2031
- 5.1. Market Analysis, Insights and Forecast - by Type
- 5.1.1. Light
- 5.1.2. Heavy
- 5.2. Market Analysis, Insights and Forecast - by Application
- 5.2.1. Emulsions
- 5.2.2. Candles
- 5.2.3. Construction Boards
- 5.2.4. Polishes
- 5.2.5. Rust Protection
- 5.2.6. Paraffin Manufacturing
- 5.2.7. Other Applications
- 5.3. Market Analysis, Insights and Forecast - by Region
- 5.3.1. Asia Pacific
- 5.3.2. North America
- 5.3.3. Europe
- 5.3.4. South America
- 5.3.5. Middle East and Africa
- 5.1. Market Analysis, Insights and Forecast - by Type
- 6. Asia Pacific Slack Wax Market Analysis, Insights and Forecast, 2019-2031
- 6.1. Market Analysis, Insights and Forecast - by Type
- 6.1.1. Light
- 6.1.2. Heavy
- 6.2. Market Analysis, Insights and Forecast - by Application
- 6.2.1. Emulsions
- 6.2.2. Candles
- 6.2.3. Construction Boards
- 6.2.4. Polishes
- 6.2.5. Rust Protection
- 6.2.6. Paraffin Manufacturing
- 6.2.7. Other Applications
- 6.1. Market Analysis, Insights and Forecast - by Type
- 7. North America Slack Wax Market Analysis, Insights and Forecast, 2019-2031
- 7.1. Market Analysis, Insights and Forecast - by Type
- 7.1.1. Light
- 7.1.2. Heavy
- 7.2. Market Analysis, Insights and Forecast - by Application
- 7.2.1. Emulsions
- 7.2.2. Candles
- 7.2.3. Construction Boards
- 7.2.4. Polishes
- 7.2.5. Rust Protection
- 7.2.6. Paraffin Manufacturing
- 7.2.7. Other Applications
- 7.1. Market Analysis, Insights and Forecast - by Type
- 8. Europe Slack Wax Market Analysis, Insights and Forecast, 2019-2031
- 8.1. Market Analysis, Insights and Forecast - by Type
- 8.1.1. Light
- 8.1.2. Heavy
- 8.2. Market Analysis, Insights and Forecast - by Application
- 8.2.1. Emulsions
- 8.2.2. Candles
- 8.2.3. Construction Boards
- 8.2.4. Polishes
- 8.2.5. Rust Protection
- 8.2.6. Paraffin Manufacturing
- 8.2.7. Other Applications
- 8.1. Market Analysis, Insights and Forecast - by Type
- 9. South America Slack Wax Market Analysis, Insights and Forecast, 2019-2031
- 9.1. Market Analysis, Insights and Forecast - by Type
- 9.1.1. Light
- 9.1.2. Heavy
- 9.2. Market Analysis, Insights and Forecast - by Application
- 9.2.1. Emulsions
- 9.2.2. Candles
- 9.2.3. Construction Boards
- 9.2.4. Polishes
- 9.2.5. Rust Protection
- 9.2.6. Paraffin Manufacturing
- 9.2.7. Other Applications
- 9.1. Market Analysis, Insights and Forecast - by Type
- 10. Middle East and Africa Slack Wax Market Analysis, Insights and Forecast, 2019-2031
- 10.1. Market Analysis, Insights and Forecast - by Type
- 10.1.1. Light
- 10.1.2. Heavy
- 10.2. Market Analysis, Insights and Forecast - by Application
- 10.2.1. Emulsions
- 10.2.2. Candles
- 10.2.3. Construction Boards
- 10.2.4. Polishes
- 10.2.5. Rust Protection
- 10.2.6. Paraffin Manufacturing
- 10.2.7. Other Applications
- 10.1. Market Analysis, Insights and Forecast - by Type
- 11. North America Slack Wax Market Analysis, Insights and Forecast, 2019-2031
- 11.1. Market Analysis, Insights and Forecast - By Country/Sub-region
- 11.1.1 United States
- 11.1.2 Canada
- 11.1.3 Mexico
- 12. Europe Slack Wax Market Analysis, Insights and Forecast, 2019-2031
- 12.1. Market Analysis, Insights and Forecast - By Country/Sub-region
- 12.1.1 Germany
- 12.1.2 France
- 12.1.3 Italy
- 12.1.4 United Kingdom
- 12.1.5 Netherlands
- 12.1.6 Rest of Europe
- 13. Asia Pacific Slack Wax Market Analysis, Insights and Forecast, 2019-2031
- 13.1. Market Analysis, Insights and Forecast - By Country/Sub-region
- 13.1.1 China
- 13.1.2 Japan
- 13.1.3 India
- 13.1.4 South Korea
- 13.1.5 Taiwan
- 13.1.6 Australia
- 13.1.7 Rest of Asia-Pacific
- 14. South America Slack Wax Market Analysis, Insights and Forecast, 2019-2031
- 14.1. Market Analysis, Insights and Forecast - By Country/Sub-region
- 14.1.1 Brazil
- 14.1.2 Argentina
- 14.1.3 Rest of South America
- 15. MEA Slack Wax Market Analysis, Insights and Forecast, 2019-2031
- 15.1. Market Analysis, Insights and Forecast - By Country/Sub-region
- 15.1.1 Middle East
- 15.1.2 Africa
- 16. Competitive Analysis
- 16.1. Global Market Share Analysis 2024
- 16.2. Company Profiles
- 16.2.1 American Refining Group Inc
- 16.2.1.1. Overview
- 16.2.1.2. Products
- 16.2.1.3. SWOT Analysis
- 16.2.1.4. Recent Developments
- 16.2.1.5. Financials (Based on Availability)
- 16.2.2 Exxon Mobil Corporation
- 16.2.2.1. Overview
- 16.2.2.2. Products
- 16.2.2.3. SWOT Analysis
- 16.2.2.4. Recent Developments
- 16.2.2.5. Financials (Based on Availability)
- 16.2.3 IRPC Public Company Limited
- 16.2.3.1. Overview
- 16.2.3.2. Products
- 16.2.3.3. SWOT Analysis
- 16.2.3.4. Recent Developments
- 16.2.3.5. Financials (Based on Availability)
- 16.2.4 Royal Dutch Shell plc
- 16.2.4.1. Overview
- 16.2.4.2. Products
- 16.2.4.3. SWOT Analysis
- 16.2.4.4. Recent Developments
- 16.2.4.5. Financials (Based on Availability)
- 16.2.5 Persol Corporation
- 16.2.5.1. Overview
- 16.2.5.2. Products
- 16.2.5.3. SWOT Analysis
- 16.2.5.4. Recent Developments
- 16.2.5.5. Financials (Based on Availability)
- 16.2.6 IRANOL
- 16.2.6.1. Overview
- 16.2.6.2. Products
- 16.2.6.3. SWOT Analysis
- 16.2.6.4. Recent Developments
- 16.2.6.5. Financials (Based on Availability)
- 16.2.7 Industrial Raw Materials LLC
- 16.2.7.1. Overview
- 16.2.7.2. Products
- 16.2.7.3. SWOT Analysis
- 16.2.7.4. Recent Developments
- 16.2.7.5. Financials (Based on Availability)
- 16.2.8 Carmel Industries
- 16.2.8.1. Overview
- 16.2.8.2. Products
- 16.2.8.3. SWOT Analysis
- 16.2.8.4. Recent Developments
- 16.2.8.5. Financials (Based on Availability)
- 16.2.9 Panama Petrochem Ltd
- 16.2.9.1. Overview
- 16.2.9.2. Products
- 16.2.9.3. SWOT Analysis
- 16.2.9.4. Recent Developments
- 16.2.9.5. Financials (Based on Availability)
- 16.2.10 THAI OIL
- 16.2.10.1. Overview
- 16.2.10.2. Products
- 16.2.10.3. SWOT Analysis
- 16.2.10.4. Recent Developments
- 16.2.10.5. Financials (Based on Availability)
- 16.2.11 Meade-King Robinson & Co Ltd
- 16.2.11.1. Overview
- 16.2.11.2. Products
- 16.2.11.3. SWOT Analysis
- 16.2.11.4. Recent Developments
- 16.2.11.5. Financials (Based on Availability)
- 16.2.1 American Refining Group Inc
List of Figures
- Figure 1: Global Slack Wax Market Revenue Breakdown (Billion, %) by Region 2024 & 2032
- Figure 2: Global Slack Wax Market Volume Breakdown (K Tons, %) by Region 2024 & 2032
- Figure 3: North America Slack Wax Market Revenue (Billion), by Country 2024 & 2032
- Figure 4: North America Slack Wax Market Volume (K Tons), by Country 2024 & 2032
- Figure 5: North America Slack Wax Market Revenue Share (%), by Country 2024 & 2032
- Figure 6: North America Slack Wax Market Volume Share (%), by Country 2024 & 2032
- Figure 7: Europe Slack Wax Market Revenue (Billion), by Country 2024 & 2032
- Figure 8: Europe Slack Wax Market Volume (K Tons), by Country 2024 & 2032
- Figure 9: Europe Slack Wax Market Revenue Share (%), by Country 2024 & 2032
- Figure 10: Europe Slack Wax Market Volume Share (%), by Country 2024 & 2032
- Figure 11: Asia Pacific Slack Wax Market Revenue (Billion), by Country 2024 & 2032
- Figure 12: Asia Pacific Slack Wax Market Volume (K Tons), by Country 2024 & 2032
- Figure 13: Asia Pacific Slack Wax Market Revenue Share (%), by Country 2024 & 2032
- Figure 14: Asia Pacific Slack Wax Market Volume Share (%), by Country 2024 & 2032
- Figure 15: South America Slack Wax Market Revenue (Billion), by Country 2024 & 2032
- Figure 16: South America Slack Wax Market Volume (K Tons), by Country 2024 & 2032
- Figure 17: South America Slack Wax Market Revenue Share (%), by Country 2024 & 2032
- Figure 18: South America Slack Wax Market Volume Share (%), by Country 2024 & 2032
- Figure 19: MEA Slack Wax Market Revenue (Billion), by Country 2024 & 2032
- Figure 20: MEA Slack Wax Market Volume (K Tons), by Country 2024 & 2032
- Figure 21: MEA Slack Wax Market Revenue Share (%), by Country 2024 & 2032
- Figure 22: MEA Slack Wax Market Volume Share (%), by Country 2024 & 2032
- Figure 23: Asia Pacific Slack Wax Market Revenue (Billion), by Type 2024 & 2032
- Figure 24: Asia Pacific Slack Wax Market Volume (K Tons), by Type 2024 & 2032
- Figure 25: Asia Pacific Slack Wax Market Revenue Share (%), by Type 2024 & 2032
- Figure 26: Asia Pacific Slack Wax Market Volume Share (%), by Type 2024 & 2032
- Figure 27: Asia Pacific Slack Wax Market Revenue (Billion), by Application 2024 & 2032
- Figure 28: Asia Pacific Slack Wax Market Volume (K Tons), by Application 2024 & 2032
- Figure 29: Asia Pacific Slack Wax Market Revenue Share (%), by Application 2024 & 2032
- Figure 30: Asia Pacific Slack Wax Market Volume Share (%), by Application 2024 & 2032
- Figure 31: Asia Pacific Slack Wax Market Revenue (Billion), by Country 2024 & 2032
- Figure 32: Asia Pacific Slack Wax Market Volume (K Tons), by Country 2024 & 2032
- Figure 33: Asia Pacific Slack Wax Market Revenue Share (%), by Country 2024 & 2032
- Figure 34: Asia Pacific Slack Wax Market Volume Share (%), by Country 2024 & 2032
- Figure 35: North America Slack Wax Market Revenue (Billion), by Type 2024 & 2032
- Figure 36: North America Slack Wax Market Volume (K Tons), by Type 2024 & 2032
- Figure 37: North America Slack Wax Market Revenue Share (%), by Type 2024 & 2032
- Figure 38: North America Slack Wax Market Volume Share (%), by Type 2024 & 2032
- Figure 39: North America Slack Wax Market Revenue (Billion), by Application 2024 & 2032
- Figure 40: North America Slack Wax Market Volume (K Tons), by Application 2024 & 2032
- Figure 41: North America Slack Wax Market Revenue Share (%), by Application 2024 & 2032
- Figure 42: North America Slack Wax Market Volume Share (%), by Application 2024 & 2032
- Figure 43: North America Slack Wax Market Revenue (Billion), by Country 2024 & 2032
- Figure 44: North America Slack Wax Market Volume (K Tons), by Country 2024 & 2032
- Figure 45: North America Slack Wax Market Revenue Share (%), by Country 2024 & 2032
- Figure 46: North America Slack Wax Market Volume Share (%), by Country 2024 & 2032
- Figure 47: Europe Slack Wax Market Revenue (Billion), by Type 2024 & 2032
- Figure 48: Europe Slack Wax Market Volume (K Tons), by Type 2024 & 2032
- Figure 49: Europe Slack Wax Market Revenue Share (%), by Type 2024 & 2032
- Figure 50: Europe Slack Wax Market Volume Share (%), by Type 2024 & 2032
- Figure 51: Europe Slack Wax Market Revenue (Billion), by Application 2024 & 2032
- Figure 52: Europe Slack Wax Market Volume (K Tons), by Application 2024 & 2032
- Figure 53: Europe Slack Wax Market Revenue Share (%), by Application 2024 & 2032
- Figure 54: Europe Slack Wax Market Volume Share (%), by Application 2024 & 2032
- Figure 55: Europe Slack Wax Market Revenue (Billion), by Country 2024 & 2032
- Figure 56: Europe Slack Wax Market Volume (K Tons), by Country 2024 & 2032
- Figure 57: Europe Slack Wax Market Revenue Share (%), by Country 2024 & 2032
- Figure 58: Europe Slack Wax Market Volume Share (%), by Country 2024 & 2032
- Figure 59: South America Slack Wax Market Revenue (Billion), by Type 2024 & 2032
- Figure 60: South America Slack Wax Market Volume (K Tons), by Type 2024 & 2032
- Figure 61: South America Slack Wax Market Revenue Share (%), by Type 2024 & 2032
- Figure 62: South America Slack Wax Market Volume Share (%), by Type 2024 & 2032
- Figure 63: South America Slack Wax Market Revenue (Billion), by Application 2024 & 2032
- Figure 64: South America Slack Wax Market Volume (K Tons), by Application 2024 & 2032
- Figure 65: South America Slack Wax Market Revenue Share (%), by Application 2024 & 2032
- Figure 66: South America Slack Wax Market Volume Share (%), by Application 2024 & 2032
- Figure 67: South America Slack Wax Market Revenue (Billion), by Country 2024 & 2032
- Figure 68: South America Slack Wax Market Volume (K Tons), by Country 2024 & 2032
- Figure 69: South America Slack Wax Market Revenue Share (%), by Country 2024 & 2032
- Figure 70: South America Slack Wax Market Volume Share (%), by Country 2024 & 2032
- Figure 71: Middle East and Africa Slack Wax Market Revenue (Billion), by Type 2024 & 2032
- Figure 72: Middle East and Africa Slack Wax Market Volume (K Tons), by Type 2024 & 2032
- Figure 73: Middle East and Africa Slack Wax Market Revenue Share (%), by Type 2024 & 2032
- Figure 74: Middle East and Africa Slack Wax Market Volume Share (%), by Type 2024 & 2032
- Figure 75: Middle East and Africa Slack Wax Market Revenue (Billion), by Application 2024 & 2032
- Figure 76: Middle East and Africa Slack Wax Market Volume (K Tons), by Application 2024 & 2032
- Figure 77: Middle East and Africa Slack Wax Market Revenue Share (%), by Application 2024 & 2032
- Figure 78: Middle East and Africa Slack Wax Market Volume Share (%), by Application 2024 & 2032
- Figure 79: Middle East and Africa Slack Wax Market Revenue (Billion), by Country 2024 & 2032
- Figure 80: Middle East and Africa Slack Wax Market Volume (K Tons), by Country 2024 & 2032
- Figure 81: Middle East and Africa Slack Wax Market Revenue Share (%), by Country 2024 & 2032
- Figure 82: Middle East and Africa Slack Wax Market Volume Share (%), by Country 2024 & 2032
List of Tables
- Table 1: Global Slack Wax Market Revenue Billion Forecast, by Region 2019 & 2032
- Table 2: Global Slack Wax Market Volume K Tons Forecast, by Region 2019 & 2032
- Table 3: Global Slack Wax Market Revenue Billion Forecast, by Type 2019 & 2032
- Table 4: Global Slack Wax Market Volume K Tons Forecast, by Type 2019 & 2032
- Table 5: Global Slack Wax Market Revenue Billion Forecast, by Application 2019 & 2032
- Table 6: Global Slack Wax Market Volume K Tons Forecast, by Application 2019 & 2032
- Table 7: Global Slack Wax Market Revenue Billion Forecast, by Region 2019 & 2032
- Table 8: Global Slack Wax Market Volume K Tons Forecast, by Region 2019 & 2032
- Table 9: Global Slack Wax Market Revenue Billion Forecast, by Country 2019 & 2032
- Table 10: Global Slack Wax Market Volume K Tons Forecast, by Country 2019 & 2032
- Table 11: United States Slack Wax Market Revenue (Billion) Forecast, by Application 2019 & 2032
- Table 12: United States Slack Wax Market Volume (K Tons) Forecast, by Application 2019 & 2032
- Table 13: Canada Slack Wax Market Revenue (Billion) Forecast, by Application 2019 & 2032
- Table 14: Canada Slack Wax Market Volume (K Tons) Forecast, by Application 2019 & 2032
- Table 15: Mexico Slack Wax Market Revenue (Billion) Forecast, by Application 2019 & 2032
- Table 16: Mexico Slack Wax Market Volume (K Tons) Forecast, by Application 2019 & 2032
- Table 17: Global Slack Wax Market Revenue Billion Forecast, by Country 2019 & 2032
- Table 18: Global Slack Wax Market Volume K Tons Forecast, by Country 2019 & 2032
- Table 19: Germany Slack Wax Market Revenue (Billion) Forecast, by Application 2019 & 2032
- Table 20: Germany Slack Wax Market Volume (K Tons) Forecast, by Application 2019 & 2032
- Table 21: France Slack Wax Market Revenue (Billion) Forecast, by Application 2019 & 2032
- Table 22: France Slack Wax Market Volume (K Tons) Forecast, by Application 2019 & 2032
- Table 23: Italy Slack Wax Market Revenue (Billion) Forecast, by Application 2019 & 2032
- Table 24: Italy Slack Wax Market Volume (K Tons) Forecast, by Application 2019 & 2032
- Table 25: United Kingdom Slack Wax Market Revenue (Billion) Forecast, by Application 2019 & 2032
- Table 26: United Kingdom Slack Wax Market Volume (K Tons) Forecast, by Application 2019 & 2032
- Table 27: Netherlands Slack Wax Market Revenue (Billion) Forecast, by Application 2019 & 2032
- Table 28: Netherlands Slack Wax Market Volume (K Tons) Forecast, by Application 2019 & 2032
- Table 29: Rest of Europe Slack Wax Market Revenue (Billion) Forecast, by Application 2019 & 2032
- Table 30: Rest of Europe Slack Wax Market Volume (K Tons) Forecast, by Application 2019 & 2032
- Table 31: Global Slack Wax Market Revenue Billion Forecast, by Country 2019 & 2032
- Table 32: Global Slack Wax Market Volume K Tons Forecast, by Country 2019 & 2032
- Table 33: China Slack Wax Market Revenue (Billion) Forecast, by Application 2019 & 2032
- Table 34: China Slack Wax Market Volume (K Tons) Forecast, by Application 2019 & 2032
- Table 35: Japan Slack Wax Market Revenue (Billion) Forecast, by Application 2019 & 2032
- Table 36: Japan Slack Wax Market Volume (K Tons) Forecast, by Application 2019 & 2032
- Table 37: India Slack Wax Market Revenue (Billion) Forecast, by Application 2019 & 2032
- Table 38: India Slack Wax Market Volume (K Tons) Forecast, by Application 2019 & 2032
- Table 39: South Korea Slack Wax Market Revenue (Billion) Forecast, by Application 2019 & 2032
- Table 40: South Korea Slack Wax Market Volume (K Tons) Forecast, by Application 2019 & 2032
- Table 41: Taiwan Slack Wax Market Revenue (Billion) Forecast, by Application 2019 & 2032
- Table 42: Taiwan Slack Wax Market Volume (K Tons) Forecast, by Application 2019 & 2032
- Table 43: Australia Slack Wax Market Revenue (Billion) Forecast, by Application 2019 & 2032
- Table 44: Australia Slack Wax Market Volume (K Tons) Forecast, by Application 2019 & 2032
- Table 45: Rest of Asia-Pacific Slack Wax Market Revenue (Billion) Forecast, by Application 2019 & 2032
- Table 46: Rest of Asia-Pacific Slack Wax Market Volume (K Tons) Forecast, by Application 2019 & 2032
- Table 47: Global Slack Wax Market Revenue Billion Forecast, by Country 2019 & 2032
- Table 48: Global Slack Wax Market Volume K Tons Forecast, by Country 2019 & 2032
- Table 49: Brazil Slack Wax Market Revenue (Billion) Forecast, by Application 2019 & 2032
- Table 50: Brazil Slack Wax Market Volume (K Tons) Forecast, by Application 2019 & 2032
- Table 51: Argentina Slack Wax Market Revenue (Billion) Forecast, by Application 2019 & 2032
- Table 52: Argentina Slack Wax Market Volume (K Tons) Forecast, by Application 2019 & 2032
- Table 53: Rest of South America Slack Wax Market Revenue (Billion) Forecast, by Application 2019 & 2032
- Table 54: Rest of South America Slack Wax Market Volume (K Tons) Forecast, by Application 2019 & 2032
- Table 55: Global Slack Wax Market Revenue Billion Forecast, by Country 2019 & 2032
- Table 56: Global Slack Wax Market Volume K Tons Forecast, by Country 2019 & 2032
- Table 57: Middle East Slack Wax Market Revenue (Billion) Forecast, by Application 2019 & 2032
- Table 58: Middle East Slack Wax Market Volume (K Tons) Forecast, by Application 2019 & 2032
- Table 59: Africa Slack Wax Market Revenue (Billion) Forecast, by Application 2019 & 2032
- Table 60: Africa Slack Wax Market Volume (K Tons) Forecast, by Application 2019 & 2032
- Table 61: Global Slack Wax Market Revenue Billion Forecast, by Type 2019 & 2032
- Table 62: Global Slack Wax Market Volume K Tons Forecast, by Type 2019 & 2032
- Table 63: Global Slack Wax Market Revenue Billion Forecast, by Application 2019 & 2032
- Table 64: Global Slack Wax Market Volume K Tons Forecast, by Application 2019 & 2032
- Table 65: Global Slack Wax Market Revenue Billion Forecast, by Country 2019 & 2032
- Table 66: Global Slack Wax Market Volume K Tons Forecast, by Country 2019 & 2032
- Table 67: China Slack Wax Market Revenue (Billion) Forecast, by Application 2019 & 2032
- Table 68: China Slack Wax Market Volume (K Tons) Forecast, by Application 2019 & 2032
- Table 69: India Slack Wax Market Revenue (Billion) Forecast, by Application 2019 & 2032
- Table 70: India Slack Wax Market Volume (K Tons) Forecast, by Application 2019 & 2032
- Table 71: Japan Slack Wax Market Revenue (Billion) Forecast, by Application 2019 & 2032
- Table 72: Japan Slack Wax Market Volume (K Tons) Forecast, by Application 2019 & 2032
- Table 73: South Korea Slack Wax Market Revenue (Billion) Forecast, by Application 2019 & 2032
- Table 74: South Korea Slack Wax Market Volume (K Tons) Forecast, by Application 2019 & 2032
- Table 75: ASEAN Countries Slack Wax Market Revenue (Billion) Forecast, by Application 2019 & 2032
- Table 76: ASEAN Countries Slack Wax Market Volume (K Tons) Forecast, by Application 2019 & 2032
- Table 77: Rest of Asia Pacific Slack Wax Market Revenue (Billion) Forecast, by Application 2019 & 2032
- Table 78: Rest of Asia Pacific Slack Wax Market Volume (K Tons) Forecast, by Application 2019 & 2032
- Table 79: Global Slack Wax Market Revenue Billion Forecast, by Type 2019 & 2032
- Table 80: Global Slack Wax Market Volume K Tons Forecast, by Type 2019 & 2032
- Table 81: Global Slack Wax Market Revenue Billion Forecast, by Application 2019 & 2032
- Table 82: Global Slack Wax Market Volume K Tons Forecast, by Application 2019 & 2032
- Table 83: Global Slack Wax Market Revenue Billion Forecast, by Country 2019 & 2032
- Table 84: Global Slack Wax Market Volume K Tons Forecast, by Country 2019 & 2032
- Table 85: United States Slack Wax Market Revenue (Billion) Forecast, by Application 2019 & 2032
- Table 86: United States Slack Wax Market Volume (K Tons) Forecast, by Application 2019 & 2032
- Table 87: Canada Slack Wax Market Revenue (Billion) Forecast, by Application 2019 & 2032
- Table 88: Canada Slack Wax Market Volume (K Tons) Forecast, by Application 2019 & 2032
- Table 89: Mexico Slack Wax Market Revenue (Billion) Forecast, by Application 2019 & 2032
- Table 90: Mexico Slack Wax Market Volume (K Tons) Forecast, by Application 2019 & 2032
- Table 91: Global Slack Wax Market Revenue Billion Forecast, by Type 2019 & 2032
- Table 92: Global Slack Wax Market Volume K Tons Forecast, by Type 2019 & 2032
- Table 93: Global Slack Wax Market Revenue Billion Forecast, by Application 2019 & 2032
- Table 94: Global Slack Wax Market Volume K Tons Forecast, by Application 2019 & 2032
- Table 95: Global Slack Wax Market Revenue Billion Forecast, by Country 2019 & 2032
- Table 96: Global Slack Wax Market Volume K Tons Forecast, by Country 2019 & 2032
- Table 97: Germany Slack Wax Market Revenue (Billion) Forecast, by Application 2019 & 2032
- Table 98: Germany Slack Wax Market Volume (K Tons) Forecast, by Application 2019 & 2032
- Table 99: United Kingdom Slack Wax Market Revenue (Billion) Forecast, by Application 2019 & 2032
- Table 100: United Kingdom Slack Wax Market Volume (K Tons) Forecast, by Application 2019 & 2032
- Table 101: Italy Slack Wax Market Revenue (Billion) Forecast, by Application 2019 & 2032
- Table 102: Italy Slack Wax Market Volume (K Tons) Forecast, by Application 2019 & 2032
- Table 103: France Slack Wax Market Revenue (Billion) Forecast, by Application 2019 & 2032
- Table 104: France Slack Wax Market Volume (K Tons) Forecast, by Application 2019 & 2032
- Table 105: Rest of Europe Slack Wax Market Revenue (Billion) Forecast, by Application 2019 & 2032
- Table 106: Rest of Europe Slack Wax Market Volume (K Tons) Forecast, by Application 2019 & 2032
- Table 107: Global Slack Wax Market Revenue Billion Forecast, by Type 2019 & 2032
- Table 108: Global Slack Wax Market Volume K Tons Forecast, by Type 2019 & 2032
- Table 109: Global Slack Wax Market Revenue Billion Forecast, by Application 2019 & 2032
- Table 110: Global Slack Wax Market Volume K Tons Forecast, by Application 2019 & 2032
- Table 111: Global Slack Wax Market Revenue Billion Forecast, by Country 2019 & 2032
- Table 112: Global Slack Wax Market Volume K Tons Forecast, by Country 2019 & 2032
- Table 113: Brazil Slack Wax Market Revenue (Billion) Forecast, by Application 2019 & 2032
- Table 114: Brazil Slack Wax Market Volume (K Tons) Forecast, by Application 2019 & 2032
- Table 115: Argentina Slack Wax Market Revenue (Billion) Forecast, by Application 2019 & 2032
- Table 116: Argentina Slack Wax Market Volume (K Tons) Forecast, by Application 2019 & 2032
- Table 117: Rest of South America Slack Wax Market Revenue (Billion) Forecast, by Application 2019 & 2032
- Table 118: Rest of South America Slack Wax Market Volume (K Tons) Forecast, by Application 2019 & 2032
- Table 119: Global Slack Wax Market Revenue Billion Forecast, by Type 2019 & 2032
- Table 120: Global Slack Wax Market Volume K Tons Forecast, by Type 2019 & 2032
- Table 121: Global Slack Wax Market Revenue Billion Forecast, by Application 2019 & 2032
- Table 122: Global Slack Wax Market Volume K Tons Forecast, by Application 2019 & 2032
- Table 123: Global Slack Wax Market Revenue Billion Forecast, by Country 2019 & 2032
- Table 124: Global Slack Wax Market Volume K Tons Forecast, by Country 2019 & 2032
- Table 125: Saudi Arabia Slack Wax Market Revenue (Billion) Forecast, by Application 2019 & 2032
- Table 126: Saudi Arabia Slack Wax Market Volume (K Tons) Forecast, by Application 2019 & 2032
- Table 127: South Africa Slack Wax Market Revenue (Billion) Forecast, by Application 2019 & 2032
- Table 128: South Africa Slack Wax Market Volume (K Tons) Forecast, by Application 2019 & 2032
- Table 129: Rest of Middle East and Africa Slack Wax Market Revenue (Billion) Forecast, by Application 2019 & 2032
- Table 130: Rest of Middle East and Africa Slack Wax Market Volume (K Tons) Forecast, by Application 2019 & 2032
Frequently Asked Questions
1. What is the projected Compound Annual Growth Rate (CAGR) of the Slack Wax Market?
The projected CAGR is approximately 3.1%.
2. Which companies are prominent players in the Slack Wax Market?
Key companies in the market include American Refining Group Inc, Exxon Mobil Corporation, IRPC Public Company Limited, Royal Dutch Shell plc, Persol Corporation, IRANOL, Industrial Raw Materials LLC, Carmel Industries, Panama Petrochem Ltd, THAI OIL, Meade-King Robinson & Co Ltd.
3. What are the main segments of the Slack Wax Market?
The market segments include Type, Application.
4. Can you provide details about the market size?
The market size is estimated to be USD 3.94 Billion as of 2022.
5. What are some drivers contributing to market growth?
; Increasing Usage of Wax Emulsions in Various End-user Industries; Other Drivers.
6. What are the notable trends driving market growth?
Increasing Demand for Emulsions in Personal Care Industry.
7. Are there any restraints impacting market growth?
Fluctuation in Prices of Metal.
8. Can you provide examples of recent developments in the market?
N/A
9. What pricing options are available for accessing the report?
Pricing options include single-user, multi-user, and enterprise licenses priced at USD 4750, USD 5250, and USD 8750 respectively.
10. Is the market size provided in terms of value or volume?
The market size is provided in terms of value, measured in Billion and volume, measured in K Tons.
11. Are there any specific market keywords associated with the report?
Yes, the market keyword associated with the report is "Slack Wax Market," which aids in identifying and referencing the specific market segment covered.
12. How do I determine which pricing option suits my needs best?
The pricing options vary based on user requirements and access needs. Individual users may opt for single-user licenses, while businesses requiring broader access may choose multi-user or enterprise licenses for cost-effective access to the report.
13. Are there any additional resources or data provided in the Slack Wax Market report?
While the report offers comprehensive insights, it's advisable to review the specific contents or supplementary materials provided to ascertain if additional resources or data are available.
14. How can I stay updated on further developments or reports in the Slack Wax Market?
To stay informed about further developments, trends, and reports in the Slack Wax Market, consider subscribing to industry newsletters, following relevant companies and organizations, or regularly checking reputable industry news sources and publications.
Methodology
Step 1 - Identification of Relevant Samples Size from Population Database


Step 2 - Approaches for Defining Global Market Size (Value, Volume* & Price*)

Note*: In applicable scenarios
Step 3 - Data Sources
Primary Research
- Web Analytics
- Survey Reports
- Research Institute
- Latest Research Reports
- Opinion Leaders
Secondary Research
- Annual Reports
- White Paper
- Latest Press Release
- Industry Association
- Paid Database
- Investor Presentations

Step 4 - Data Triangulation
Involves using different sources of information in order to increase the validity of a study
These sources are likely to be stakeholders in a program - participants, other researchers, program staff, other community members, and so on.
Then we put all data in single framework & apply various statistical tools to find out the dynamic on the market.
During the analysis stage, feedback from the stakeholder groups would be compared to determine areas of agreement as well as areas of divergence


