
Key Insights
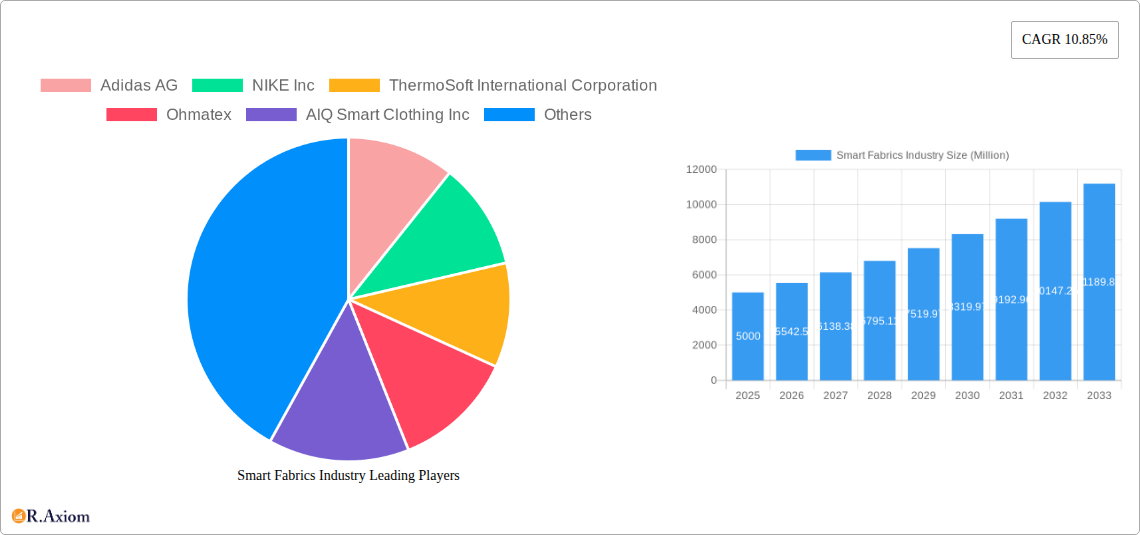
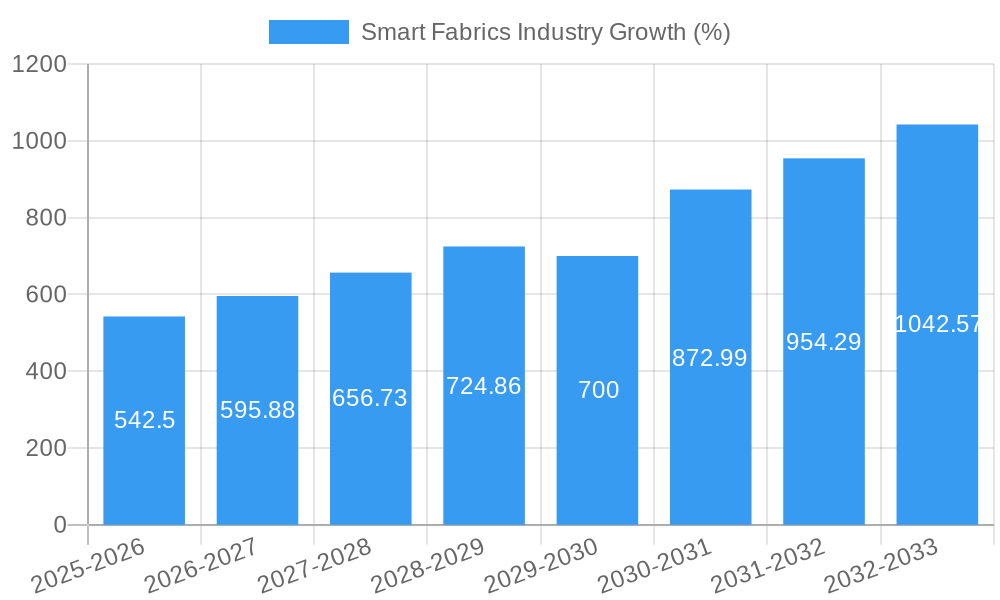
The smart fabrics market is experiencing robust growth, driven by increasing demand across diverse sectors. A Compound Annual Growth Rate (CAGR) of 10.85% from 2019 to 2024 suggests a significant expansion, projecting continued upward trajectory through 2033. Several key factors fuel this expansion. Technological advancements in materials science are enabling the creation of fabrics with integrated sensors, actuators, and power sources, leading to innovative applications in areas like health monitoring (wearable biosensors), athletic performance enhancement (smart clothing that tracks vital signs and provides feedback), and interactive entertainment (clothing that responds to environmental stimuli). The rising adoption of wearable technology and the increasing awareness of health and fitness further propel market growth. Furthermore, the integration of smart fabrics into various industries, including automotive (seat heating and cooling systems), aerospace (protective clothing), and military (smart uniforms), contributes to market expansion.
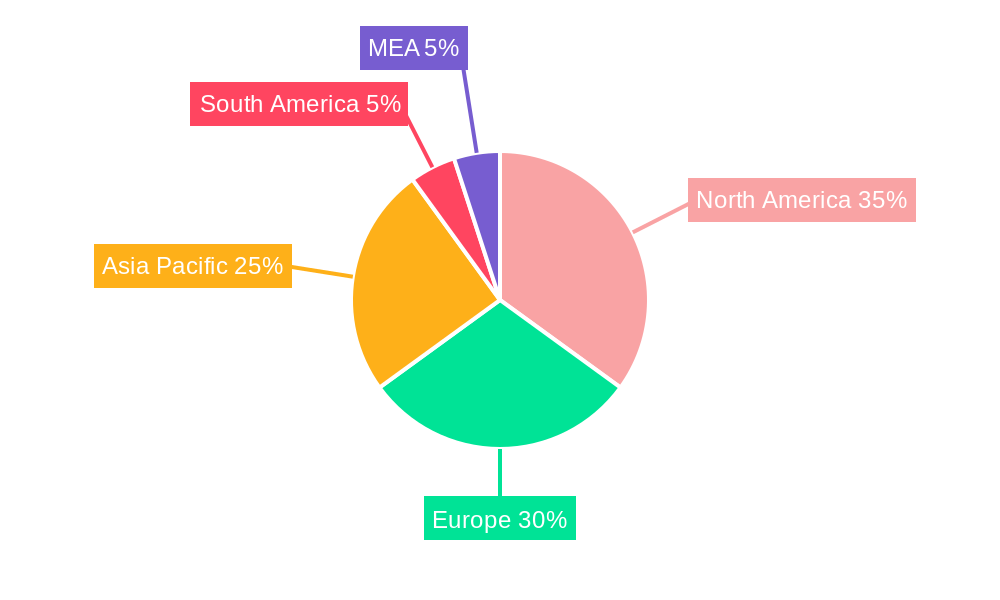
The market segmentation reveals a dynamic landscape. Passive smart fabrics, offering basic functionalities like water resistance and temperature regulation, currently hold a substantial market share, but active fabrics – those with integrated electronics for data processing and communication – are witnessing rapid growth, driven by technological innovation. Ultra-smart fabrics, incorporating advanced features like energy harvesting and self-healing properties, are emerging as a high-growth segment, although still at a nascent stage. In terms of applications, fashion and entertainment, along with sports and fitness, are the leading segments, showing high adoption rates. However, significant potential lies in the medical, industrial, and military sectors, where the demand for advanced functionality is driving innovation and adoption. Geographically, North America and Europe are currently dominant markets, due to established technological infrastructure and higher consumer spending on technologically advanced products. However, the Asia-Pacific region is expected to demonstrate significant growth in the coming years, fuelled by expanding economies and rising disposable incomes. Competitive pressures are intense, with established players like Adidas and Nike alongside innovative startups vying for market share. This competitive environment fosters ongoing innovation and drives down costs, making smart fabrics increasingly accessible to a wider consumer base.
Smart Fabrics Industry: A Comprehensive Market Report (2019-2033)
This detailed report provides a comprehensive analysis of the Smart Fabrics industry, covering market size, segmentation, key players, technological advancements, and future growth prospects. The study period spans from 2019 to 2033, with 2025 as the base and estimated year. The report offers actionable insights for industry stakeholders, investors, and businesses seeking to capitalize on the burgeoning opportunities within this dynamic sector. The market is projected to reach xx Million by 2033, exhibiting a robust CAGR of xx% during the forecast period (2025-2033).
Smart Fabrics Industry Market Concentration & Innovation
The Smart Fabrics market exhibits a moderately concentrated landscape, with key players like Adidas AG, NIKE Inc, and Kolon Industries Inc holding significant market share. However, the entry of innovative startups and the increasing focus on sustainability are fostering a more competitive environment. Market concentration is further analyzed through Herfindahl-Hirschman Index (HHI) calculation, revealing a score of xx, indicating a moderately concentrated market.
- Innovation Drivers: Advancements in materials science, miniaturization of electronics, and the rising demand for wearable technology are key innovation drivers. The development of new functionalities such as energy harvesting, self-cleaning properties, and advanced sensor integration are further fueling innovation.
- Regulatory Frameworks: Government regulations concerning material safety, sustainability, and data privacy significantly influence market dynamics. Compliance costs and evolving standards present both challenges and opportunities for market participants.
- Product Substitutes: Traditional textiles remain a key substitute, but the unique functionalities of smart fabrics are increasingly creating a distinct market segment.
- End-User Trends: The growing preference for personalized and connected experiences, coupled with the increasing adoption of fitness trackers and wearable health monitors, drives demand for smart fabrics in various applications.
- M&A Activities: The industry has witnessed several strategic mergers and acquisitions (M&A) in recent years, with deal values totaling approximately xx Million. These activities reflect the desire of established players to expand their product portfolio and market reach. Examples include [Insert specific examples of M&A if available, with deal values].
Smart Fabrics Industry Industry Trends & Insights
The Smart Fabrics market is experiencing rapid growth, propelled by several key factors. The rising adoption of wearable technology across diverse sectors, increasing consumer awareness of health and fitness, and ongoing advancements in material science contribute significantly to this growth. The market's CAGR during the historical period (2019-2024) was estimated at xx%, indicating considerable market expansion. Increased penetration of smart textiles in niche applications, such as medical and military sectors, further fuels the market growth. Technological disruptions, particularly in the area of flexible electronics and integrated sensors, are constantly reshaping the competitive landscape. Consumer preferences are shifting towards sustainable and eco-friendly smart fabrics, demanding the adoption of recycled and bio-based materials. Competitive dynamics are characterized by both intense competition among established players and the emergence of innovative startups. Market penetration is expected to grow from xx% in 2025 to xx% in 2033, demonstrating the rapidly expanding reach of smart fabrics across various end-use industries.
Dominant Markets & Segments in Smart Fabrics Industry
The Sports and Fitness segment currently dominates the Smart Fabrics market, driven by the increasing popularity of fitness trackers and athletic apparel incorporating smart functionalities. The North American region holds a leading position, fueled by high consumer spending on technological advancements and strong brand presence from major athletic wear companies.
Key Drivers:
- Type:
- Active Smart Fabrics: High demand due to their use in athletic wear and medical devices.
- Passive Smart Fabrics: Large market share due to wider application across various segments.
- Ultra-smart Fabrics: Showcasing significant growth potential fueled by the latest advancements in material science and electronics.
- Application:
- Sports and Fitness: Dominated by athletic wear incorporating sensors and connectivity. High consumer spending in this area coupled with technological advancements in this segment drives substantial market growth.
- Medical: The integration of biosensors and monitoring capabilities in medical textiles creates high growth opportunity.
- Fashion and Entertainment: Expanding integration into apparel and accessories, creating new avenues for innovation and market expansion.
Dominance Analysis: North America's dominance is attributed to higher disposable income, technological advancement, and the presence of major market players. However, the Asia-Pacific region presents strong growth potential, fueled by rising consumer spending and expanding manufacturing capabilities. Detailed analysis of market share, CAGR, and market size for each segment and region are provided in subsequent sections of the full report.
Smart Fabrics Industry Product Developments
Recent product innovations emphasize miniaturized sensors, energy harvesting capabilities, and improved integration with wearable technology. Companies are focusing on developing sustainable and eco-friendly smart fabrics made from recycled and bio-based materials. This addresses growing consumer demand for environmentally conscious products while maintaining the functionality and performance of smart textiles. The market fit for these innovations is strong, particularly in the athletic apparel, medical, and fashion segments. The focus on improved comfort, enhanced durability, and seamless integration with other technologies represents the current technological trends.
Report Scope & Segmentation Analysis
This report segments the Smart Fabrics market by Type (Passive Smart Fabrics, Active Smart Fabrics, Ultra-smart Fabrics) and Application (Fashion and Entertainment, Sports and Fitness, Medical, Transportation and Others, Space and Military, Industrial). Each segment is analyzed in detail, providing historical data (2019-2024), estimated data (2025), and forecast data (2025-2033), including market size and competitive landscape. Growth projections vary significantly across segments, with Active and Ultra-smart Fabrics expected to experience the highest growth rates due to their unique functionalities and increasing demand in niche applications. Competitive dynamics within each segment are shaped by technological innovation, product differentiation, and market access strategies.
Key Drivers of Smart Fabrics Industry Growth
Several factors drive the growth of the Smart Fabrics industry. Technological advancements, particularly in miniaturization of sensors and energy harvesting, enable the creation of more versatile and functional smart fabrics. The increasing demand for wearable technology across diverse applications like healthcare, fitness, and fashion fuels market expansion. Government initiatives promoting innovation and sustainability in textile manufacturing further support growth. Economic factors such as rising disposable incomes in emerging markets contribute to increased consumer spending on smart textiles.
Challenges in the Smart Fabrics Industry Sector
The Smart Fabrics industry faces challenges including high manufacturing costs, the complexity of integrating electronics into textiles, and regulatory hurdles related to material safety and data privacy. Supply chain disruptions and the need for skilled labor also pose significant challenges, impacting production efficiency and cost. Furthermore, intense competition among established players and emerging startups creates pressure on pricing and profitability. These factors collectively impact overall market growth, especially for companies with limited economies of scale.
Emerging Opportunities in Smart Fabrics Industry
Emerging opportunities lie in the development of new applications for smart fabrics, particularly in medical textiles, personalized healthcare monitoring, and advanced protective gear for industrial and military use. The growing focus on sustainability presents an opportunity for manufacturers to leverage recycled and bio-based materials. The integration of artificial intelligence and machine learning technologies to create more intelligent and responsive smart fabrics also offers significant growth potential. These trends point towards a future where smart fabrics are integral to various aspects of daily life.
Leading Players in the Smart Fabrics Industry Market
- Adidas AG
- NIKE Inc
- ThermoSoft International Corporation
- Ohmatex
- AIQ Smart Clothing Inc
- OTEX Specialty Narrow Fabrics Inc
- Sensoria Inc
- Schoeller Textil AG
- Interactive Wear AG
- Kolon Industries Inc
Key Developments in Smart Fabrics Industry Industry
- April 2023: Cambridge University develops a cost-effective method for incorporating LEDs, energy harvesting, storage, and sensors into clothing, potentially revolutionizing smart textile manufacturing.
- March 2023: Schoeller Textil AG launches Re-Source, a sustainable textile collection made from recycled materials, highlighting the growing focus on eco-friendly smart fabrics.
- April 2022: Advanced Functional Fabrics of America (AFFOA) showcases advanced functional fibers with LED chips at the Smart Textiles Summit, demonstrating advancements in high-tech textile systems.
Strategic Outlook for Smart Fabrics Industry Market
The Smart Fabrics market is poised for significant growth, driven by technological innovations, increasing consumer demand for connected and personalized experiences, and expansion into new applications. Continued advancements in materials science, miniaturization of electronics, and the development of sustainable manufacturing processes will shape future market dynamics. Companies strategically focusing on innovation, sustainability, and market diversification are expected to thrive in this rapidly evolving sector. The potential for integrating smart fabrics into various aspects of daily life, from apparel to healthcare to infrastructure, ensures long-term growth prospects.
Smart Fabrics Industry Segmentation
-
1. Type
- 1.1. Passive Smart Fabrics
- 1.2. Active Fabrics
- 1.3. Ultra-smart Fabrics
-
2. Application
- 2.1. Fashion and Entertainment
- 2.2. Sports and Fitness
- 2.3. Medical
- 2.4. Transportation and Others
- 2.5. Space and Military
- 2.6. Industrial
Smart Fabrics Industry Segmentation By Geography
- 1. North America
- 2. Asia Pacific
- 3. Europe
- 4. Rest of the World
Smart Fabrics Industry REPORT HIGHLIGHTS
| Aspects | Details |
|---|---|
| Study Period | 2019-2033 |
| Base Year | 2024 |
| Estimated Year | 2025 |
| Forecast Period | 2025-2033 |
| Historical Period | 2019-2024 |
| Growth Rate | CAGR of 10.85% from 2019-2033 |
| Segmentation |
|
Table of Contents
- 1. Introduction
- 1.1. Research Scope
- 1.2. Market Segmentation
- 1.3. Research Methodology
- 1.4. Definitions and Assumptions
- 2. Executive Summary
- 2.1. Introduction
- 3. Market Dynamics
- 3.1. Introduction
- 3.2. Market Drivers
- 3.2.1. Growth in Wearable Electronics Industry; Miniaturization of Electronics and Developments across Flexible Electronics
- 3.3. Market Restrains
- 3.3.1. High Initial Cost
- 3.4. Market Trends
- 3.4.1. Fashion and Entertainment Industry to Witness Significant Growth
- 4. Market Factor Analysis
- 4.1. Porters Five Forces
- 4.2. Supply/Value Chain
- 4.3. PESTEL analysis
- 4.4. Market Entropy
- 4.5. Patent/Trademark Analysis
- 5. Global Smart Fabrics Industry Analysis, Insights and Forecast, 2019-2031
- 5.1. Market Analysis, Insights and Forecast - by Type
- 5.1.1. Passive Smart Fabrics
- 5.1.2. Active Fabrics
- 5.1.3. Ultra-smart Fabrics
- 5.2. Market Analysis, Insights and Forecast - by Application
- 5.2.1. Fashion and Entertainment
- 5.2.2. Sports and Fitness
- 5.2.3. Medical
- 5.2.4. Transportation and Others
- 5.2.5. Space and Military
- 5.2.6. Industrial
- 5.3. Market Analysis, Insights and Forecast - by Region
- 5.3.1. North America
- 5.3.2. Asia Pacific
- 5.3.3. Europe
- 5.3.4. Rest of the World
- 5.1. Market Analysis, Insights and Forecast - by Type
- 6. North America Smart Fabrics Industry Analysis, Insights and Forecast, 2019-2031
- 6.1. Market Analysis, Insights and Forecast - by Type
- 6.1.1. Passive Smart Fabrics
- 6.1.2. Active Fabrics
- 6.1.3. Ultra-smart Fabrics
- 6.2. Market Analysis, Insights and Forecast - by Application
- 6.2.1. Fashion and Entertainment
- 6.2.2. Sports and Fitness
- 6.2.3. Medical
- 6.2.4. Transportation and Others
- 6.2.5. Space and Military
- 6.2.6. Industrial
- 6.1. Market Analysis, Insights and Forecast - by Type
- 7. Asia Pacific Smart Fabrics Industry Analysis, Insights and Forecast, 2019-2031
- 7.1. Market Analysis, Insights and Forecast - by Type
- 7.1.1. Passive Smart Fabrics
- 7.1.2. Active Fabrics
- 7.1.3. Ultra-smart Fabrics
- 7.2. Market Analysis, Insights and Forecast - by Application
- 7.2.1. Fashion and Entertainment
- 7.2.2. Sports and Fitness
- 7.2.3. Medical
- 7.2.4. Transportation and Others
- 7.2.5. Space and Military
- 7.2.6. Industrial
- 7.1. Market Analysis, Insights and Forecast - by Type
- 8. Europe Smart Fabrics Industry Analysis, Insights and Forecast, 2019-2031
- 8.1. Market Analysis, Insights and Forecast - by Type
- 8.1.1. Passive Smart Fabrics
- 8.1.2. Active Fabrics
- 8.1.3. Ultra-smart Fabrics
- 8.2. Market Analysis, Insights and Forecast - by Application
- 8.2.1. Fashion and Entertainment
- 8.2.2. Sports and Fitness
- 8.2.3. Medical
- 8.2.4. Transportation and Others
- 8.2.5. Space and Military
- 8.2.6. Industrial
- 8.1. Market Analysis, Insights and Forecast - by Type
- 9. Rest of the World Smart Fabrics Industry Analysis, Insights and Forecast, 2019-2031
- 9.1. Market Analysis, Insights and Forecast - by Type
- 9.1.1. Passive Smart Fabrics
- 9.1.2. Active Fabrics
- 9.1.3. Ultra-smart Fabrics
- 9.2. Market Analysis, Insights and Forecast - by Application
- 9.2.1. Fashion and Entertainment
- 9.2.2. Sports and Fitness
- 9.2.3. Medical
- 9.2.4. Transportation and Others
- 9.2.5. Space and Military
- 9.2.6. Industrial
- 9.1. Market Analysis, Insights and Forecast - by Type
- 10. North America Smart Fabrics Industry Analysis, Insights and Forecast, 2019-2031
- 10.1. Market Analysis, Insights and Forecast - By Country/Sub-region
- 10.1.1 United States
- 10.1.2 Canada
- 10.1.3 Mexico
- 11. Europe Smart Fabrics Industry Analysis, Insights and Forecast, 2019-2031
- 11.1. Market Analysis, Insights and Forecast - By Country/Sub-region
- 11.1.1 Germany
- 11.1.2 United Kingdom
- 11.1.3 France
- 11.1.4 Spain
- 11.1.5 Italy
- 11.1.6 Spain
- 11.1.7 Belgium
- 11.1.8 Netherland
- 11.1.9 Nordics
- 11.1.10 Rest of Europe
- 12. Asia Pacific Smart Fabrics Industry Analysis, Insights and Forecast, 2019-2031
- 12.1. Market Analysis, Insights and Forecast - By Country/Sub-region
- 12.1.1 China
- 12.1.2 Japan
- 12.1.3 India
- 12.1.4 South Korea
- 12.1.5 Southeast Asia
- 12.1.6 Australia
- 12.1.7 Indonesia
- 12.1.8 Phillipes
- 12.1.9 Singapore
- 12.1.10 Thailandc
- 12.1.11 Rest of Asia Pacific
- 13. South America Smart Fabrics Industry Analysis, Insights and Forecast, 2019-2031
- 13.1. Market Analysis, Insights and Forecast - By Country/Sub-region
- 13.1.1 Brazil
- 13.1.2 Argentina
- 13.1.3 Peru
- 13.1.4 Chile
- 13.1.5 Colombia
- 13.1.6 Ecuador
- 13.1.7 Venezuela
- 13.1.8 Rest of South America
- 14. North America Smart Fabrics Industry Analysis, Insights and Forecast, 2019-2031
- 14.1. Market Analysis, Insights and Forecast - By Country/Sub-region
- 14.1.1 United States
- 14.1.2 Canada
- 14.1.3 Mexico
- 15. MEA Smart Fabrics Industry Analysis, Insights and Forecast, 2019-2031
- 15.1. Market Analysis, Insights and Forecast - By Country/Sub-region
- 15.1.1 United Arab Emirates
- 15.1.2 Saudi Arabia
- 15.1.3 South Africa
- 15.1.4 Rest of Middle East and Africa
- 16. Competitive Analysis
- 16.1. Global Market Share Analysis 2024
- 16.2. Company Profiles
- 16.2.1 Adidas AG
- 16.2.1.1. Overview
- 16.2.1.2. Products
- 16.2.1.3. SWOT Analysis
- 16.2.1.4. Recent Developments
- 16.2.1.5. Financials (Based on Availability)
- 16.2.2 NIKE Inc
- 16.2.2.1. Overview
- 16.2.2.2. Products
- 16.2.2.3. SWOT Analysis
- 16.2.2.4. Recent Developments
- 16.2.2.5. Financials (Based on Availability)
- 16.2.3 ThermoSoft International Corporation
- 16.2.3.1. Overview
- 16.2.3.2. Products
- 16.2.3.3. SWOT Analysis
- 16.2.3.4. Recent Developments
- 16.2.3.5. Financials (Based on Availability)
- 16.2.4 Ohmatex
- 16.2.4.1. Overview
- 16.2.4.2. Products
- 16.2.4.3. SWOT Analysis
- 16.2.4.4. Recent Developments
- 16.2.4.5. Financials (Based on Availability)
- 16.2.5 AIQ Smart Clothing Inc
- 16.2.5.1. Overview
- 16.2.5.2. Products
- 16.2.5.3. SWOT Analysis
- 16.2.5.4. Recent Developments
- 16.2.5.5. Financials (Based on Availability)
- 16.2.6 OTEX Specialty Narrow Fabrics Inc
- 16.2.6.1. Overview
- 16.2.6.2. Products
- 16.2.6.3. SWOT Analysis
- 16.2.6.4. Recent Developments
- 16.2.6.5. Financials (Based on Availability)
- 16.2.7 Sensoria Inc
- 16.2.7.1. Overview
- 16.2.7.2. Products
- 16.2.7.3. SWOT Analysis
- 16.2.7.4. Recent Developments
- 16.2.7.5. Financials (Based on Availability)
- 16.2.8 Schoeller Textil AG
- 16.2.8.1. Overview
- 16.2.8.2. Products
- 16.2.8.3. SWOT Analysis
- 16.2.8.4. Recent Developments
- 16.2.8.5. Financials (Based on Availability)
- 16.2.9 Interactive Wear AG
- 16.2.9.1. Overview
- 16.2.9.2. Products
- 16.2.9.3. SWOT Analysis
- 16.2.9.4. Recent Developments
- 16.2.9.5. Financials (Based on Availability)
- 16.2.10 Kolon Industries Inc
- 16.2.10.1. Overview
- 16.2.10.2. Products
- 16.2.10.3. SWOT Analysis
- 16.2.10.4. Recent Developments
- 16.2.10.5. Financials (Based on Availability)
- 16.2.1 Adidas AG
List of Figures
- Figure 1: Global Smart Fabrics Industry Revenue Breakdown (Million, %) by Region 2024 & 2032
- Figure 2: Global Smart Fabrics Industry Volume Breakdown (Million, %) by Region 2024 & 2032
- Figure 3: North America Smart Fabrics Industry Revenue (Million), by Country 2024 & 2032
- Figure 4: North America Smart Fabrics Industry Volume (Million), by Country 2024 & 2032
- Figure 5: North America Smart Fabrics Industry Revenue Share (%), by Country 2024 & 2032
- Figure 6: North America Smart Fabrics Industry Volume Share (%), by Country 2024 & 2032
- Figure 7: Europe Smart Fabrics Industry Revenue (Million), by Country 2024 & 2032
- Figure 8: Europe Smart Fabrics Industry Volume (Million), by Country 2024 & 2032
- Figure 9: Europe Smart Fabrics Industry Revenue Share (%), by Country 2024 & 2032
- Figure 10: Europe Smart Fabrics Industry Volume Share (%), by Country 2024 & 2032
- Figure 11: Asia Pacific Smart Fabrics Industry Revenue (Million), by Country 2024 & 2032
- Figure 12: Asia Pacific Smart Fabrics Industry Volume (Million), by Country 2024 & 2032
- Figure 13: Asia Pacific Smart Fabrics Industry Revenue Share (%), by Country 2024 & 2032
- Figure 14: Asia Pacific Smart Fabrics Industry Volume Share (%), by Country 2024 & 2032
- Figure 15: South America Smart Fabrics Industry Revenue (Million), by Country 2024 & 2032
- Figure 16: South America Smart Fabrics Industry Volume (Million), by Country 2024 & 2032
- Figure 17: South America Smart Fabrics Industry Revenue Share (%), by Country 2024 & 2032
- Figure 18: South America Smart Fabrics Industry Volume Share (%), by Country 2024 & 2032
- Figure 19: North America Smart Fabrics Industry Revenue (Million), by Country 2024 & 2032
- Figure 20: North America Smart Fabrics Industry Volume (Million), by Country 2024 & 2032
- Figure 21: North America Smart Fabrics Industry Revenue Share (%), by Country 2024 & 2032
- Figure 22: North America Smart Fabrics Industry Volume Share (%), by Country 2024 & 2032
- Figure 23: MEA Smart Fabrics Industry Revenue (Million), by Country 2024 & 2032
- Figure 24: MEA Smart Fabrics Industry Volume (Million), by Country 2024 & 2032
- Figure 25: MEA Smart Fabrics Industry Revenue Share (%), by Country 2024 & 2032
- Figure 26: MEA Smart Fabrics Industry Volume Share (%), by Country 2024 & 2032
- Figure 27: North America Smart Fabrics Industry Revenue (Million), by Type 2024 & 2032
- Figure 28: North America Smart Fabrics Industry Volume (Million), by Type 2024 & 2032
- Figure 29: North America Smart Fabrics Industry Revenue Share (%), by Type 2024 & 2032
- Figure 30: North America Smart Fabrics Industry Volume Share (%), by Type 2024 & 2032
- Figure 31: North America Smart Fabrics Industry Revenue (Million), by Application 2024 & 2032
- Figure 32: North America Smart Fabrics Industry Volume (Million), by Application 2024 & 2032
- Figure 33: North America Smart Fabrics Industry Revenue Share (%), by Application 2024 & 2032
- Figure 34: North America Smart Fabrics Industry Volume Share (%), by Application 2024 & 2032
- Figure 35: North America Smart Fabrics Industry Revenue (Million), by Country 2024 & 2032
- Figure 36: North America Smart Fabrics Industry Volume (Million), by Country 2024 & 2032
- Figure 37: North America Smart Fabrics Industry Revenue Share (%), by Country 2024 & 2032
- Figure 38: North America Smart Fabrics Industry Volume Share (%), by Country 2024 & 2032
- Figure 39: Asia Pacific Smart Fabrics Industry Revenue (Million), by Type 2024 & 2032
- Figure 40: Asia Pacific Smart Fabrics Industry Volume (Million), by Type 2024 & 2032
- Figure 41: Asia Pacific Smart Fabrics Industry Revenue Share (%), by Type 2024 & 2032
- Figure 42: Asia Pacific Smart Fabrics Industry Volume Share (%), by Type 2024 & 2032
- Figure 43: Asia Pacific Smart Fabrics Industry Revenue (Million), by Application 2024 & 2032
- Figure 44: Asia Pacific Smart Fabrics Industry Volume (Million), by Application 2024 & 2032
- Figure 45: Asia Pacific Smart Fabrics Industry Revenue Share (%), by Application 2024 & 2032
- Figure 46: Asia Pacific Smart Fabrics Industry Volume Share (%), by Application 2024 & 2032
- Figure 47: Asia Pacific Smart Fabrics Industry Revenue (Million), by Country 2024 & 2032
- Figure 48: Asia Pacific Smart Fabrics Industry Volume (Million), by Country 2024 & 2032
- Figure 49: Asia Pacific Smart Fabrics Industry Revenue Share (%), by Country 2024 & 2032
- Figure 50: Asia Pacific Smart Fabrics Industry Volume Share (%), by Country 2024 & 2032
- Figure 51: Europe Smart Fabrics Industry Revenue (Million), by Type 2024 & 2032
- Figure 52: Europe Smart Fabrics Industry Volume (Million), by Type 2024 & 2032
- Figure 53: Europe Smart Fabrics Industry Revenue Share (%), by Type 2024 & 2032
- Figure 54: Europe Smart Fabrics Industry Volume Share (%), by Type 2024 & 2032
- Figure 55: Europe Smart Fabrics Industry Revenue (Million), by Application 2024 & 2032
- Figure 56: Europe Smart Fabrics Industry Volume (Million), by Application 2024 & 2032
- Figure 57: Europe Smart Fabrics Industry Revenue Share (%), by Application 2024 & 2032
- Figure 58: Europe Smart Fabrics Industry Volume Share (%), by Application 2024 & 2032
- Figure 59: Europe Smart Fabrics Industry Revenue (Million), by Country 2024 & 2032
- Figure 60: Europe Smart Fabrics Industry Volume (Million), by Country 2024 & 2032
- Figure 61: Europe Smart Fabrics Industry Revenue Share (%), by Country 2024 & 2032
- Figure 62: Europe Smart Fabrics Industry Volume Share (%), by Country 2024 & 2032
- Figure 63: Rest of the World Smart Fabrics Industry Revenue (Million), by Type 2024 & 2032
- Figure 64: Rest of the World Smart Fabrics Industry Volume (Million), by Type 2024 & 2032
- Figure 65: Rest of the World Smart Fabrics Industry Revenue Share (%), by Type 2024 & 2032
- Figure 66: Rest of the World Smart Fabrics Industry Volume Share (%), by Type 2024 & 2032
- Figure 67: Rest of the World Smart Fabrics Industry Revenue (Million), by Application 2024 & 2032
- Figure 68: Rest of the World Smart Fabrics Industry Volume (Million), by Application 2024 & 2032
- Figure 69: Rest of the World Smart Fabrics Industry Revenue Share (%), by Application 2024 & 2032
- Figure 70: Rest of the World Smart Fabrics Industry Volume Share (%), by Application 2024 & 2032
- Figure 71: Rest of the World Smart Fabrics Industry Revenue (Million), by Country 2024 & 2032
- Figure 72: Rest of the World Smart Fabrics Industry Volume (Million), by Country 2024 & 2032
- Figure 73: Rest of the World Smart Fabrics Industry Revenue Share (%), by Country 2024 & 2032
- Figure 74: Rest of the World Smart Fabrics Industry Volume Share (%), by Country 2024 & 2032
List of Tables
- Table 1: Global Smart Fabrics Industry Revenue Million Forecast, by Region 2019 & 2032
- Table 2: Global Smart Fabrics Industry Volume Million Forecast, by Region 2019 & 2032
- Table 3: Global Smart Fabrics Industry Revenue Million Forecast, by Type 2019 & 2032
- Table 4: Global Smart Fabrics Industry Volume Million Forecast, by Type 2019 & 2032
- Table 5: Global Smart Fabrics Industry Revenue Million Forecast, by Application 2019 & 2032
- Table 6: Global Smart Fabrics Industry Volume Million Forecast, by Application 2019 & 2032
- Table 7: Global Smart Fabrics Industry Revenue Million Forecast, by Region 2019 & 2032
- Table 8: Global Smart Fabrics Industry Volume Million Forecast, by Region 2019 & 2032
- Table 9: Global Smart Fabrics Industry Revenue Million Forecast, by Country 2019 & 2032
- Table 10: Global Smart Fabrics Industry Volume Million Forecast, by Country 2019 & 2032
- Table 11: United States Smart Fabrics Industry Revenue (Million) Forecast, by Application 2019 & 2032
- Table 12: United States Smart Fabrics Industry Volume (Million) Forecast, by Application 2019 & 2032
- Table 13: Canada Smart Fabrics Industry Revenue (Million) Forecast, by Application 2019 & 2032
- Table 14: Canada Smart Fabrics Industry Volume (Million) Forecast, by Application 2019 & 2032
- Table 15: Mexico Smart Fabrics Industry Revenue (Million) Forecast, by Application 2019 & 2032
- Table 16: Mexico Smart Fabrics Industry Volume (Million) Forecast, by Application 2019 & 2032
- Table 17: Global Smart Fabrics Industry Revenue Million Forecast, by Country 2019 & 2032
- Table 18: Global Smart Fabrics Industry Volume Million Forecast, by Country 2019 & 2032
- Table 19: Germany Smart Fabrics Industry Revenue (Million) Forecast, by Application 2019 & 2032
- Table 20: Germany Smart Fabrics Industry Volume (Million) Forecast, by Application 2019 & 2032
- Table 21: United Kingdom Smart Fabrics Industry Revenue (Million) Forecast, by Application 2019 & 2032
- Table 22: United Kingdom Smart Fabrics Industry Volume (Million) Forecast, by Application 2019 & 2032
- Table 23: France Smart Fabrics Industry Revenue (Million) Forecast, by Application 2019 & 2032
- Table 24: France Smart Fabrics Industry Volume (Million) Forecast, by Application 2019 & 2032
- Table 25: Spain Smart Fabrics Industry Revenue (Million) Forecast, by Application 2019 & 2032
- Table 26: Spain Smart Fabrics Industry Volume (Million) Forecast, by Application 2019 & 2032
- Table 27: Italy Smart Fabrics Industry Revenue (Million) Forecast, by Application 2019 & 2032
- Table 28: Italy Smart Fabrics Industry Volume (Million) Forecast, by Application 2019 & 2032
- Table 29: Spain Smart Fabrics Industry Revenue (Million) Forecast, by Application 2019 & 2032
- Table 30: Spain Smart Fabrics Industry Volume (Million) Forecast, by Application 2019 & 2032
- Table 31: Belgium Smart Fabrics Industry Revenue (Million) Forecast, by Application 2019 & 2032
- Table 32: Belgium Smart Fabrics Industry Volume (Million) Forecast, by Application 2019 & 2032
- Table 33: Netherland Smart Fabrics Industry Revenue (Million) Forecast, by Application 2019 & 2032
- Table 34: Netherland Smart Fabrics Industry Volume (Million) Forecast, by Application 2019 & 2032
- Table 35: Nordics Smart Fabrics Industry Revenue (Million) Forecast, by Application 2019 & 2032
- Table 36: Nordics Smart Fabrics Industry Volume (Million) Forecast, by Application 2019 & 2032
- Table 37: Rest of Europe Smart Fabrics Industry Revenue (Million) Forecast, by Application 2019 & 2032
- Table 38: Rest of Europe Smart Fabrics Industry Volume (Million) Forecast, by Application 2019 & 2032
- Table 39: Global Smart Fabrics Industry Revenue Million Forecast, by Country 2019 & 2032
- Table 40: Global Smart Fabrics Industry Volume Million Forecast, by Country 2019 & 2032
- Table 41: China Smart Fabrics Industry Revenue (Million) Forecast, by Application 2019 & 2032
- Table 42: China Smart Fabrics Industry Volume (Million) Forecast, by Application 2019 & 2032
- Table 43: Japan Smart Fabrics Industry Revenue (Million) Forecast, by Application 2019 & 2032
- Table 44: Japan Smart Fabrics Industry Volume (Million) Forecast, by Application 2019 & 2032
- Table 45: India Smart Fabrics Industry Revenue (Million) Forecast, by Application 2019 & 2032
- Table 46: India Smart Fabrics Industry Volume (Million) Forecast, by Application 2019 & 2032
- Table 47: South Korea Smart Fabrics Industry Revenue (Million) Forecast, by Application 2019 & 2032
- Table 48: South Korea Smart Fabrics Industry Volume (Million) Forecast, by Application 2019 & 2032
- Table 49: Southeast Asia Smart Fabrics Industry Revenue (Million) Forecast, by Application 2019 & 2032
- Table 50: Southeast Asia Smart Fabrics Industry Volume (Million) Forecast, by Application 2019 & 2032
- Table 51: Australia Smart Fabrics Industry Revenue (Million) Forecast, by Application 2019 & 2032
- Table 52: Australia Smart Fabrics Industry Volume (Million) Forecast, by Application 2019 & 2032
- Table 53: Indonesia Smart Fabrics Industry Revenue (Million) Forecast, by Application 2019 & 2032
- Table 54: Indonesia Smart Fabrics Industry Volume (Million) Forecast, by Application 2019 & 2032
- Table 55: Phillipes Smart Fabrics Industry Revenue (Million) Forecast, by Application 2019 & 2032
- Table 56: Phillipes Smart Fabrics Industry Volume (Million) Forecast, by Application 2019 & 2032
- Table 57: Singapore Smart Fabrics Industry Revenue (Million) Forecast, by Application 2019 & 2032
- Table 58: Singapore Smart Fabrics Industry Volume (Million) Forecast, by Application 2019 & 2032
- Table 59: Thailandc Smart Fabrics Industry Revenue (Million) Forecast, by Application 2019 & 2032
- Table 60: Thailandc Smart Fabrics Industry Volume (Million) Forecast, by Application 2019 & 2032
- Table 61: Rest of Asia Pacific Smart Fabrics Industry Revenue (Million) Forecast, by Application 2019 & 2032
- Table 62: Rest of Asia Pacific Smart Fabrics Industry Volume (Million) Forecast, by Application 2019 & 2032
- Table 63: Global Smart Fabrics Industry Revenue Million Forecast, by Country 2019 & 2032
- Table 64: Global Smart Fabrics Industry Volume Million Forecast, by Country 2019 & 2032
- Table 65: Brazil Smart Fabrics Industry Revenue (Million) Forecast, by Application 2019 & 2032
- Table 66: Brazil Smart Fabrics Industry Volume (Million) Forecast, by Application 2019 & 2032
- Table 67: Argentina Smart Fabrics Industry Revenue (Million) Forecast, by Application 2019 & 2032
- Table 68: Argentina Smart Fabrics Industry Volume (Million) Forecast, by Application 2019 & 2032
- Table 69: Peru Smart Fabrics Industry Revenue (Million) Forecast, by Application 2019 & 2032
- Table 70: Peru Smart Fabrics Industry Volume (Million) Forecast, by Application 2019 & 2032
- Table 71: Chile Smart Fabrics Industry Revenue (Million) Forecast, by Application 2019 & 2032
- Table 72: Chile Smart Fabrics Industry Volume (Million) Forecast, by Application 2019 & 2032
- Table 73: Colombia Smart Fabrics Industry Revenue (Million) Forecast, by Application 2019 & 2032
- Table 74: Colombia Smart Fabrics Industry Volume (Million) Forecast, by Application 2019 & 2032
- Table 75: Ecuador Smart Fabrics Industry Revenue (Million) Forecast, by Application 2019 & 2032
- Table 76: Ecuador Smart Fabrics Industry Volume (Million) Forecast, by Application 2019 & 2032
- Table 77: Venezuela Smart Fabrics Industry Revenue (Million) Forecast, by Application 2019 & 2032
- Table 78: Venezuela Smart Fabrics Industry Volume (Million) Forecast, by Application 2019 & 2032
- Table 79: Rest of South America Smart Fabrics Industry Revenue (Million) Forecast, by Application 2019 & 2032
- Table 80: Rest of South America Smart Fabrics Industry Volume (Million) Forecast, by Application 2019 & 2032
- Table 81: Global Smart Fabrics Industry Revenue Million Forecast, by Country 2019 & 2032
- Table 82: Global Smart Fabrics Industry Volume Million Forecast, by Country 2019 & 2032
- Table 83: United States Smart Fabrics Industry Revenue (Million) Forecast, by Application 2019 & 2032
- Table 84: United States Smart Fabrics Industry Volume (Million) Forecast, by Application 2019 & 2032
- Table 85: Canada Smart Fabrics Industry Revenue (Million) Forecast, by Application 2019 & 2032
- Table 86: Canada Smart Fabrics Industry Volume (Million) Forecast, by Application 2019 & 2032
- Table 87: Mexico Smart Fabrics Industry Revenue (Million) Forecast, by Application 2019 & 2032
- Table 88: Mexico Smart Fabrics Industry Volume (Million) Forecast, by Application 2019 & 2032
- Table 89: Global Smart Fabrics Industry Revenue Million Forecast, by Country 2019 & 2032
- Table 90: Global Smart Fabrics Industry Volume Million Forecast, by Country 2019 & 2032
- Table 91: United Arab Emirates Smart Fabrics Industry Revenue (Million) Forecast, by Application 2019 & 2032
- Table 92: United Arab Emirates Smart Fabrics Industry Volume (Million) Forecast, by Application 2019 & 2032
- Table 93: Saudi Arabia Smart Fabrics Industry Revenue (Million) Forecast, by Application 2019 & 2032
- Table 94: Saudi Arabia Smart Fabrics Industry Volume (Million) Forecast, by Application 2019 & 2032
- Table 95: South Africa Smart Fabrics Industry Revenue (Million) Forecast, by Application 2019 & 2032
- Table 96: South Africa Smart Fabrics Industry Volume (Million) Forecast, by Application 2019 & 2032
- Table 97: Rest of Middle East and Africa Smart Fabrics Industry Revenue (Million) Forecast, by Application 2019 & 2032
- Table 98: Rest of Middle East and Africa Smart Fabrics Industry Volume (Million) Forecast, by Application 2019 & 2032
- Table 99: Global Smart Fabrics Industry Revenue Million Forecast, by Type 2019 & 2032
- Table 100: Global Smart Fabrics Industry Volume Million Forecast, by Type 2019 & 2032
- Table 101: Global Smart Fabrics Industry Revenue Million Forecast, by Application 2019 & 2032
- Table 102: Global Smart Fabrics Industry Volume Million Forecast, by Application 2019 & 2032
- Table 103: Global Smart Fabrics Industry Revenue Million Forecast, by Country 2019 & 2032
- Table 104: Global Smart Fabrics Industry Volume Million Forecast, by Country 2019 & 2032
- Table 105: Global Smart Fabrics Industry Revenue Million Forecast, by Type 2019 & 2032
- Table 106: Global Smart Fabrics Industry Volume Million Forecast, by Type 2019 & 2032
- Table 107: Global Smart Fabrics Industry Revenue Million Forecast, by Application 2019 & 2032
- Table 108: Global Smart Fabrics Industry Volume Million Forecast, by Application 2019 & 2032
- Table 109: Global Smart Fabrics Industry Revenue Million Forecast, by Country 2019 & 2032
- Table 110: Global Smart Fabrics Industry Volume Million Forecast, by Country 2019 & 2032
- Table 111: Global Smart Fabrics Industry Revenue Million Forecast, by Type 2019 & 2032
- Table 112: Global Smart Fabrics Industry Volume Million Forecast, by Type 2019 & 2032
- Table 113: Global Smart Fabrics Industry Revenue Million Forecast, by Application 2019 & 2032
- Table 114: Global Smart Fabrics Industry Volume Million Forecast, by Application 2019 & 2032
- Table 115: Global Smart Fabrics Industry Revenue Million Forecast, by Country 2019 & 2032
- Table 116: Global Smart Fabrics Industry Volume Million Forecast, by Country 2019 & 2032
- Table 117: Global Smart Fabrics Industry Revenue Million Forecast, by Type 2019 & 2032
- Table 118: Global Smart Fabrics Industry Volume Million Forecast, by Type 2019 & 2032
- Table 119: Global Smart Fabrics Industry Revenue Million Forecast, by Application 2019 & 2032
- Table 120: Global Smart Fabrics Industry Volume Million Forecast, by Application 2019 & 2032
- Table 121: Global Smart Fabrics Industry Revenue Million Forecast, by Country 2019 & 2032
- Table 122: Global Smart Fabrics Industry Volume Million Forecast, by Country 2019 & 2032
Frequently Asked Questions
1. What is the projected Compound Annual Growth Rate (CAGR) of the Smart Fabrics Industry?
The projected CAGR is approximately 10.85%.
2. Which companies are prominent players in the Smart Fabrics Industry?
Key companies in the market include Adidas AG, NIKE Inc, ThermoSoft International Corporation, Ohmatex, AIQ Smart Clothing Inc, OTEX Specialty Narrow Fabrics Inc , Sensoria Inc, Schoeller Textil AG, Interactive Wear AG, Kolon Industries Inc.
3. What are the main segments of the Smart Fabrics Industry?
The market segments include Type, Application.
4. Can you provide details about the market size?
The market size is estimated to be USD XX Million as of 2022.
5. What are some drivers contributing to market growth?
Growth in Wearable Electronics Industry; Miniaturization of Electronics and Developments across Flexible Electronics.
6. What are the notable trends driving market growth?
Fashion and Entertainment Industry to Witness Significant Growth.
7. Are there any restraints impacting market growth?
High Initial Cost.
8. Can you provide examples of recent developments in the market?
April 2023 : A team at Cambridge University has developed a fabric that would incorporate LEDs, energy harvesting, storage capabilities, and sensors into clothing. The researchers have exhibited a method to produce next-generation smart textiles inexpensively and without changing the technology currently used for textile manufacturing.
9. What pricing options are available for accessing the report?
Pricing options include single-user, multi-user, and enterprise licenses priced at USD 4750, USD 5250, and USD 8750 respectively.
10. Is the market size provided in terms of value or volume?
The market size is provided in terms of value, measured in Million and volume, measured in Million.
11. Are there any specific market keywords associated with the report?
Yes, the market keyword associated with the report is "Smart Fabrics Industry," which aids in identifying and referencing the specific market segment covered.
12. How do I determine which pricing option suits my needs best?
The pricing options vary based on user requirements and access needs. Individual users may opt for single-user licenses, while businesses requiring broader access may choose multi-user or enterprise licenses for cost-effective access to the report.
13. Are there any additional resources or data provided in the Smart Fabrics Industry report?
While the report offers comprehensive insights, it's advisable to review the specific contents or supplementary materials provided to ascertain if additional resources or data are available.
14. How can I stay updated on further developments or reports in the Smart Fabrics Industry?
To stay informed about further developments, trends, and reports in the Smart Fabrics Industry, consider subscribing to industry newsletters, following relevant companies and organizations, or regularly checking reputable industry news sources and publications.
Methodology
Step 1 - Identification of Relevant Samples Size from Population Database


Step 2 - Approaches for Defining Global Market Size (Value, Volume* & Price*)

Note*: In applicable scenarios
Step 3 - Data Sources
Primary Research
- Web Analytics
- Survey Reports
- Research Institute
- Latest Research Reports
- Opinion Leaders
Secondary Research
- Annual Reports
- White Paper
- Latest Press Release
- Industry Association
- Paid Database
- Investor Presentations

Step 4 - Data Triangulation
Involves using different sources of information in order to increase the validity of a study
These sources are likely to be stakeholders in a program - participants, other researchers, program staff, other community members, and so on.
Then we put all data in single framework & apply various statistical tools to find out the dynamic on the market.
During the analysis stage, feedback from the stakeholder groups would be compared to determine areas of agreement as well as areas of divergence


