
Key Insights
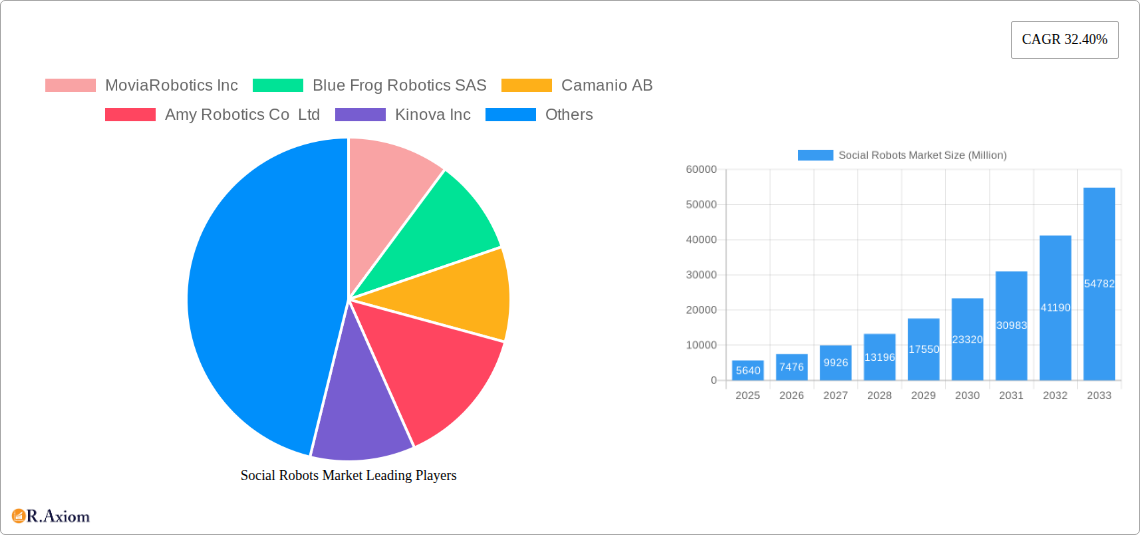
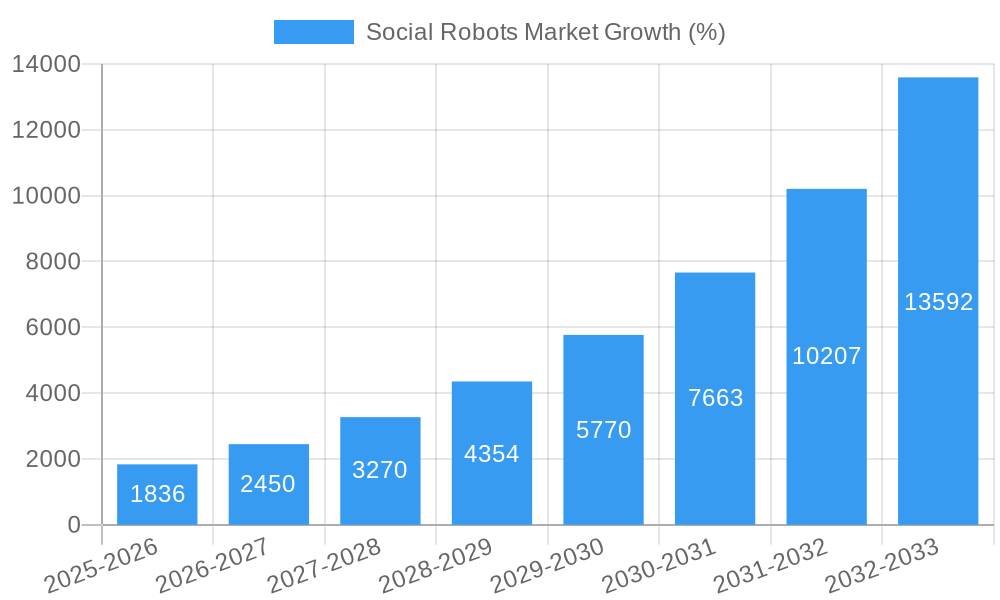
The global social robots market is experiencing robust growth, projected to reach \$5.64 billion in 2025 and exhibiting a remarkable Compound Annual Growth Rate (CAGR) of 32.40% from 2025 to 2033. This expansion is driven by several key factors. Firstly, the increasing demand for companionship and care, particularly amongst aging populations and individuals with disabilities, is fueling adoption. Secondly, advancements in artificial intelligence (AI), machine learning (ML), and natural language processing (NLP) are enabling more sophisticated and interactive social robots capable of engaging in meaningful conversations and providing personalized support. Thirdly, the falling cost of robotics components and increased accessibility are broadening market penetration across diverse sectors like healthcare, education, and entertainment. The integration of social robots in educational settings, offering personalized learning experiences and interactive tutoring, represents a significant growth opportunity. Similarly, the burgeoning use of social robots in healthcare for patient monitoring, rehabilitation, and emotional support contributes substantially to market expansion.
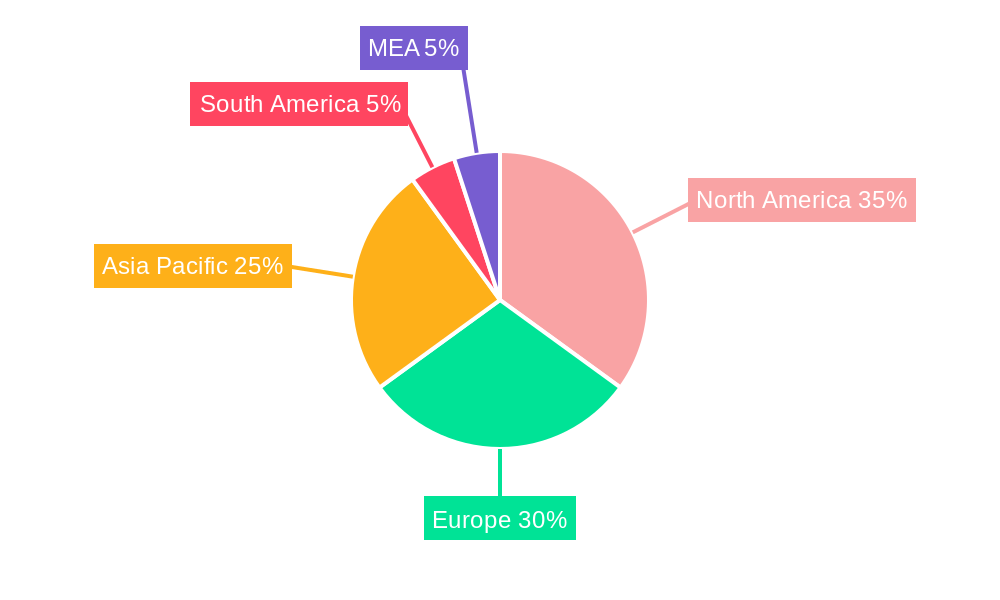
Despite the strong growth trajectory, the market faces certain challenges. High initial investment costs, concerns regarding data privacy and security, and the potential displacement of human interaction remain potential restraints. However, ongoing technological advancements and decreasing production costs are expected to mitigate these concerns over time. The market is segmented by end-user vertical, with healthcare, education, and entertainment currently representing the largest segments. North America and Europe are anticipated to maintain significant market shares due to high technological adoption rates and established healthcare infrastructure. However, Asia-Pacific is expected to exhibit faster growth driven by increasing disposable incomes and burgeoning technological innovation. Key players like Movia Robotics, Blue Frog Robotics, and DJI are actively shaping the market landscape through continuous innovation and strategic partnerships. The long-term outlook for the social robots market remains highly positive, with continued growth driven by technological advancements, increasing demand for personalized care, and broader sector adoption.
Social Robots Market: A Comprehensive Report (2019-2033)
This in-depth report provides a comprehensive analysis of the Social Robots Market, offering invaluable insights for industry stakeholders, investors, and strategic decision-makers. Covering the period from 2019 to 2033, with a focus on 2025, this report examines market trends, competitive dynamics, and future growth potential. The report incorporates extensive data and analysis, providing a clear understanding of the current market landscape and future projections. The global social robots market is projected to reach xx Million by 2033, exhibiting a CAGR of xx% during the forecast period (2025-2033).
Social Robots Market Market Concentration & Innovation
The Social Robots Market is characterized by a moderately fragmented competitive landscape, with several key players vying for market share. While some companies dominate specific segments, the market exhibits considerable potential for new entrants with innovative technologies and business models. Market concentration is assessed through metrics such as the Herfindahl-Hirschman Index (HHI), revealing a xx level of concentration in 2024. This signifies a moderately competitive market with opportunities for both established and emerging players.
Innovation is a key driver in this dynamic market, with ongoing advancements in artificial intelligence (AI), machine learning (ML), natural language processing (NLP), and robotics fueling the development of more sophisticated and capable social robots.
- Key Innovation Drivers: Advancements in AI, improved sensor technology, enhanced human-robot interaction capabilities, and decreasing manufacturing costs.
- Regulatory Frameworks: Government regulations and safety standards play a crucial role, impacting product development and market adoption. These regulations vary significantly across different geographies, creating both opportunities and challenges.
- Product Substitutes: Existing communication technologies (e.g., video conferencing, smart speakers) pose a level of competition. However, the unique capabilities of social robots in providing personalized interaction and physical presence create distinct value propositions.
- End-User Trends: The increasing demand for personalized care, educational tools, and improved customer experiences in various sectors is boosting market growth. Rising adoption of AI and robotics in diverse applications fuels the market expansion.
- M&A Activities: The social robots market has witnessed several mergers and acquisitions in recent years, with deal values ranging from xx Million to xx Million. These activities indicate a strategic consolidation trend, with larger players acquiring smaller companies to expand their product portfolios and market reach. Examples include [specific M&A examples if available, otherwise state "Examples are not publicly available"].
Social Robots Market Industry Trends & Insights
The social robots market is experiencing robust growth, propelled by several key factors. The rising adoption of social robots across various sectors, driven by technological advancements and increasing consumer demand, is a major growth driver. The market exhibits substantial potential for expansion, with considerable untapped opportunities in developing economies.
Technological disruptions, particularly in AI and robotics, are reshaping the competitive landscape. The increasing sophistication of social robots, coupled with reduced manufacturing costs, is enhancing market accessibility. The market penetration of social robots across different end-user verticals is steadily increasing.
- Market Growth Drivers: Technological advancements, rising consumer demand for personalized interaction, increasing geriatric population, and growing adoption of robots in various sectors.
- Technological Disruptions: Advancements in AI, ML, and NLP are enhancing the capabilities of social robots, making them more responsive and engaging.
- Consumer Preferences: Consumers are increasingly seeking personalized and engaging experiences, which aligns well with the capabilities of social robots.
- Competitive Dynamics: The market is witnessing intense competition among established players and emerging companies, resulting in continuous innovation and improved product offerings.
Dominant Markets & Segments in Social Robots Market
The Healthcare sector currently dominates the social robots market, followed by the Education and Entertainment sectors. Growth in these segments is being driven by specific factors:
- Healthcare:
- Key Drivers: Aging population, increasing demand for elder care, the need for remote patient monitoring, and the potential to reduce healthcare costs. Government initiatives to support the adoption of assistive technologies further stimulate growth.
- Education:
- Key Drivers: The growing need for personalized learning experiences, the potential to enhance student engagement, and the ability of robots to cater to diverse learning styles. Educational institutions' increasing adoption of technology is boosting the segment's growth.
- Entertainment:
- Key Drivers: The rising popularity of interactive entertainment experiences, the potential for innovative entertainment applications, and the ability of social robots to provide engaging and personalized experiences. Technological advancements and improved user experience are crucial factors in driving growth.
- Retail:
- Key Drivers: The increasing desire for personalized shopping experiences and improved customer service. The use of robots for customer interactions, product demonstrations, and inventory management is driving retail sector growth.
- Others:
- Key Drivers: Expanding applications in fields like hospitality, customer service, and companionship are gradually contributing to growth, although currently, this segment constitutes a smaller share of the overall market.
Social Robots Market Product Developments
Recent product innovations have focused on enhancing human-robot interaction, incorporating more advanced AI capabilities, and improving the overall user experience. The market is seeing the development of robots with more natural language processing skills, improved emotional intelligence, and personalized functionalities tailored to specific end-user needs. These advancements are contributing to increased market adoption and expansion into new applications.
Report Scope & Segmentation Analysis
This report segments the Social Robots Market primarily by end-user vertical:
- Healthcare: This segment is projected to witness significant growth driven by the aging population and the increasing demand for elderly care and remote patient monitoring. The segment is highly competitive, with various companies offering diverse solutions.
- Education: This segment is expected to experience steady growth due to the increasing adoption of technology in educational institutions and the demand for personalized learning experiences. Competition is moderate, with several companies offering educational robots.
- Entertainment: This segment offers substantial growth potential fueled by the increasing demand for interactive entertainment. Competition is moderate, and new entrants are actively developing innovative entertainment-focused robots.
- Retail: This segment is growing steadily as retailers seek to enhance customer engagement and operational efficiency. The competitive landscape is moderate.
- Others: This segment encompasses diverse applications, including hospitality, customer service, and companionship, representing a promising but still relatively smaller segment of the overall market.
Key Drivers of Social Robots Market Growth
The Social Robots Market is driven by a confluence of factors:
- Technological advancements: Improvements in AI, robotics, and sensor technology are continuously enhancing robot capabilities and reducing costs.
- Economic factors: The rising disposable incomes in developing economies are increasing consumer spending on technologically advanced products, boosting demand.
- Regulatory support: Government initiatives promoting technology adoption and investments in AI are fostering market expansion.
Challenges in the Social Robots Market Sector
Several factors hinder the growth of the Social Robots Market:
- High initial investment costs: The cost of developing and deploying social robots can be high, restricting market penetration, particularly for smaller companies.
- Data privacy and security concerns: The use of social robots involves collecting and processing personal data, raising concerns about privacy and security. This requires robust data protection measures.
- Ethical considerations: Concerns regarding robot autonomy, bias in algorithms, and job displacement need careful consideration. Ethical frameworks are essential for responsible development and implementation.
Emerging Opportunities in Social Robots Market
Several opportunities exist for growth:
- Expansion into new markets: Developing economies represent substantial untapped potential for social robot adoption.
- Development of niche applications: Creating robots tailored to specific industry needs offers significant growth prospects.
- Integration with other technologies: Combining social robots with IoT and other technologies opens new possibilities for enhanced functionality and integration.
Leading Players in the Social Robots Market Market
- MoviaRobotics Inc
- Blue Frog Robotics SAS
- Camanio AB
- Amy Robotics Co Ltd
- Kinova Inc
- AoBo Information Technology Co Ltd
- Haapie SAS
- Matia Robotics (US) Inc
- Motorika USA Inc
- Bionik Laboratories Corp
- SZ DJI Technology Co Ltd
- OhmniLabs Inc
- Wonder Workshop Inc
- Intuition Robotics Ltd
- Double Robotics Inc
- Embodied Inc AB
- Hanson Robotics Ltd
- BotsAndUs Ltd
- AlterG Inc
- Inrobics Social Robotics SLL
- KOMPAI Robotics
- Blue Ocean Robotics ApS
- Furhat Robotics AB
Key Developments in Social Robots Market Industry
- March 2022: Intuition Robotics Ltd launched ElliQ, a digital care companion designed to combat loneliness and social isolation among older adults. This launch signifies a significant step forward in the application of social robots in healthcare.
- March 2022: Scientists at the University of Tsukuba developed a text message mediation robot (OMOY) to help manage anger responses to negative news. This development showcases the potential of social robots in mental health support and managing emotional responses in digital communication.
Strategic Outlook for Social Robots Market Market
The Social Robots Market is poised for significant growth, driven by technological advancements, increasing demand across diverse sectors, and supportive regulatory environments. Future growth will depend on continuous innovation, addressing ethical considerations, and expanding into new markets. Focusing on niche applications and integrating social robots with other technologies will further unlock market potential and drive future expansion.
Social Robots Market Segmentation
-
1. End-user Vertical
- 1.1. Healthcare
- 1.2. Education
- 1.3. Entertainment
- 1.4. Retail
- 1.5. Others End-user Verticals
Social Robots Market Segmentation By Geography
- 1. North America
- 2. Europe
- 3. Asia Pacific
- 4. Rest of the World
Social Robots Market REPORT HIGHLIGHTS
| Aspects | Details |
|---|---|
| Study Period | 2019-2033 |
| Base Year | 2024 |
| Estimated Year | 2025 |
| Forecast Period | 2025-2033 |
| Historical Period | 2019-2024 |
| Growth Rate | CAGR of 32.40% from 2019-2033 |
| Segmentation |
|
Table of Contents
- 1. Introduction
- 1.1. Research Scope
- 1.2. Market Segmentation
- 1.3. Research Methodology
- 1.4. Definitions and Assumptions
- 2. Executive Summary
- 2.1. Introduction
- 3. Market Dynamics
- 3.1. Introduction
- 3.2. Market Drivers
- 3.2.1. Availability of Innovation Budgets and Subsidies to Drive the Adoption; High Average Wages Encouraging Business Leaders to Opt for Automation
- 3.3. Market Restrains
- 3.3.1. Budget Constraints Related to Software Implementation
- 3.4. Market Trends
- 3.4.1. Healthcare Sector to Hold Significant Market Share
- 4. Market Factor Analysis
- 4.1. Porters Five Forces
- 4.2. Supply/Value Chain
- 4.3. PESTEL analysis
- 4.4. Market Entropy
- 4.5. Patent/Trademark Analysis
- 5. Global Social Robots Market Analysis, Insights and Forecast, 2019-2031
- 5.1. Market Analysis, Insights and Forecast - by End-user Vertical
- 5.1.1. Healthcare
- 5.1.2. Education
- 5.1.3. Entertainment
- 5.1.4. Retail
- 5.1.5. Others End-user Verticals
- 5.2. Market Analysis, Insights and Forecast - by Region
- 5.2.1. North America
- 5.2.2. Europe
- 5.2.3. Asia Pacific
- 5.2.4. Rest of the World
- 5.1. Market Analysis, Insights and Forecast - by End-user Vertical
- 6. North America Social Robots Market Analysis, Insights and Forecast, 2019-2031
- 6.1. Market Analysis, Insights and Forecast - by End-user Vertical
- 6.1.1. Healthcare
- 6.1.2. Education
- 6.1.3. Entertainment
- 6.1.4. Retail
- 6.1.5. Others End-user Verticals
- 6.1. Market Analysis, Insights and Forecast - by End-user Vertical
- 7. Europe Social Robots Market Analysis, Insights and Forecast, 2019-2031
- 7.1. Market Analysis, Insights and Forecast - by End-user Vertical
- 7.1.1. Healthcare
- 7.1.2. Education
- 7.1.3. Entertainment
- 7.1.4. Retail
- 7.1.5. Others End-user Verticals
- 7.1. Market Analysis, Insights and Forecast - by End-user Vertical
- 8. Asia Pacific Social Robots Market Analysis, Insights and Forecast, 2019-2031
- 8.1. Market Analysis, Insights and Forecast - by End-user Vertical
- 8.1.1. Healthcare
- 8.1.2. Education
- 8.1.3. Entertainment
- 8.1.4. Retail
- 8.1.5. Others End-user Verticals
- 8.1. Market Analysis, Insights and Forecast - by End-user Vertical
- 9. Rest of the World Social Robots Market Analysis, Insights and Forecast, 2019-2031
- 9.1. Market Analysis, Insights and Forecast - by End-user Vertical
- 9.1.1. Healthcare
- 9.1.2. Education
- 9.1.3. Entertainment
- 9.1.4. Retail
- 9.1.5. Others End-user Verticals
- 9.1. Market Analysis, Insights and Forecast - by End-user Vertical
- 10. North America Social Robots Market Analysis, Insights and Forecast, 2019-2031
- 10.1. Market Analysis, Insights and Forecast - By Country/Sub-region
- 10.1.1 United States
- 10.1.2 Canada
- 10.1.3 Mexico
- 11. Europe Social Robots Market Analysis, Insights and Forecast, 2019-2031
- 11.1. Market Analysis, Insights and Forecast - By Country/Sub-region
- 11.1.1 Germany
- 11.1.2 United Kingdom
- 11.1.3 France
- 11.1.4 Spain
- 11.1.5 Italy
- 11.1.6 Spain
- 11.1.7 Belgium
- 11.1.8 Netherland
- 11.1.9 Nordics
- 11.1.10 Rest of Europe
- 12. Asia Pacific Social Robots Market Analysis, Insights and Forecast, 2019-2031
- 12.1. Market Analysis, Insights and Forecast - By Country/Sub-region
- 12.1.1 China
- 12.1.2 Japan
- 12.1.3 India
- 12.1.4 South Korea
- 12.1.5 Southeast Asia
- 12.1.6 Australia
- 12.1.7 Indonesia
- 12.1.8 Phillipes
- 12.1.9 Singapore
- 12.1.10 Thailandc
- 12.1.11 Rest of Asia Pacific
- 13. South America Social Robots Market Analysis, Insights and Forecast, 2019-2031
- 13.1. Market Analysis, Insights and Forecast - By Country/Sub-region
- 13.1.1 Brazil
- 13.1.2 Argentina
- 13.1.3 Peru
- 13.1.4 Chile
- 13.1.5 Colombia
- 13.1.6 Ecuador
- 13.1.7 Venezuela
- 13.1.8 Rest of South America
- 14. North America Social Robots Market Analysis, Insights and Forecast, 2019-2031
- 14.1. Market Analysis, Insights and Forecast - By Country/Sub-region
- 14.1.1 United States
- 14.1.2 Canada
- 14.1.3 Mexico
- 15. MEA Social Robots Market Analysis, Insights and Forecast, 2019-2031
- 15.1. Market Analysis, Insights and Forecast - By Country/Sub-region
- 15.1.1 United Arab Emirates
- 15.1.2 Saudi Arabia
- 15.1.3 South Africa
- 15.1.4 Rest of Middle East and Africa
- 16. Competitive Analysis
- 16.1. Global Market Share Analysis 2024
- 16.2. Company Profiles
- 16.2.1 MoviaRobotics Inc
- 16.2.1.1. Overview
- 16.2.1.2. Products
- 16.2.1.3. SWOT Analysis
- 16.2.1.4. Recent Developments
- 16.2.1.5. Financials (Based on Availability)
- 16.2.2 Blue Frog Robotics SAS
- 16.2.2.1. Overview
- 16.2.2.2. Products
- 16.2.2.3. SWOT Analysis
- 16.2.2.4. Recent Developments
- 16.2.2.5. Financials (Based on Availability)
- 16.2.3 Camanio AB
- 16.2.3.1. Overview
- 16.2.3.2. Products
- 16.2.3.3. SWOT Analysis
- 16.2.3.4. Recent Developments
- 16.2.3.5. Financials (Based on Availability)
- 16.2.4 Amy Robotics Co Ltd
- 16.2.4.1. Overview
- 16.2.4.2. Products
- 16.2.4.3. SWOT Analysis
- 16.2.4.4. Recent Developments
- 16.2.4.5. Financials (Based on Availability)
- 16.2.5 Kinova Inc
- 16.2.5.1. Overview
- 16.2.5.2. Products
- 16.2.5.3. SWOT Analysis
- 16.2.5.4. Recent Developments
- 16.2.5.5. Financials (Based on Availability)
- 16.2.6 AoBo Information Technology Co Ltd
- 16.2.6.1. Overview
- 16.2.6.2. Products
- 16.2.6.3. SWOT Analysis
- 16.2.6.4. Recent Developments
- 16.2.6.5. Financials (Based on Availability)
- 16.2.7 Haapie SAS
- 16.2.7.1. Overview
- 16.2.7.2. Products
- 16.2.7.3. SWOT Analysis
- 16.2.7.4. Recent Developments
- 16.2.7.5. Financials (Based on Availability)
- 16.2.8 Matia Robotics (US) Inc
- 16.2.8.1. Overview
- 16.2.8.2. Products
- 16.2.8.3. SWOT Analysis
- 16.2.8.4. Recent Developments
- 16.2.8.5. Financials (Based on Availability)
- 16.2.9 Motorika USA Inc
- 16.2.9.1. Overview
- 16.2.9.2. Products
- 16.2.9.3. SWOT Analysis
- 16.2.9.4. Recent Developments
- 16.2.9.5. Financials (Based on Availability)
- 16.2.10 Bionik Laboratories Corp
- 16.2.10.1. Overview
- 16.2.10.2. Products
- 16.2.10.3. SWOT Analysis
- 16.2.10.4. Recent Developments
- 16.2.10.5. Financials (Based on Availability)
- 16.2.11 SZ DJI Technology Co Ltd
- 16.2.11.1. Overview
- 16.2.11.2. Products
- 16.2.11.3. SWOT Analysis
- 16.2.11.4. Recent Developments
- 16.2.11.5. Financials (Based on Availability)
- 16.2.12 OhmniLabs Inc
- 16.2.12.1. Overview
- 16.2.12.2. Products
- 16.2.12.3. SWOT Analysis
- 16.2.12.4. Recent Developments
- 16.2.12.5. Financials (Based on Availability)
- 16.2.13 Wonder Workshop Inc
- 16.2.13.1. Overview
- 16.2.13.2. Products
- 16.2.13.3. SWOT Analysis
- 16.2.13.4. Recent Developments
- 16.2.13.5. Financials (Based on Availability)
- 16.2.14 Intuition Robotics Ltd
- 16.2.14.1. Overview
- 16.2.14.2. Products
- 16.2.14.3. SWOT Analysis
- 16.2.14.4. Recent Developments
- 16.2.14.5. Financials (Based on Availability)
- 16.2.15 Double Robotics Inc
- 16.2.15.1. Overview
- 16.2.15.2. Products
- 16.2.15.3. SWOT Analysis
- 16.2.15.4. Recent Developments
- 16.2.15.5. Financials (Based on Availability)
- 16.2.16 Embodied Inc AB
- 16.2.16.1. Overview
- 16.2.16.2. Products
- 16.2.16.3. SWOT Analysis
- 16.2.16.4. Recent Developments
- 16.2.16.5. Financials (Based on Availability)
- 16.2.17 Hanson Robotics Ltd
- 16.2.17.1. Overview
- 16.2.17.2. Products
- 16.2.17.3. SWOT Analysis
- 16.2.17.4. Recent Developments
- 16.2.17.5. Financials (Based on Availability)
- 16.2.18 BotsAndUs Ltd
- 16.2.18.1. Overview
- 16.2.18.2. Products
- 16.2.18.3. SWOT Analysis
- 16.2.18.4. Recent Developments
- 16.2.18.5. Financials (Based on Availability)
- 16.2.19 AlterG Inc
- 16.2.19.1. Overview
- 16.2.19.2. Products
- 16.2.19.3. SWOT Analysis
- 16.2.19.4. Recent Developments
- 16.2.19.5. Financials (Based on Availability)
- 16.2.20 Inrobics Social Robotics SLL
- 16.2.20.1. Overview
- 16.2.20.2. Products
- 16.2.20.3. SWOT Analysis
- 16.2.20.4. Recent Developments
- 16.2.20.5. Financials (Based on Availability)
- 16.2.21 KOMPAI Robotics
- 16.2.21.1. Overview
- 16.2.21.2. Products
- 16.2.21.3. SWOT Analysis
- 16.2.21.4. Recent Developments
- 16.2.21.5. Financials (Based on Availability)
- 16.2.22 Blue Ocean Robotics ApS
- 16.2.22.1. Overview
- 16.2.22.2. Products
- 16.2.22.3. SWOT Analysis
- 16.2.22.4. Recent Developments
- 16.2.22.5. Financials (Based on Availability)
- 16.2.23 Furhat Robotics AB
- 16.2.23.1. Overview
- 16.2.23.2. Products
- 16.2.23.3. SWOT Analysis
- 16.2.23.4. Recent Developments
- 16.2.23.5. Financials (Based on Availability)
- 16.2.1 MoviaRobotics Inc
List of Figures
- Figure 1: Global Social Robots Market Revenue Breakdown (Million, %) by Region 2024 & 2032
- Figure 2: Global Social Robots Market Volume Breakdown (K Unit, %) by Region 2024 & 2032
- Figure 3: North America Social Robots Market Revenue (Million), by Country 2024 & 2032
- Figure 4: North America Social Robots Market Volume (K Unit), by Country 2024 & 2032
- Figure 5: North America Social Robots Market Revenue Share (%), by Country 2024 & 2032
- Figure 6: North America Social Robots Market Volume Share (%), by Country 2024 & 2032
- Figure 7: Europe Social Robots Market Revenue (Million), by Country 2024 & 2032
- Figure 8: Europe Social Robots Market Volume (K Unit), by Country 2024 & 2032
- Figure 9: Europe Social Robots Market Revenue Share (%), by Country 2024 & 2032
- Figure 10: Europe Social Robots Market Volume Share (%), by Country 2024 & 2032
- Figure 11: Asia Pacific Social Robots Market Revenue (Million), by Country 2024 & 2032
- Figure 12: Asia Pacific Social Robots Market Volume (K Unit), by Country 2024 & 2032
- Figure 13: Asia Pacific Social Robots Market Revenue Share (%), by Country 2024 & 2032
- Figure 14: Asia Pacific Social Robots Market Volume Share (%), by Country 2024 & 2032
- Figure 15: South America Social Robots Market Revenue (Million), by Country 2024 & 2032
- Figure 16: South America Social Robots Market Volume (K Unit), by Country 2024 & 2032
- Figure 17: South America Social Robots Market Revenue Share (%), by Country 2024 & 2032
- Figure 18: South America Social Robots Market Volume Share (%), by Country 2024 & 2032
- Figure 19: North America Social Robots Market Revenue (Million), by Country 2024 & 2032
- Figure 20: North America Social Robots Market Volume (K Unit), by Country 2024 & 2032
- Figure 21: North America Social Robots Market Revenue Share (%), by Country 2024 & 2032
- Figure 22: North America Social Robots Market Volume Share (%), by Country 2024 & 2032
- Figure 23: MEA Social Robots Market Revenue (Million), by Country 2024 & 2032
- Figure 24: MEA Social Robots Market Volume (K Unit), by Country 2024 & 2032
- Figure 25: MEA Social Robots Market Revenue Share (%), by Country 2024 & 2032
- Figure 26: MEA Social Robots Market Volume Share (%), by Country 2024 & 2032
- Figure 27: North America Social Robots Market Revenue (Million), by End-user Vertical 2024 & 2032
- Figure 28: North America Social Robots Market Volume (K Unit), by End-user Vertical 2024 & 2032
- Figure 29: North America Social Robots Market Revenue Share (%), by End-user Vertical 2024 & 2032
- Figure 30: North America Social Robots Market Volume Share (%), by End-user Vertical 2024 & 2032
- Figure 31: North America Social Robots Market Revenue (Million), by Country 2024 & 2032
- Figure 32: North America Social Robots Market Volume (K Unit), by Country 2024 & 2032
- Figure 33: North America Social Robots Market Revenue Share (%), by Country 2024 & 2032
- Figure 34: North America Social Robots Market Volume Share (%), by Country 2024 & 2032
- Figure 35: Europe Social Robots Market Revenue (Million), by End-user Vertical 2024 & 2032
- Figure 36: Europe Social Robots Market Volume (K Unit), by End-user Vertical 2024 & 2032
- Figure 37: Europe Social Robots Market Revenue Share (%), by End-user Vertical 2024 & 2032
- Figure 38: Europe Social Robots Market Volume Share (%), by End-user Vertical 2024 & 2032
- Figure 39: Europe Social Robots Market Revenue (Million), by Country 2024 & 2032
- Figure 40: Europe Social Robots Market Volume (K Unit), by Country 2024 & 2032
- Figure 41: Europe Social Robots Market Revenue Share (%), by Country 2024 & 2032
- Figure 42: Europe Social Robots Market Volume Share (%), by Country 2024 & 2032
- Figure 43: Asia Pacific Social Robots Market Revenue (Million), by End-user Vertical 2024 & 2032
- Figure 44: Asia Pacific Social Robots Market Volume (K Unit), by End-user Vertical 2024 & 2032
- Figure 45: Asia Pacific Social Robots Market Revenue Share (%), by End-user Vertical 2024 & 2032
- Figure 46: Asia Pacific Social Robots Market Volume Share (%), by End-user Vertical 2024 & 2032
- Figure 47: Asia Pacific Social Robots Market Revenue (Million), by Country 2024 & 2032
- Figure 48: Asia Pacific Social Robots Market Volume (K Unit), by Country 2024 & 2032
- Figure 49: Asia Pacific Social Robots Market Revenue Share (%), by Country 2024 & 2032
- Figure 50: Asia Pacific Social Robots Market Volume Share (%), by Country 2024 & 2032
- Figure 51: Rest of the World Social Robots Market Revenue (Million), by End-user Vertical 2024 & 2032
- Figure 52: Rest of the World Social Robots Market Volume (K Unit), by End-user Vertical 2024 & 2032
- Figure 53: Rest of the World Social Robots Market Revenue Share (%), by End-user Vertical 2024 & 2032
- Figure 54: Rest of the World Social Robots Market Volume Share (%), by End-user Vertical 2024 & 2032
- Figure 55: Rest of the World Social Robots Market Revenue (Million), by Country 2024 & 2032
- Figure 56: Rest of the World Social Robots Market Volume (K Unit), by Country 2024 & 2032
- Figure 57: Rest of the World Social Robots Market Revenue Share (%), by Country 2024 & 2032
- Figure 58: Rest of the World Social Robots Market Volume Share (%), by Country 2024 & 2032
List of Tables
- Table 1: Global Social Robots Market Revenue Million Forecast, by Region 2019 & 2032
- Table 2: Global Social Robots Market Volume K Unit Forecast, by Region 2019 & 2032
- Table 3: Global Social Robots Market Revenue Million Forecast, by End-user Vertical 2019 & 2032
- Table 4: Global Social Robots Market Volume K Unit Forecast, by End-user Vertical 2019 & 2032
- Table 5: Global Social Robots Market Revenue Million Forecast, by Region 2019 & 2032
- Table 6: Global Social Robots Market Volume K Unit Forecast, by Region 2019 & 2032
- Table 7: Global Social Robots Market Revenue Million Forecast, by Country 2019 & 2032
- Table 8: Global Social Robots Market Volume K Unit Forecast, by Country 2019 & 2032
- Table 9: United States Social Robots Market Revenue (Million) Forecast, by Application 2019 & 2032
- Table 10: United States Social Robots Market Volume (K Unit) Forecast, by Application 2019 & 2032
- Table 11: Canada Social Robots Market Revenue (Million) Forecast, by Application 2019 & 2032
- Table 12: Canada Social Robots Market Volume (K Unit) Forecast, by Application 2019 & 2032
- Table 13: Mexico Social Robots Market Revenue (Million) Forecast, by Application 2019 & 2032
- Table 14: Mexico Social Robots Market Volume (K Unit) Forecast, by Application 2019 & 2032
- Table 15: Global Social Robots Market Revenue Million Forecast, by Country 2019 & 2032
- Table 16: Global Social Robots Market Volume K Unit Forecast, by Country 2019 & 2032
- Table 17: Germany Social Robots Market Revenue (Million) Forecast, by Application 2019 & 2032
- Table 18: Germany Social Robots Market Volume (K Unit) Forecast, by Application 2019 & 2032
- Table 19: United Kingdom Social Robots Market Revenue (Million) Forecast, by Application 2019 & 2032
- Table 20: United Kingdom Social Robots Market Volume (K Unit) Forecast, by Application 2019 & 2032
- Table 21: France Social Robots Market Revenue (Million) Forecast, by Application 2019 & 2032
- Table 22: France Social Robots Market Volume (K Unit) Forecast, by Application 2019 & 2032
- Table 23: Spain Social Robots Market Revenue (Million) Forecast, by Application 2019 & 2032
- Table 24: Spain Social Robots Market Volume (K Unit) Forecast, by Application 2019 & 2032
- Table 25: Italy Social Robots Market Revenue (Million) Forecast, by Application 2019 & 2032
- Table 26: Italy Social Robots Market Volume (K Unit) Forecast, by Application 2019 & 2032
- Table 27: Spain Social Robots Market Revenue (Million) Forecast, by Application 2019 & 2032
- Table 28: Spain Social Robots Market Volume (K Unit) Forecast, by Application 2019 & 2032
- Table 29: Belgium Social Robots Market Revenue (Million) Forecast, by Application 2019 & 2032
- Table 30: Belgium Social Robots Market Volume (K Unit) Forecast, by Application 2019 & 2032
- Table 31: Netherland Social Robots Market Revenue (Million) Forecast, by Application 2019 & 2032
- Table 32: Netherland Social Robots Market Volume (K Unit) Forecast, by Application 2019 & 2032
- Table 33: Nordics Social Robots Market Revenue (Million) Forecast, by Application 2019 & 2032
- Table 34: Nordics Social Robots Market Volume (K Unit) Forecast, by Application 2019 & 2032
- Table 35: Rest of Europe Social Robots Market Revenue (Million) Forecast, by Application 2019 & 2032
- Table 36: Rest of Europe Social Robots Market Volume (K Unit) Forecast, by Application 2019 & 2032
- Table 37: Global Social Robots Market Revenue Million Forecast, by Country 2019 & 2032
- Table 38: Global Social Robots Market Volume K Unit Forecast, by Country 2019 & 2032
- Table 39: China Social Robots Market Revenue (Million) Forecast, by Application 2019 & 2032
- Table 40: China Social Robots Market Volume (K Unit) Forecast, by Application 2019 & 2032
- Table 41: Japan Social Robots Market Revenue (Million) Forecast, by Application 2019 & 2032
- Table 42: Japan Social Robots Market Volume (K Unit) Forecast, by Application 2019 & 2032
- Table 43: India Social Robots Market Revenue (Million) Forecast, by Application 2019 & 2032
- Table 44: India Social Robots Market Volume (K Unit) Forecast, by Application 2019 & 2032
- Table 45: South Korea Social Robots Market Revenue (Million) Forecast, by Application 2019 & 2032
- Table 46: South Korea Social Robots Market Volume (K Unit) Forecast, by Application 2019 & 2032
- Table 47: Southeast Asia Social Robots Market Revenue (Million) Forecast, by Application 2019 & 2032
- Table 48: Southeast Asia Social Robots Market Volume (K Unit) Forecast, by Application 2019 & 2032
- Table 49: Australia Social Robots Market Revenue (Million) Forecast, by Application 2019 & 2032
- Table 50: Australia Social Robots Market Volume (K Unit) Forecast, by Application 2019 & 2032
- Table 51: Indonesia Social Robots Market Revenue (Million) Forecast, by Application 2019 & 2032
- Table 52: Indonesia Social Robots Market Volume (K Unit) Forecast, by Application 2019 & 2032
- Table 53: Phillipes Social Robots Market Revenue (Million) Forecast, by Application 2019 & 2032
- Table 54: Phillipes Social Robots Market Volume (K Unit) Forecast, by Application 2019 & 2032
- Table 55: Singapore Social Robots Market Revenue (Million) Forecast, by Application 2019 & 2032
- Table 56: Singapore Social Robots Market Volume (K Unit) Forecast, by Application 2019 & 2032
- Table 57: Thailandc Social Robots Market Revenue (Million) Forecast, by Application 2019 & 2032
- Table 58: Thailandc Social Robots Market Volume (K Unit) Forecast, by Application 2019 & 2032
- Table 59: Rest of Asia Pacific Social Robots Market Revenue (Million) Forecast, by Application 2019 & 2032
- Table 60: Rest of Asia Pacific Social Robots Market Volume (K Unit) Forecast, by Application 2019 & 2032
- Table 61: Global Social Robots Market Revenue Million Forecast, by Country 2019 & 2032
- Table 62: Global Social Robots Market Volume K Unit Forecast, by Country 2019 & 2032
- Table 63: Brazil Social Robots Market Revenue (Million) Forecast, by Application 2019 & 2032
- Table 64: Brazil Social Robots Market Volume (K Unit) Forecast, by Application 2019 & 2032
- Table 65: Argentina Social Robots Market Revenue (Million) Forecast, by Application 2019 & 2032
- Table 66: Argentina Social Robots Market Volume (K Unit) Forecast, by Application 2019 & 2032
- Table 67: Peru Social Robots Market Revenue (Million) Forecast, by Application 2019 & 2032
- Table 68: Peru Social Robots Market Volume (K Unit) Forecast, by Application 2019 & 2032
- Table 69: Chile Social Robots Market Revenue (Million) Forecast, by Application 2019 & 2032
- Table 70: Chile Social Robots Market Volume (K Unit) Forecast, by Application 2019 & 2032
- Table 71: Colombia Social Robots Market Revenue (Million) Forecast, by Application 2019 & 2032
- Table 72: Colombia Social Robots Market Volume (K Unit) Forecast, by Application 2019 & 2032
- Table 73: Ecuador Social Robots Market Revenue (Million) Forecast, by Application 2019 & 2032
- Table 74: Ecuador Social Robots Market Volume (K Unit) Forecast, by Application 2019 & 2032
- Table 75: Venezuela Social Robots Market Revenue (Million) Forecast, by Application 2019 & 2032
- Table 76: Venezuela Social Robots Market Volume (K Unit) Forecast, by Application 2019 & 2032
- Table 77: Rest of South America Social Robots Market Revenue (Million) Forecast, by Application 2019 & 2032
- Table 78: Rest of South America Social Robots Market Volume (K Unit) Forecast, by Application 2019 & 2032
- Table 79: Global Social Robots Market Revenue Million Forecast, by Country 2019 & 2032
- Table 80: Global Social Robots Market Volume K Unit Forecast, by Country 2019 & 2032
- Table 81: United States Social Robots Market Revenue (Million) Forecast, by Application 2019 & 2032
- Table 82: United States Social Robots Market Volume (K Unit) Forecast, by Application 2019 & 2032
- Table 83: Canada Social Robots Market Revenue (Million) Forecast, by Application 2019 & 2032
- Table 84: Canada Social Robots Market Volume (K Unit) Forecast, by Application 2019 & 2032
- Table 85: Mexico Social Robots Market Revenue (Million) Forecast, by Application 2019 & 2032
- Table 86: Mexico Social Robots Market Volume (K Unit) Forecast, by Application 2019 & 2032
- Table 87: Global Social Robots Market Revenue Million Forecast, by Country 2019 & 2032
- Table 88: Global Social Robots Market Volume K Unit Forecast, by Country 2019 & 2032
- Table 89: United Arab Emirates Social Robots Market Revenue (Million) Forecast, by Application 2019 & 2032
- Table 90: United Arab Emirates Social Robots Market Volume (K Unit) Forecast, by Application 2019 & 2032
- Table 91: Saudi Arabia Social Robots Market Revenue (Million) Forecast, by Application 2019 & 2032
- Table 92: Saudi Arabia Social Robots Market Volume (K Unit) Forecast, by Application 2019 & 2032
- Table 93: South Africa Social Robots Market Revenue (Million) Forecast, by Application 2019 & 2032
- Table 94: South Africa Social Robots Market Volume (K Unit) Forecast, by Application 2019 & 2032
- Table 95: Rest of Middle East and Africa Social Robots Market Revenue (Million) Forecast, by Application 2019 & 2032
- Table 96: Rest of Middle East and Africa Social Robots Market Volume (K Unit) Forecast, by Application 2019 & 2032
- Table 97: Global Social Robots Market Revenue Million Forecast, by End-user Vertical 2019 & 2032
- Table 98: Global Social Robots Market Volume K Unit Forecast, by End-user Vertical 2019 & 2032
- Table 99: Global Social Robots Market Revenue Million Forecast, by Country 2019 & 2032
- Table 100: Global Social Robots Market Volume K Unit Forecast, by Country 2019 & 2032
- Table 101: Global Social Robots Market Revenue Million Forecast, by End-user Vertical 2019 & 2032
- Table 102: Global Social Robots Market Volume K Unit Forecast, by End-user Vertical 2019 & 2032
- Table 103: Global Social Robots Market Revenue Million Forecast, by Country 2019 & 2032
- Table 104: Global Social Robots Market Volume K Unit Forecast, by Country 2019 & 2032
- Table 105: Global Social Robots Market Revenue Million Forecast, by End-user Vertical 2019 & 2032
- Table 106: Global Social Robots Market Volume K Unit Forecast, by End-user Vertical 2019 & 2032
- Table 107: Global Social Robots Market Revenue Million Forecast, by Country 2019 & 2032
- Table 108: Global Social Robots Market Volume K Unit Forecast, by Country 2019 & 2032
- Table 109: Global Social Robots Market Revenue Million Forecast, by End-user Vertical 2019 & 2032
- Table 110: Global Social Robots Market Volume K Unit Forecast, by End-user Vertical 2019 & 2032
- Table 111: Global Social Robots Market Revenue Million Forecast, by Country 2019 & 2032
- Table 112: Global Social Robots Market Volume K Unit Forecast, by Country 2019 & 2032
Frequently Asked Questions
1. What is the projected Compound Annual Growth Rate (CAGR) of the Social Robots Market?
The projected CAGR is approximately 32.40%.
2. Which companies are prominent players in the Social Robots Market?
Key companies in the market include MoviaRobotics Inc, Blue Frog Robotics SAS, Camanio AB, Amy Robotics Co Ltd, Kinova Inc, AoBo Information Technology Co Ltd, Haapie SAS, Matia Robotics (US) Inc, Motorika USA Inc, Bionik Laboratories Corp, SZ DJI Technology Co Ltd, OhmniLabs Inc, Wonder Workshop Inc, Intuition Robotics Ltd, Double Robotics Inc, Embodied Inc AB, Hanson Robotics Ltd, BotsAndUs Ltd, AlterG Inc, Inrobics Social Robotics SLL, KOMPAI Robotics, Blue Ocean Robotics ApS, Furhat Robotics AB.
3. What are the main segments of the Social Robots Market?
The market segments include End-user Vertical.
4. Can you provide details about the market size?
The market size is estimated to be USD 5.64 Million as of 2022.
5. What are some drivers contributing to market growth?
Availability of Innovation Budgets and Subsidies to Drive the Adoption; High Average Wages Encouraging Business Leaders to Opt for Automation.
6. What are the notable trends driving market growth?
Healthcare Sector to Hold Significant Market Share.
7. Are there any restraints impacting market growth?
Budget Constraints Related to Software Implementation.
8. Can you provide examples of recent developments in the market?
March 2022: Intuition Robotics Ltd announced the official commercial launch of its ElliQ digital care companion. The social robot is designed to help older adults be more physically active and socially engaged, enabling them to have happier, more independent lives. Intuition Robotics has spent more than five years developing and beta-testing ElliQ with older adults. ElliQ is designed to connect older adults to their families, caregivers, and the outside world through behavioral sciences, combining psychology and advanced cognitive AI capabilities. The robot is designed specifically for the older population living alone. ElliQ has shown it effectively alleviates feelings of loneliness and social isolation.
9. What pricing options are available for accessing the report?
Pricing options include single-user, multi-user, and enterprise licenses priced at USD 4750, USD 5250, and USD 8750 respectively.
10. Is the market size provided in terms of value or volume?
The market size is provided in terms of value, measured in Million and volume, measured in K Unit.
11. Are there any specific market keywords associated with the report?
Yes, the market keyword associated with the report is "Social Robots Market," which aids in identifying and referencing the specific market segment covered.
12. How do I determine which pricing option suits my needs best?
The pricing options vary based on user requirements and access needs. Individual users may opt for single-user licenses, while businesses requiring broader access may choose multi-user or enterprise licenses for cost-effective access to the report.
13. Are there any additional resources or data provided in the Social Robots Market report?
While the report offers comprehensive insights, it's advisable to review the specific contents or supplementary materials provided to ascertain if additional resources or data are available.
14. How can I stay updated on further developments or reports in the Social Robots Market?
To stay informed about further developments, trends, and reports in the Social Robots Market, consider subscribing to industry newsletters, following relevant companies and organizations, or regularly checking reputable industry news sources and publications.
Methodology
Step 1 - Identification of Relevant Samples Size from Population Database


Step 2 - Approaches for Defining Global Market Size (Value, Volume* & Price*)

Note*: In applicable scenarios
Step 3 - Data Sources
Primary Research
- Web Analytics
- Survey Reports
- Research Institute
- Latest Research Reports
- Opinion Leaders
Secondary Research
- Annual Reports
- White Paper
- Latest Press Release
- Industry Association
- Paid Database
- Investor Presentations

Step 4 - Data Triangulation
Involves using different sources of information in order to increase the validity of a study
These sources are likely to be stakeholders in a program - participants, other researchers, program staff, other community members, and so on.
Then we put all data in single framework & apply various statistical tools to find out the dynamic on the market.
During the analysis stage, feedback from the stakeholder groups would be compared to determine areas of agreement as well as areas of divergence


