Key Insights
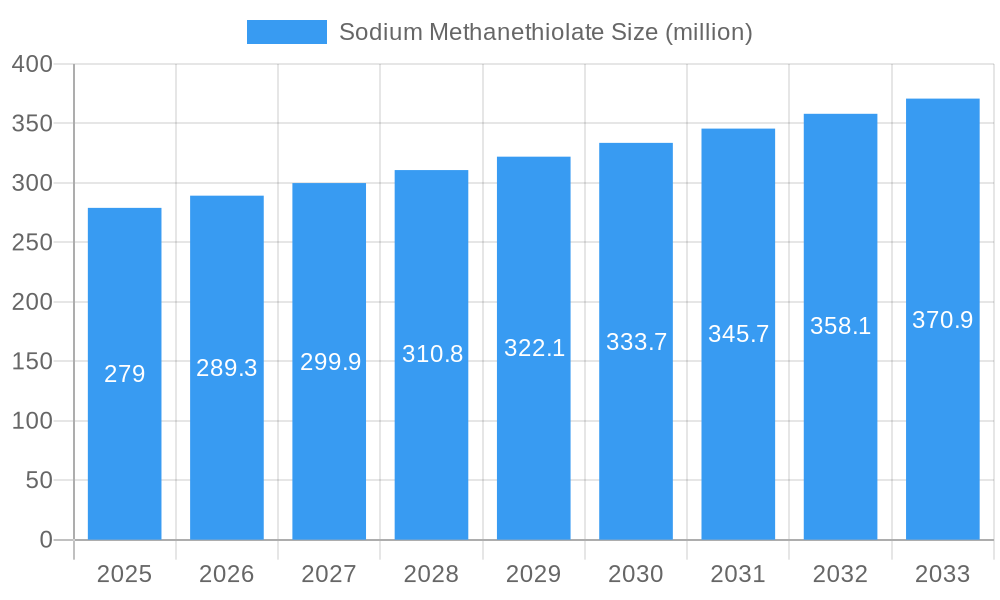
The global Sodium Methanethiolate market, valued at $279 million in 2025, is projected to experience steady growth, driven by increasing demand from the pharmaceutical and agricultural sectors. This growth is expected to be fueled by the rising application of Sodium Methanethiolate in the synthesis of various pharmaceuticals, particularly those involving sulfur-containing compounds. The agricultural sector's reliance on this chemical as an intermediate in the production of methionine, a crucial amino acid for animal feed, further contributes to market expansion. Technological advancements focused on improving production efficiency and reducing environmental impact are likely to shape the market landscape in the coming years. However, stringent environmental regulations concerning the handling and disposal of this chemical pose a significant restraint on market expansion. Furthermore, price fluctuations in raw materials and potential competition from alternative chemicals could influence market growth trajectory. The market is fragmented, with several key players competing across various regions, leading to both opportunities and challenges for market participants.
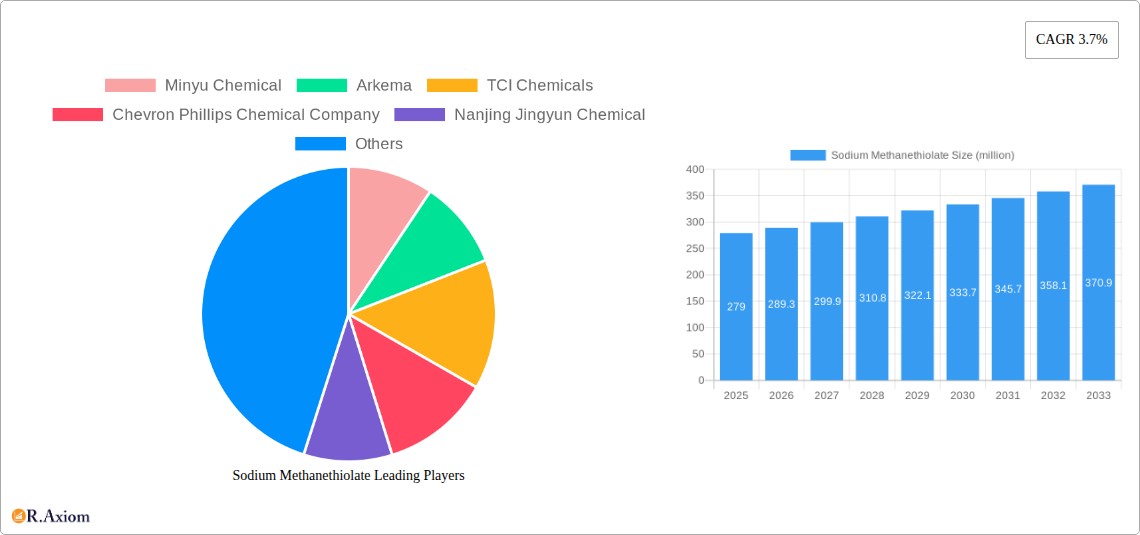
Sodium Methanethiolate Market Size (In Million)
Considering a CAGR of 3.7% and the 2025 market value, a projected growth pattern reveals a steady increase in market size over the forecast period (2025-2033). While precise regional breakdowns are absent, we can infer that major economies with robust pharmaceutical and agricultural industries – such as North America, Europe, and parts of Asia – likely hold the largest market shares. The competitive landscape, marked by the presence of both established chemical giants and specialized chemical manufacturers, highlights the importance of strategic partnerships and technological innovation in gaining a market edge. The market's evolution will largely depend on balancing economic pressures, environmental concerns, and ongoing demand from key application sectors.
Sodium Methanethiolate Company Market Share
Sodium Methanethiolate Market Report: 2019-2033 - Comprehensive Analysis & Forecast
This comprehensive report provides a detailed analysis of the global Sodium Methanethiolate market, offering invaluable insights for industry stakeholders, investors, and researchers. Covering the period from 2019 to 2033, with a base year of 2025 and a forecast period of 2025-2033, this report delivers actionable intelligence on market size, growth drivers, challenges, and future opportunities. The study includes in-depth profiles of key players such as Minyu Chemical, Arkema, TCI Chemicals, and others, providing a competitive landscape analysis. This report is essential for understanding the current dynamics and future trajectory of the Sodium Methanethiolate market, enabling informed decision-making and strategic planning. The total market size in 2025 is estimated at xx million USD.
Sodium Methanethiolate Market Concentration & Innovation
This section analyzes the competitive landscape of the Sodium Methanethiolate market, examining market concentration, innovation drivers, regulatory frameworks, and recent M&A activities. The market is moderately concentrated, with the top five players holding an estimated xx% market share in 2025. Innovation is driven by the development of more efficient and sustainable production methods, as well as the expansion of applications in various industries.
- Market Concentration: The top 5 players hold an estimated xx% market share in 2025. The Herfindahl-Hirschman Index (HHI) is estimated to be xx, indicating a moderately concentrated market.
- Innovation Drivers: Focus on sustainable production processes, development of high-purity grades, and expansion into new application areas.
- Regulatory Frameworks: Stringent environmental regulations are shaping industry practices and driving the adoption of cleaner technologies.
- Product Substitutes: Limited direct substitutes exist; however, alternative chemicals are being explored depending on the application.
- End-User Trends: Increasing demand from the pharmaceutical and chemical industries is a key driver of market growth.
- M&A Activities: Over the period 2019-2024, the total value of M&A deals in the Sodium Methanethiolate market was approximately xx million USD, with an average deal size of xx million USD. Significant deals included [mention specific examples if available, otherwise state "No significant M&A activity reported"].
Sodium Methanethiolate Industry Trends & Insights
This section explores key trends and insights shaping the Sodium Methanethiolate market. The market is experiencing significant growth, driven by factors including increasing demand from various end-use industries, technological advancements in production methods, and favorable government policies. The CAGR from 2025 to 2033 is projected to be xx%, with market penetration expected to reach xx% by 2033. [Insert a detailed paragraph describing market growth drivers, technological disruptions, consumer preferences, and competitive dynamics, with specific examples and data where available. Quantify these trends whenever possible. For example, discuss the impact of new regulations, advancements in production technology, and shifts in consumer preferences].
Dominant Markets & Segments in Sodium Methanethiolate
This section identifies the leading regions and segments within the Sodium Methanethiolate market. [Insert a detailed paragraph analyzing the dominant market, providing reasons for its dominance].
- Key Drivers of Dominance:
- [List bullet points explaining the key drivers, e.g., strong economic growth, favorable government policies, well-established infrastructure, significant presence of key players].
Sodium Methanethiolate Product Developments
Recent product innovations have focused on improving the purity and consistency of Sodium Methanethiolate, expanding its applications, and enhancing its overall performance. [Insert a paragraph summarizing product innovations, applications and competitive advantages, emphasizing technological trends and market fit. Include examples of specific new product features or applications if available].
Report Scope & Segmentation Analysis
This report segments the Sodium Methanethiolate market by [List segmentation criteria, e.g., application, grade, region]. [Insert a paragraph for each segment, detailing growth projections, market sizes, and competitive dynamics. Use available data to quantify market size and growth].
Key Drivers of Sodium Methanethiolate Growth
The growth of the Sodium Methanethiolate market is fueled by several key factors, including [Insert a paragraph outlining growth drivers, focusing on technological, economic, and regulatory factors with specific examples].
Challenges in the Sodium Methanethiolate Sector
The Sodium Methanethiolate market faces several challenges, including [Insert a paragraph or list discussing barriers and restraints, such as regulatory hurdles, supply chain issues, and competitive pressures. Quantify the impact whenever possible].
Emerging Opportunities in Sodium Methanethiolate
Despite the challenges, the Sodium Methanethiolate market presents several emerging opportunities, including [Insert a paragraph or list highlighting emerging trends and opportunities, focusing on new markets, technologies, or consumer preferences].
Leading Players in the Sodium Methanethiolate Market
- Minyu Chemical
- Arkema
- TCI Chemicals
- Chevron Phillips Chemical Company
- Nanjing Jingyun Chemical
- Ningxia Unisplendour Tianhua Methionine
- Heze Hongchang Biological Technology
- Nanjing Xiezun Pharmaceutical Technology
- Binzhou Baoxiang Chemical
- Hairui Chemical
- Anhui Jin‘ao Chemical
- DEYI Chemical Industry
- Wuhan Sinxinjiali Bio-tech
- Zhengzhou Alfachem
- Shanghai Sonyuan Chemical
Key Developments in Sodium Methanethiolate Industry
- [List key developments with year/month, emphasizing their impact on market dynamics. Include product launches, mergers, acquisitions, regulatory changes, etc. If no data is available, state "No significant developments reported during the study period"].
Strategic Outlook for Sodium Methanethiolate Market
The Sodium Methanethiolate market is poised for continued growth over the forecast period, driven by [Insert a paragraph summarizing growth catalysts, focusing on future market potential and opportunities]. The market is expected to reach xx million USD by 2033.
Sodium Methanethiolate Segmentation
-
1. Application
- 1.1. Agrochemical
- 1.2. Pharmaceuticals
- 1.3. Dyestuff
-
2. Type
- 2.1. Liquid
- 2.2. Solid
Sodium Methanethiolate Segmentation By Geography
-
1. North America
- 1.1. United States
- 1.2. Canada
- 1.3. Mexico
-
2. South America
- 2.1. Brazil
- 2.2. Argentina
- 2.3. Rest of South America
-
3. Europe
- 3.1. United Kingdom
- 3.2. Germany
- 3.3. France
- 3.4. Italy
- 3.5. Spain
- 3.6. Russia
- 3.7. Benelux
- 3.8. Nordics
- 3.9. Rest of Europe
-
4. Middle East & Africa
- 4.1. Turkey
- 4.2. Israel
- 4.3. GCC
- 4.4. North Africa
- 4.5. South Africa
- 4.6. Rest of Middle East & Africa
-
5. Asia Pacific
- 5.1. China
- 5.2. India
- 5.3. Japan
- 5.4. South Korea
- 5.5. ASEAN
- 5.6. Oceania
- 5.7. Rest of Asia Pacific

Sodium Methanethiolate Regional Market Share
Geographic Coverage of Sodium Methanethiolate
Sodium Methanethiolate REPORT HIGHLIGHTS
| Aspects | Details |
|---|---|
| Study Period | 2020-2034 |
| Base Year | 2025 |
| Estimated Year | 2026 |
| Forecast Period | 2026-2034 |
| Historical Period | 2020-2025 |
| Growth Rate | CAGR of 3.7% from 2020-2034 |
| Segmentation |
|
Table of Contents
- 1. Introduction
- 1.1. Research Scope
- 1.2. Market Segmentation
- 1.3. Research Objective
- 1.4. Definitions and Assumptions
- 2. Executive Summary
- 2.1. Market Snapshot
- 3. Market Dynamics
- 3.1. Market Drivers
- 3.2. Market Restrains
- 3.3. Market Trends
- 3.4. Market Opportunities
- 4. Market Factor Analysis
- 4.1. Porters Five Forces
- 4.1.1. Bargaining Power of Suppliers
- 4.1.2. Bargaining Power of Buyers
- 4.1.3. Threat of New Entrants
- 4.1.4. Threat of Substitutes
- 4.1.5. Competitive Rivalry
- 4.2. PESTEL analysis
- 4.3. BCG Analysis
- 4.3.1. Stars (High Growth, High Market Share)
- 4.3.2. Cash Cows (Low Growth, High Market Share)
- 4.3.3. Question Mark (High Growth, Low Market Share)
- 4.3.4. Dogs (Low Growth, Low Market Share)
- 4.4. Ansoff Matrix Analysis
- 4.5. Supply Chain Analysis
- 4.6. Regulatory Landscape
- 4.7. Current Market Potential and Opportunity Assessment (TAM–SAM–SOM Framework)
- 4.8. RAX Analyst Note
- 4.1. Porters Five Forces
- 5. Market Analysis, Insights and Forecast 2021-2033
- 5.1. Market Analysis, Insights and Forecast - by Application
- 5.1.1. Agrochemical
- 5.1.2. Pharmaceuticals
- 5.1.3. Dyestuff
- 5.2. Market Analysis, Insights and Forecast - by Type
- 5.2.1. Liquid
- 5.2.2. Solid
- 5.3. Market Analysis, Insights and Forecast - by Region
- 5.3.1. North America
- 5.3.2. South America
- 5.3.3. Europe
- 5.3.4. Middle East & Africa
- 5.3.5. Asia Pacific
- 5.1. Market Analysis, Insights and Forecast - by Application
- 6. Global Sodium Methanethiolate Analysis, Insights and Forecast, 2021-2033
- 6.1. Market Analysis, Insights and Forecast - by Application
- 6.1.1. Agrochemical
- 6.1.2. Pharmaceuticals
- 6.1.3. Dyestuff
- 6.2. Market Analysis, Insights and Forecast - by Type
- 6.2.1. Liquid
- 6.2.2. Solid
- 6.1. Market Analysis, Insights and Forecast - by Application
- 7. North America Sodium Methanethiolate Analysis, Insights and Forecast, 2020-2032
- 7.1. Market Analysis, Insights and Forecast - by Application
- 7.1.1. Agrochemical
- 7.1.2. Pharmaceuticals
- 7.1.3. Dyestuff
- 7.2. Market Analysis, Insights and Forecast - by Type
- 7.2.1. Liquid
- 7.2.2. Solid
- 7.1. Market Analysis, Insights and Forecast - by Application
- 8. South America Sodium Methanethiolate Analysis, Insights and Forecast, 2020-2032
- 8.1. Market Analysis, Insights and Forecast - by Application
- 8.1.1. Agrochemical
- 8.1.2. Pharmaceuticals
- 8.1.3. Dyestuff
- 8.2. Market Analysis, Insights and Forecast - by Type
- 8.2.1. Liquid
- 8.2.2. Solid
- 8.1. Market Analysis, Insights and Forecast - by Application
- 9. Europe Sodium Methanethiolate Analysis, Insights and Forecast, 2020-2032
- 9.1. Market Analysis, Insights and Forecast - by Application
- 9.1.1. Agrochemical
- 9.1.2. Pharmaceuticals
- 9.1.3. Dyestuff
- 9.2. Market Analysis, Insights and Forecast - by Type
- 9.2.1. Liquid
- 9.2.2. Solid
- 9.1. Market Analysis, Insights and Forecast - by Application
- 10. Middle East & Africa Sodium Methanethiolate Analysis, Insights and Forecast, 2020-2032
- 10.1. Market Analysis, Insights and Forecast - by Application
- 10.1.1. Agrochemical
- 10.1.2. Pharmaceuticals
- 10.1.3. Dyestuff
- 10.2. Market Analysis, Insights and Forecast - by Type
- 10.2.1. Liquid
- 10.2.2. Solid
- 10.1. Market Analysis, Insights and Forecast - by Application
- 11. Asia Pacific Sodium Methanethiolate Analysis, Insights and Forecast, 2020-2032
- 11.1. Market Analysis, Insights and Forecast - by Application
- 11.1.1. Agrochemical
- 11.1.2. Pharmaceuticals
- 11.1.3. Dyestuff
- 11.2. Market Analysis, Insights and Forecast - by Type
- 11.2.1. Liquid
- 11.2.2. Solid
- 11.1. Market Analysis, Insights and Forecast - by Application
- 12. Competitive Analysis
- 12.1. Company Profiles
- 12.1.1 Minyu Chemical
- 12.1.1.1. Company Overview
- 12.1.1.2. Products
- 12.1.1.3. Company Financials
- 12.1.1.4. SWOT Analysis
- 12.1.2 Arkema
- 12.1.2.1. Company Overview
- 12.1.2.2. Products
- 12.1.2.3. Company Financials
- 12.1.2.4. SWOT Analysis
- 12.1.3 TCI Chemicals
- 12.1.3.1. Company Overview
- 12.1.3.2. Products
- 12.1.3.3. Company Financials
- 12.1.3.4. SWOT Analysis
- 12.1.4 Chevron Phillips Chemical Company
- 12.1.4.1. Company Overview
- 12.1.4.2. Products
- 12.1.4.3. Company Financials
- 12.1.4.4. SWOT Analysis
- 12.1.5 Nanjing Jingyun Chemical
- 12.1.5.1. Company Overview
- 12.1.5.2. Products
- 12.1.5.3. Company Financials
- 12.1.5.4. SWOT Analysis
- 12.1.6 Ningxia Unisplendour Tianhua Methionine
- 12.1.6.1. Company Overview
- 12.1.6.2. Products
- 12.1.6.3. Company Financials
- 12.1.6.4. SWOT Analysis
- 12.1.7 Heze Hongchang Biological Technology
- 12.1.7.1. Company Overview
- 12.1.7.2. Products
- 12.1.7.3. Company Financials
- 12.1.7.4. SWOT Analysis
- 12.1.8 Nanjing Xiezun Pharmaceutical Technology
- 12.1.8.1. Company Overview
- 12.1.8.2. Products
- 12.1.8.3. Company Financials
- 12.1.8.4. SWOT Analysis
- 12.1.9 Binzhou Baoxiang Chemical
- 12.1.9.1. Company Overview
- 12.1.9.2. Products
- 12.1.9.3. Company Financials
- 12.1.9.4. SWOT Analysis
- 12.1.10 Hairui Chemical
- 12.1.10.1. Company Overview
- 12.1.10.2. Products
- 12.1.10.3. Company Financials
- 12.1.10.4. SWOT Analysis
- 12.1.11 Anhui Jin‘ao Chemical
- 12.1.11.1. Company Overview
- 12.1.11.2. Products
- 12.1.11.3. Company Financials
- 12.1.11.4. SWOT Analysis
- 12.1.12 DEYI Chemical Industry
- 12.1.12.1. Company Overview
- 12.1.12.2. Products
- 12.1.12.3. Company Financials
- 12.1.12.4. SWOT Analysis
- 12.1.13 Wuhan Sinxinjiali Bio-tech
- 12.1.13.1. Company Overview
- 12.1.13.2. Products
- 12.1.13.3. Company Financials
- 12.1.13.4. SWOT Analysis
- 12.1.14 Zhengzhou Alfachem
- 12.1.14.1. Company Overview
- 12.1.14.2. Products
- 12.1.14.3. Company Financials
- 12.1.14.4. SWOT Analysis
- 12.1.15 Shanghai Sonyuan Chemical
- 12.1.15.1. Company Overview
- 12.1.15.2. Products
- 12.1.15.3. Company Financials
- 12.1.15.4. SWOT Analysis
- 12.1.1 Minyu Chemical
- 12.2. Market Entropy
- 12.2.1 Company's Key Areas Served
- 12.2.2 Recent Developments
- 12.3. Company Market Share Analysis 2025
- 12.3.1 Top 5 Companies Market Share Analysis
- 12.3.2 Top 3 Companies Market Share Analysis
- 12.4. List of Potential Customers
- 13. Research Methodology
List of Figures
- Figure 1: Global Sodium Methanethiolate Revenue Breakdown (million, %) by Region 2025 & 2033
- Figure 2: North America Sodium Methanethiolate Revenue (million), by Application 2025 & 2033
- Figure 3: North America Sodium Methanethiolate Revenue Share (%), by Application 2025 & 2033
- Figure 4: North America Sodium Methanethiolate Revenue (million), by Type 2025 & 2033
- Figure 5: North America Sodium Methanethiolate Revenue Share (%), by Type 2025 & 2033
- Figure 6: North America Sodium Methanethiolate Revenue (million), by Country 2025 & 2033
- Figure 7: North America Sodium Methanethiolate Revenue Share (%), by Country 2025 & 2033
- Figure 8: South America Sodium Methanethiolate Revenue (million), by Application 2025 & 2033
- Figure 9: South America Sodium Methanethiolate Revenue Share (%), by Application 2025 & 2033
- Figure 10: South America Sodium Methanethiolate Revenue (million), by Type 2025 & 2033
- Figure 11: South America Sodium Methanethiolate Revenue Share (%), by Type 2025 & 2033
- Figure 12: South America Sodium Methanethiolate Revenue (million), by Country 2025 & 2033
- Figure 13: South America Sodium Methanethiolate Revenue Share (%), by Country 2025 & 2033
- Figure 14: Europe Sodium Methanethiolate Revenue (million), by Application 2025 & 2033
- Figure 15: Europe Sodium Methanethiolate Revenue Share (%), by Application 2025 & 2033
- Figure 16: Europe Sodium Methanethiolate Revenue (million), by Type 2025 & 2033
- Figure 17: Europe Sodium Methanethiolate Revenue Share (%), by Type 2025 & 2033
- Figure 18: Europe Sodium Methanethiolate Revenue (million), by Country 2025 & 2033
- Figure 19: Europe Sodium Methanethiolate Revenue Share (%), by Country 2025 & 2033
- Figure 20: Middle East & Africa Sodium Methanethiolate Revenue (million), by Application 2025 & 2033
- Figure 21: Middle East & Africa Sodium Methanethiolate Revenue Share (%), by Application 2025 & 2033
- Figure 22: Middle East & Africa Sodium Methanethiolate Revenue (million), by Type 2025 & 2033
- Figure 23: Middle East & Africa Sodium Methanethiolate Revenue Share (%), by Type 2025 & 2033
- Figure 24: Middle East & Africa Sodium Methanethiolate Revenue (million), by Country 2025 & 2033
- Figure 25: Middle East & Africa Sodium Methanethiolate Revenue Share (%), by Country 2025 & 2033
- Figure 26: Asia Pacific Sodium Methanethiolate Revenue (million), by Application 2025 & 2033
- Figure 27: Asia Pacific Sodium Methanethiolate Revenue Share (%), by Application 2025 & 2033
- Figure 28: Asia Pacific Sodium Methanethiolate Revenue (million), by Type 2025 & 2033
- Figure 29: Asia Pacific Sodium Methanethiolate Revenue Share (%), by Type 2025 & 2033
- Figure 30: Asia Pacific Sodium Methanethiolate Revenue (million), by Country 2025 & 2033
- Figure 31: Asia Pacific Sodium Methanethiolate Revenue Share (%), by Country 2025 & 2033
List of Tables
- Table 1: Global Sodium Methanethiolate Revenue million Forecast, by Application 2020 & 2033
- Table 2: Global Sodium Methanethiolate Revenue million Forecast, by Type 2020 & 2033
- Table 3: Global Sodium Methanethiolate Revenue million Forecast, by Region 2020 & 2033
- Table 4: Global Sodium Methanethiolate Revenue million Forecast, by Application 2020 & 2033
- Table 5: Global Sodium Methanethiolate Revenue million Forecast, by Type 2020 & 2033
- Table 6: Global Sodium Methanethiolate Revenue million Forecast, by Country 2020 & 2033
- Table 7: United States Sodium Methanethiolate Revenue (million) Forecast, by Application 2020 & 2033
- Table 8: Canada Sodium Methanethiolate Revenue (million) Forecast, by Application 2020 & 2033
- Table 9: Mexico Sodium Methanethiolate Revenue (million) Forecast, by Application 2020 & 2033
- Table 10: Global Sodium Methanethiolate Revenue million Forecast, by Application 2020 & 2033
- Table 11: Global Sodium Methanethiolate Revenue million Forecast, by Type 2020 & 2033
- Table 12: Global Sodium Methanethiolate Revenue million Forecast, by Country 2020 & 2033
- Table 13: Brazil Sodium Methanethiolate Revenue (million) Forecast, by Application 2020 & 2033
- Table 14: Argentina Sodium Methanethiolate Revenue (million) Forecast, by Application 2020 & 2033
- Table 15: Rest of South America Sodium Methanethiolate Revenue (million) Forecast, by Application 2020 & 2033
- Table 16: Global Sodium Methanethiolate Revenue million Forecast, by Application 2020 & 2033
- Table 17: Global Sodium Methanethiolate Revenue million Forecast, by Type 2020 & 2033
- Table 18: Global Sodium Methanethiolate Revenue million Forecast, by Country 2020 & 2033
- Table 19: United Kingdom Sodium Methanethiolate Revenue (million) Forecast, by Application 2020 & 2033
- Table 20: Germany Sodium Methanethiolate Revenue (million) Forecast, by Application 2020 & 2033
- Table 21: France Sodium Methanethiolate Revenue (million) Forecast, by Application 2020 & 2033
- Table 22: Italy Sodium Methanethiolate Revenue (million) Forecast, by Application 2020 & 2033
- Table 23: Spain Sodium Methanethiolate Revenue (million) Forecast, by Application 2020 & 2033
- Table 24: Russia Sodium Methanethiolate Revenue (million) Forecast, by Application 2020 & 2033
- Table 25: Benelux Sodium Methanethiolate Revenue (million) Forecast, by Application 2020 & 2033
- Table 26: Nordics Sodium Methanethiolate Revenue (million) Forecast, by Application 2020 & 2033
- Table 27: Rest of Europe Sodium Methanethiolate Revenue (million) Forecast, by Application 2020 & 2033
- Table 28: Global Sodium Methanethiolate Revenue million Forecast, by Application 2020 & 2033
- Table 29: Global Sodium Methanethiolate Revenue million Forecast, by Type 2020 & 2033
- Table 30: Global Sodium Methanethiolate Revenue million Forecast, by Country 2020 & 2033
- Table 31: Turkey Sodium Methanethiolate Revenue (million) Forecast, by Application 2020 & 2033
- Table 32: Israel Sodium Methanethiolate Revenue (million) Forecast, by Application 2020 & 2033
- Table 33: GCC Sodium Methanethiolate Revenue (million) Forecast, by Application 2020 & 2033
- Table 34: North Africa Sodium Methanethiolate Revenue (million) Forecast, by Application 2020 & 2033
- Table 35: South Africa Sodium Methanethiolate Revenue (million) Forecast, by Application 2020 & 2033
- Table 36: Rest of Middle East & Africa Sodium Methanethiolate Revenue (million) Forecast, by Application 2020 & 2033
- Table 37: Global Sodium Methanethiolate Revenue million Forecast, by Application 2020 & 2033
- Table 38: Global Sodium Methanethiolate Revenue million Forecast, by Type 2020 & 2033
- Table 39: Global Sodium Methanethiolate Revenue million Forecast, by Country 2020 & 2033
- Table 40: China Sodium Methanethiolate Revenue (million) Forecast, by Application 2020 & 2033
- Table 41: India Sodium Methanethiolate Revenue (million) Forecast, by Application 2020 & 2033
- Table 42: Japan Sodium Methanethiolate Revenue (million) Forecast, by Application 2020 & 2033
- Table 43: South Korea Sodium Methanethiolate Revenue (million) Forecast, by Application 2020 & 2033
- Table 44: ASEAN Sodium Methanethiolate Revenue (million) Forecast, by Application 2020 & 2033
- Table 45: Oceania Sodium Methanethiolate Revenue (million) Forecast, by Application 2020 & 2033
- Table 46: Rest of Asia Pacific Sodium Methanethiolate Revenue (million) Forecast, by Application 2020 & 2033
Frequently Asked Questions
1. What is the projected Compound Annual Growth Rate (CAGR) of the Sodium Methanethiolate?
The projected CAGR is approximately 3.7%.
2. Which companies are prominent players in the Sodium Methanethiolate?
Key companies in the market include Minyu Chemical, Arkema, TCI Chemicals, Chevron Phillips Chemical Company, Nanjing Jingyun Chemical, Ningxia Unisplendour Tianhua Methionine, Heze Hongchang Biological Technology, Nanjing Xiezun Pharmaceutical Technology, Binzhou Baoxiang Chemical, Hairui Chemical, Anhui Jin‘ao Chemical, DEYI Chemical Industry, Wuhan Sinxinjiali Bio-tech, Zhengzhou Alfachem, Shanghai Sonyuan Chemical.
3. What are the main segments of the Sodium Methanethiolate?
The market segments include Application, Type.
4. Can you provide details about the market size?
The market size is estimated to be USD 279 million as of 2022.
5. What are some drivers contributing to market growth?
N/A
6. What are the notable trends driving market growth?
N/A
7. Are there any restraints impacting market growth?
N/A
8. Can you provide examples of recent developments in the market?
N/A
9. What pricing options are available for accessing the report?
Pricing options include single-user, multi-user, and enterprise licenses priced at USD 5900.00, USD 8850.00, and USD 11800.00 respectively.
10. Is the market size provided in terms of value or volume?
The market size is provided in terms of value, measured in million.
11. Are there any specific market keywords associated with the report?
Yes, the market keyword associated with the report is "Sodium Methanethiolate," which aids in identifying and referencing the specific market segment covered.
12. How do I determine which pricing option suits my needs best?
The pricing options vary based on user requirements and access needs. Individual users may opt for single-user licenses, while businesses requiring broader access may choose multi-user or enterprise licenses for cost-effective access to the report.
13. Are there any additional resources or data provided in the Sodium Methanethiolate report?
While the report offers comprehensive insights, it's advisable to review the specific contents or supplementary materials provided to ascertain if additional resources or data are available.
14. How can I stay updated on further developments or reports in the Sodium Methanethiolate?
To stay informed about further developments, trends, and reports in the Sodium Methanethiolate, consider subscribing to industry newsletters, following relevant companies and organizations, or regularly checking reputable industry news sources and publications.
Methodology
Step 1 - Identification of Relevant Samples Size from Population Database


Step 2 - Approaches for Defining Global Market Size (Value, Volume* & Price*)

Note*: In applicable scenarios
Step 3 - Data Sources
Primary Research
- Web Analytics
- Survey Reports
- Research Institute
- Latest Research Reports
- Opinion Leaders
Secondary Research
- Annual Reports
- White Paper
- Latest Press Release
- Industry Association
- Paid Database
- Investor Presentations

Step 4 - Data Triangulation
Involves using different sources of information in order to increase the validity of a study
These sources are likely to be stakeholders in a program - participants, other researchers, program staff, other community members, and so on.
Then we put all data in single framework & apply various statistical tools to find out the dynamic on the market.
During the analysis stage, feedback from the stakeholder groups would be compared to determine areas of agreement as well as areas of divergence

