
Key Insights
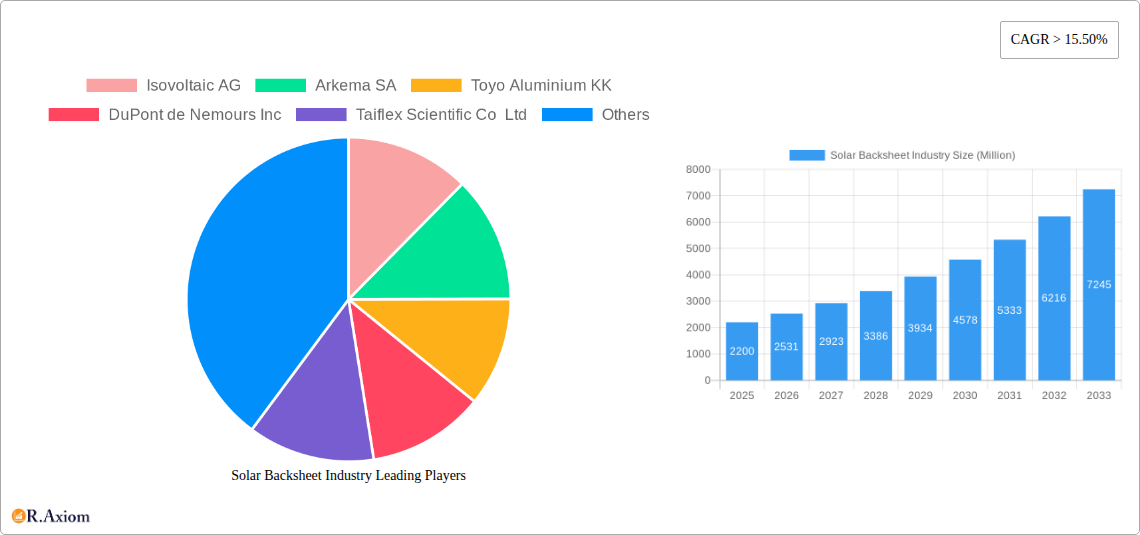
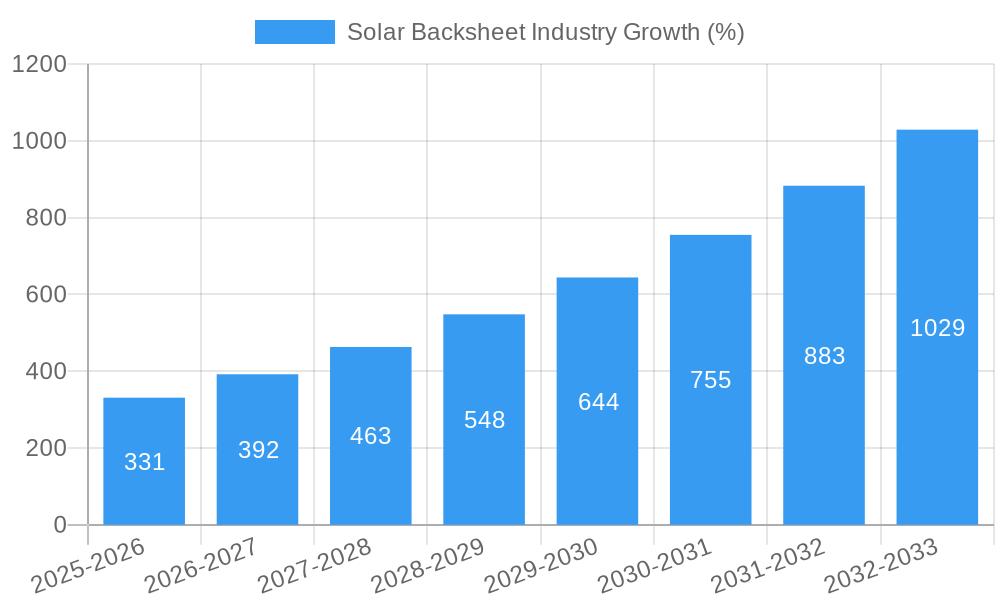
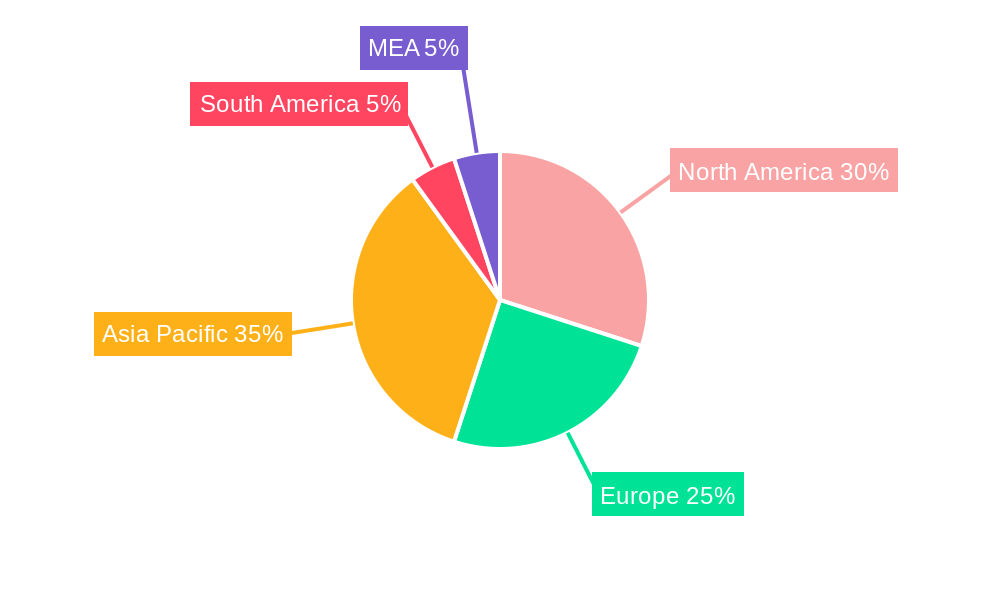
The global solar backsheet market, valued at $2.2 billion in 2025, is projected to experience robust growth, exhibiting a Compound Annual Growth Rate (CAGR) exceeding 15.5% from 2025 to 2033. This expansion is driven by the burgeoning renewable energy sector and the increasing adoption of solar photovoltaic (PV) systems globally. Key factors fueling market growth include the declining cost of solar energy, supportive government policies promoting clean energy initiatives, and advancements in backsheet technology leading to improved durability, efficiency, and longevity. The rising demand for high-efficiency solar panels, especially in emerging economies experiencing rapid industrialization and urbanization, further contributes to market expansion. Competition among manufacturers is intense, with companies like DuPont, 3M, and Arkema vying for market share through innovation and strategic partnerships. The market is segmented by material type, with fluoropolymer backsheets commanding a premium due to their superior performance characteristics, while non-fluoropolymer options offer a more cost-effective alternative. Geographic growth is expected to be widespread, with North America, Europe, and Asia-Pacific representing significant market segments. However, regional variations will be influenced by government regulations, investment in renewable energy infrastructure, and the pace of solar energy adoption in each region.
Market segmentation by material type (fluoropolymer and non-fluoropolymer) plays a crucial role in shaping market dynamics. Fluoropolymer backsheets, while more expensive, offer superior UV resistance, moisture protection, and overall durability, extending the lifespan of solar panels. Non-fluoropolymer alternatives present a cost-effective option, particularly appealing to price-sensitive markets and projects prioritizing affordability. Regional variations in market growth reflect varying levels of government support for renewable energy, the cost of electricity, and the availability of financing for solar projects. Future growth hinges on continuous technological innovation, focusing on improving the efficiency and lifespan of solar panels, while also addressing concerns about the environmental impact of backsheet manufacturing and disposal. The industry’s success in navigating these factors will directly influence the trajectory of market growth and competitiveness in the coming years.
Solar Backsheet Industry: A Comprehensive Market Report (2019-2033)
This comprehensive report provides an in-depth analysis of the global solar backsheet industry, offering invaluable insights for stakeholders, investors, and industry professionals. With a study period spanning 2019-2033, a base year of 2025, and a forecast period of 2025-2033, this report meticulously examines market trends, competitive landscapes, and future growth prospects. The report covers key players like Isovoltaic AG, Arkema SA, Toyo Aluminium KK, DuPont de Nemours Inc, Taiflex Scientific Co Ltd, Targray Technology International Inc, Coveme SpA, 3M Co, Krempel GmbH, and Madico Inc., and segments the market by type: Fluoropolymer and Non-fluoropolymer. The report’s detailed analysis includes market size projections (in Millions), CAGR estimations, and identification of key growth drivers and challenges.
Solar Backsheet Industry Market Concentration & Innovation
The solar backsheet market exhibits a moderately concentrated landscape, with a few major players holding significant market share. While precise market share data for each company is proprietary and not publicly available, it is estimated that the top 5 players collectively account for approximately xx Million in revenue, representing a xx% market share in 2024. This concentration is primarily driven by economies of scale and substantial investments in R&D. However, the market also demonstrates a strong inclination toward innovation. The ongoing demand for improved efficiency, durability, and cost-effectiveness fuels continuous advancements in material science and manufacturing processes. Regulatory frameworks, particularly concerning environmental regulations and material safety standards, play a significant role in shaping industry practices. Product substitutes, such as alternative encapsulant materials, present a level of competitive pressure, prompting ongoing innovation to maintain market dominance. End-user trends towards larger-scale solar power projects and higher power output modules necessitate backsheets with improved performance characteristics. Mergers and acquisitions (M&A) activities have also been noteworthy, with deal values reaching xx Million in recent years, as companies strive to expand their market reach and product portfolios. For example, the acquisition of Royal DSM's Advanced Solar business by Worthen Industries in 2021 exemplifies this trend.
- Market Concentration: Moderately concentrated, top 5 players estimated at xx% market share (2024).
- Innovation Drivers: Demand for higher efficiency, durability, cost reduction, and environmental regulations.
- M&A Activity: Significant activity observed, with deal values reaching approximately xx Million in recent years.
- Regulatory Frameworks: Strong influence on material selection and manufacturing processes.
Solar Backsheet Industry Industry Trends & Insights
The global solar backsheet market is experiencing robust growth, driven by the escalating demand for solar energy globally. The market is projected to exhibit a CAGR of xx% during the forecast period (2025-2033), reaching a market value of xx Million by 2033. This growth is fueled by several factors including increasing government incentives for renewable energy adoption, decreasing solar panel costs, and growing environmental awareness. Technological advancements, such as the development of more durable and efficient backsheet materials, contribute to market expansion. Consumer preference is increasingly shifting towards higher-quality, longer-lasting solar panels, driving demand for premium backsheet products. Competitive dynamics are characterized by ongoing innovation, strategic partnerships, and M&A activities, shaping the market landscape. Market penetration of solar energy in emerging economies remains relatively low, representing a significant untapped potential for growth. The increasing adoption of large-scale solar farms and utility-scale solar projects further contributes to the overall market expansion.
Dominant Markets & Segments in Solar Backsheet Industry
The Asia-Pacific region is currently the dominant market for solar backsheets, driven by robust solar energy adoption in countries like China, Japan, and India. This dominance is primarily attributed to supportive government policies, extensive investments in renewable energy infrastructure, and a burgeoning manufacturing base within the region.
- Key Drivers for Asia-Pacific Dominance:
- Strong government support for renewable energy initiatives.
- Rapid growth in the solar PV sector.
- Significant manufacturing capacity within the region.
- Increasing demand for grid-scale solar installations.
The Fluoropolymer segment holds a larger market share compared to the Non-fluoropolymer segment. Fluoropolymer backsheets offer superior performance characteristics in terms of durability, UV resistance, and moisture protection. However, the Non-fluoropolymer segment is expected to witness significant growth due to the lower cost and the increasing focus on sustainable materials.
Fluoropolymer Segment Dominance:
- Superior performance characteristics.
- Higher initial cost.
Non-fluoropolymer Segment Growth:
- Cost-effectiveness.
- Growing interest in sustainable materials.
Solar Backsheet Industry Product Developments
Recent innovations in solar backsheets focus on enhancing durability, efficiency, and cost-effectiveness. Manufacturers are actively developing new materials with improved UV resistance, moisture barrier properties, and thermal stability. This includes advancements in fluoropolymer formulations and the exploration of alternative materials like non-fluorinated polymers. These advancements aim to extend the lifespan of solar panels and enhance their overall performance, leading to greater market acceptance and wider adoption. The integration of advanced functionalities, such as self-healing properties and improved adhesion, is another prominent area of development.
Report Scope & Segmentation Analysis
This report segments the solar backsheet market by type: Fluoropolymer and Non-fluoropolymer. The Fluoropolymer segment is projected to witness significant growth due to its superior performance characteristics, although it commands a higher price point. The Non-fluoropolymer segment is expected to experience faster growth, driven by cost advantages and increasing demand for sustainable materials. Competitive dynamics vary between segments, with established players dominating the Fluoropolymer market and new entrants emerging in the Non-fluoropolymer segment. Market size estimations are provided for each segment across the historical, base, and forecast periods.
Key Drivers of Solar Backsheet Industry Growth
The growth of the solar backsheet industry is primarily driven by several factors. Firstly, the increasing global demand for renewable energy sources, propelled by environmental concerns and government initiatives, is a major catalyst. Secondly, the declining cost of solar photovoltaic (PV) systems has made solar energy more accessible and economically viable for a wider range of consumers. Finally, technological advancements in backsheet materials, leading to improved durability and efficiency, are also crucial drivers of market growth.
Challenges in the Solar Backsheet Industry Sector
Several challenges hinder the growth of the solar backsheet industry. Fluctuations in raw material prices and supply chain disruptions can impact production costs and profitability. Furthermore, intense competition among manufacturers necessitates continuous innovation and cost optimization to maintain market share. Stringent environmental regulations and increasing focus on sustainability necessitate continuous efforts in developing eco-friendly materials.
Emerging Opportunities in Solar Backsheet Industry
Emerging opportunities in the solar backsheet industry include the growth of the distributed generation market, the increasing adoption of bifacial solar panels, and the development of flexible and transparent backsheet materials. These trends are set to drive innovation and expand market applications. Furthermore, expansion into emerging markets with high solar irradiance and supportive government policies offer significant growth potential.
Leading Players in the Solar Backsheet Industry Market
- Isovoltaic AG
- Arkema SA
- Toyo Aluminium KK
- DuPont de Nemours Inc
- Taiflex Scientific Co Ltd
- Targray Technology International Inc
- Coveme SpA
- 3M Co
- Krempel GmbH
- Madico Inc
Key Developments in Solar Backsheet Industry Industry
- March 2021: Royal DSM sold its Advanced Solar business (backsheet products) to Worthen Industries Inc.
- October 2021: A 390-MW Likana Concentrated Solar Power project auction in Chile signaled increased demand for large-scale PV installations.
Strategic Outlook for Solar Backsheet Industry Market
The solar backsheet market is poised for continued expansion, driven by the global transition towards renewable energy. Technological advancements, coupled with increasing demand and supportive government policies, will fuel market growth. Opportunities exist in developing innovative, sustainable, and cost-effective backsheet solutions catering to the evolving needs of the solar industry. The focus on improving the lifecycle performance and environmental impact of backsheets will be critical for sustained success in this dynamic market.
Solar Backsheet Industry Segmentation
-
1. Types
- 1.1. Fluoropolymer
- 1.2. Non-fluoropolymer
Solar Backsheet Industry Segmentation By Geography
- 1. North America
- 2. Europe
- 3. Asia Pacific
- 4. South America
- 5. Middle East and Africa
Solar Backsheet Industry REPORT HIGHLIGHTS
| Aspects | Details |
|---|---|
| Study Period | 2019-2033 |
| Base Year | 2024 |
| Estimated Year | 2025 |
| Forecast Period | 2025-2033 |
| Historical Period | 2019-2024 |
| Growth Rate | CAGR of > 15.50% from 2019-2033 |
| Segmentation |
|
Table of Contents
- 1. Introduction
- 1.1. Research Scope
- 1.2. Market Segmentation
- 1.3. Research Methodology
- 1.4. Definitions and Assumptions
- 2. Executive Summary
- 2.1. Introduction
- 3. Market Dynamics
- 3.1. Introduction
- 3.2. Market Drivers
- 3.2.1. 4.; Increasing Investments in Water Treatment by Developing Countries4.; Growing Demand for the Various End-Use Sectors
- 3.3. Market Restrains
- 3.3.1. 4.; Availability of Cheap and Alternative Pumps
- 3.4. Market Trends
- 3.4.1. Fluoropolymer is Expected to Become a Significant Segment
- 4. Market Factor Analysis
- 4.1. Porters Five Forces
- 4.2. Supply/Value Chain
- 4.3. PESTEL analysis
- 4.4. Market Entropy
- 4.5. Patent/Trademark Analysis
- 5. Global Solar Backsheet Industry Analysis, Insights and Forecast, 2019-2031
- 5.1. Market Analysis, Insights and Forecast - by Types
- 5.1.1. Fluoropolymer
- 5.1.2. Non-fluoropolymer
- 5.2. Market Analysis, Insights and Forecast - by Region
- 5.2.1. North America
- 5.2.2. Europe
- 5.2.3. Asia Pacific
- 5.2.4. South America
- 5.2.5. Middle East and Africa
- 5.1. Market Analysis, Insights and Forecast - by Types
- 6. North America Solar Backsheet Industry Analysis, Insights and Forecast, 2019-2031
- 6.1. Market Analysis, Insights and Forecast - by Types
- 6.1.1. Fluoropolymer
- 6.1.2. Non-fluoropolymer
- 6.1. Market Analysis, Insights and Forecast - by Types
- 7. Europe Solar Backsheet Industry Analysis, Insights and Forecast, 2019-2031
- 7.1. Market Analysis, Insights and Forecast - by Types
- 7.1.1. Fluoropolymer
- 7.1.2. Non-fluoropolymer
- 7.1. Market Analysis, Insights and Forecast - by Types
- 8. Asia Pacific Solar Backsheet Industry Analysis, Insights and Forecast, 2019-2031
- 8.1. Market Analysis, Insights and Forecast - by Types
- 8.1.1. Fluoropolymer
- 8.1.2. Non-fluoropolymer
- 8.1. Market Analysis, Insights and Forecast - by Types
- 9. South America Solar Backsheet Industry Analysis, Insights and Forecast, 2019-2031
- 9.1. Market Analysis, Insights and Forecast - by Types
- 9.1.1. Fluoropolymer
- 9.1.2. Non-fluoropolymer
- 9.1. Market Analysis, Insights and Forecast - by Types
- 10. Middle East and Africa Solar Backsheet Industry Analysis, Insights and Forecast, 2019-2031
- 10.1. Market Analysis, Insights and Forecast - by Types
- 10.1.1. Fluoropolymer
- 10.1.2. Non-fluoropolymer
- 10.1. Market Analysis, Insights and Forecast - by Types
- 11. North America Solar Backsheet Industry Analysis, Insights and Forecast, 2019-2031
- 11.1. Market Analysis, Insights and Forecast - By Country/Sub-region
- 11.1.1 United States
- 11.1.2 Canada
- 11.1.3 Mexico
- 12. Europe Solar Backsheet Industry Analysis, Insights and Forecast, 2019-2031
- 12.1. Market Analysis, Insights and Forecast - By Country/Sub-region
- 12.1.1 Germany
- 12.1.2 United Kingdom
- 12.1.3 France
- 12.1.4 Spain
- 12.1.5 Italy
- 12.1.6 Spain
- 12.1.7 Belgium
- 12.1.8 Netherland
- 12.1.9 Nordics
- 12.1.10 Rest of Europe
- 13. Asia Pacific Solar Backsheet Industry Analysis, Insights and Forecast, 2019-2031
- 13.1. Market Analysis, Insights and Forecast - By Country/Sub-region
- 13.1.1 China
- 13.1.2 Japan
- 13.1.3 India
- 13.1.4 South Korea
- 13.1.5 Southeast Asia
- 13.1.6 Australia
- 13.1.7 Indonesia
- 13.1.8 Phillipes
- 13.1.9 Singapore
- 13.1.10 Thailandc
- 13.1.11 Rest of Asia Pacific
- 14. South America Solar Backsheet Industry Analysis, Insights and Forecast, 2019-2031
- 14.1. Market Analysis, Insights and Forecast - By Country/Sub-region
- 14.1.1 Brazil
- 14.1.2 Argentina
- 14.1.3 Peru
- 14.1.4 Chile
- 14.1.5 Colombia
- 14.1.6 Ecuador
- 14.1.7 Venezuela
- 14.1.8 Rest of South America
- 15. North America Solar Backsheet Industry Analysis, Insights and Forecast, 2019-2031
- 15.1. Market Analysis, Insights and Forecast - By Country/Sub-region
- 15.1.1 United States
- 15.1.2 Canada
- 15.1.3 Mexico
- 16. MEA Solar Backsheet Industry Analysis, Insights and Forecast, 2019-2031
- 16.1. Market Analysis, Insights and Forecast - By Country/Sub-region
- 16.1.1 United Arab Emirates
- 16.1.2 Saudi Arabia
- 16.1.3 South Africa
- 16.1.4 Rest of Middle East and Africa
- 17. Competitive Analysis
- 17.1. Global Market Share Analysis 2024
- 17.2. Company Profiles
- 17.2.1 Isovoltaic AG
- 17.2.1.1. Overview
- 17.2.1.2. Products
- 17.2.1.3. SWOT Analysis
- 17.2.1.4. Recent Developments
- 17.2.1.5. Financials (Based on Availability)
- 17.2.2 Arkema SA
- 17.2.2.1. Overview
- 17.2.2.2. Products
- 17.2.2.3. SWOT Analysis
- 17.2.2.4. Recent Developments
- 17.2.2.5. Financials (Based on Availability)
- 17.2.3 Toyo Aluminium KK
- 17.2.3.1. Overview
- 17.2.3.2. Products
- 17.2.3.3. SWOT Analysis
- 17.2.3.4. Recent Developments
- 17.2.3.5. Financials (Based on Availability)
- 17.2.4 DuPont de Nemours Inc
- 17.2.4.1. Overview
- 17.2.4.2. Products
- 17.2.4.3. SWOT Analysis
- 17.2.4.4. Recent Developments
- 17.2.4.5. Financials (Based on Availability)
- 17.2.5 Taiflex Scientific Co Ltd
- 17.2.5.1. Overview
- 17.2.5.2. Products
- 17.2.5.3. SWOT Analysis
- 17.2.5.4. Recent Developments
- 17.2.5.5. Financials (Based on Availability)
- 17.2.6 Targray Technology International Inc *List Not Exhaustive
- 17.2.6.1. Overview
- 17.2.6.2. Products
- 17.2.6.3. SWOT Analysis
- 17.2.6.4. Recent Developments
- 17.2.6.5. Financials (Based on Availability)
- 17.2.7 Coveme SpA
- 17.2.7.1. Overview
- 17.2.7.2. Products
- 17.2.7.3. SWOT Analysis
- 17.2.7.4. Recent Developments
- 17.2.7.5. Financials (Based on Availability)
- 17.2.8 3M Co
- 17.2.8.1. Overview
- 17.2.8.2. Products
- 17.2.8.3. SWOT Analysis
- 17.2.8.4. Recent Developments
- 17.2.8.5. Financials (Based on Availability)
- 17.2.9 Krempel GmbH
- 17.2.9.1. Overview
- 17.2.9.2. Products
- 17.2.9.3. SWOT Analysis
- 17.2.9.4. Recent Developments
- 17.2.9.5. Financials (Based on Availability)
- 17.2.10 Madico Inc
- 17.2.10.1. Overview
- 17.2.10.2. Products
- 17.2.10.3. SWOT Analysis
- 17.2.10.4. Recent Developments
- 17.2.10.5. Financials (Based on Availability)
- 17.2.1 Isovoltaic AG
List of Figures
- Figure 1: Global Solar Backsheet Industry Revenue Breakdown (Million, %) by Region 2024 & 2032
- Figure 2: Global Solar Backsheet Industry Volume Breakdown (Gigawatt, %) by Region 2024 & 2032
- Figure 3: North America Solar Backsheet Industry Revenue (Million), by Country 2024 & 2032
- Figure 4: North America Solar Backsheet Industry Volume (Gigawatt), by Country 2024 & 2032
- Figure 5: North America Solar Backsheet Industry Revenue Share (%), by Country 2024 & 2032
- Figure 6: North America Solar Backsheet Industry Volume Share (%), by Country 2024 & 2032
- Figure 7: Europe Solar Backsheet Industry Revenue (Million), by Country 2024 & 2032
- Figure 8: Europe Solar Backsheet Industry Volume (Gigawatt), by Country 2024 & 2032
- Figure 9: Europe Solar Backsheet Industry Revenue Share (%), by Country 2024 & 2032
- Figure 10: Europe Solar Backsheet Industry Volume Share (%), by Country 2024 & 2032
- Figure 11: Asia Pacific Solar Backsheet Industry Revenue (Million), by Country 2024 & 2032
- Figure 12: Asia Pacific Solar Backsheet Industry Volume (Gigawatt), by Country 2024 & 2032
- Figure 13: Asia Pacific Solar Backsheet Industry Revenue Share (%), by Country 2024 & 2032
- Figure 14: Asia Pacific Solar Backsheet Industry Volume Share (%), by Country 2024 & 2032
- Figure 15: South America Solar Backsheet Industry Revenue (Million), by Country 2024 & 2032
- Figure 16: South America Solar Backsheet Industry Volume (Gigawatt), by Country 2024 & 2032
- Figure 17: South America Solar Backsheet Industry Revenue Share (%), by Country 2024 & 2032
- Figure 18: South America Solar Backsheet Industry Volume Share (%), by Country 2024 & 2032
- Figure 19: North America Solar Backsheet Industry Revenue (Million), by Country 2024 & 2032
- Figure 20: North America Solar Backsheet Industry Volume (Gigawatt), by Country 2024 & 2032
- Figure 21: North America Solar Backsheet Industry Revenue Share (%), by Country 2024 & 2032
- Figure 22: North America Solar Backsheet Industry Volume Share (%), by Country 2024 & 2032
- Figure 23: MEA Solar Backsheet Industry Revenue (Million), by Country 2024 & 2032
- Figure 24: MEA Solar Backsheet Industry Volume (Gigawatt), by Country 2024 & 2032
- Figure 25: MEA Solar Backsheet Industry Revenue Share (%), by Country 2024 & 2032
- Figure 26: MEA Solar Backsheet Industry Volume Share (%), by Country 2024 & 2032
- Figure 27: North America Solar Backsheet Industry Revenue (Million), by Types 2024 & 2032
- Figure 28: North America Solar Backsheet Industry Volume (Gigawatt), by Types 2024 & 2032
- Figure 29: North America Solar Backsheet Industry Revenue Share (%), by Types 2024 & 2032
- Figure 30: North America Solar Backsheet Industry Volume Share (%), by Types 2024 & 2032
- Figure 31: North America Solar Backsheet Industry Revenue (Million), by Country 2024 & 2032
- Figure 32: North America Solar Backsheet Industry Volume (Gigawatt), by Country 2024 & 2032
- Figure 33: North America Solar Backsheet Industry Revenue Share (%), by Country 2024 & 2032
- Figure 34: North America Solar Backsheet Industry Volume Share (%), by Country 2024 & 2032
- Figure 35: Europe Solar Backsheet Industry Revenue (Million), by Types 2024 & 2032
- Figure 36: Europe Solar Backsheet Industry Volume (Gigawatt), by Types 2024 & 2032
- Figure 37: Europe Solar Backsheet Industry Revenue Share (%), by Types 2024 & 2032
- Figure 38: Europe Solar Backsheet Industry Volume Share (%), by Types 2024 & 2032
- Figure 39: Europe Solar Backsheet Industry Revenue (Million), by Country 2024 & 2032
- Figure 40: Europe Solar Backsheet Industry Volume (Gigawatt), by Country 2024 & 2032
- Figure 41: Europe Solar Backsheet Industry Revenue Share (%), by Country 2024 & 2032
- Figure 42: Europe Solar Backsheet Industry Volume Share (%), by Country 2024 & 2032
- Figure 43: Asia Pacific Solar Backsheet Industry Revenue (Million), by Types 2024 & 2032
- Figure 44: Asia Pacific Solar Backsheet Industry Volume (Gigawatt), by Types 2024 & 2032
- Figure 45: Asia Pacific Solar Backsheet Industry Revenue Share (%), by Types 2024 & 2032
- Figure 46: Asia Pacific Solar Backsheet Industry Volume Share (%), by Types 2024 & 2032
- Figure 47: Asia Pacific Solar Backsheet Industry Revenue (Million), by Country 2024 & 2032
- Figure 48: Asia Pacific Solar Backsheet Industry Volume (Gigawatt), by Country 2024 & 2032
- Figure 49: Asia Pacific Solar Backsheet Industry Revenue Share (%), by Country 2024 & 2032
- Figure 50: Asia Pacific Solar Backsheet Industry Volume Share (%), by Country 2024 & 2032
- Figure 51: South America Solar Backsheet Industry Revenue (Million), by Types 2024 & 2032
- Figure 52: South America Solar Backsheet Industry Volume (Gigawatt), by Types 2024 & 2032
- Figure 53: South America Solar Backsheet Industry Revenue Share (%), by Types 2024 & 2032
- Figure 54: South America Solar Backsheet Industry Volume Share (%), by Types 2024 & 2032
- Figure 55: South America Solar Backsheet Industry Revenue (Million), by Country 2024 & 2032
- Figure 56: South America Solar Backsheet Industry Volume (Gigawatt), by Country 2024 & 2032
- Figure 57: South America Solar Backsheet Industry Revenue Share (%), by Country 2024 & 2032
- Figure 58: South America Solar Backsheet Industry Volume Share (%), by Country 2024 & 2032
- Figure 59: Middle East and Africa Solar Backsheet Industry Revenue (Million), by Types 2024 & 2032
- Figure 60: Middle East and Africa Solar Backsheet Industry Volume (Gigawatt), by Types 2024 & 2032
- Figure 61: Middle East and Africa Solar Backsheet Industry Revenue Share (%), by Types 2024 & 2032
- Figure 62: Middle East and Africa Solar Backsheet Industry Volume Share (%), by Types 2024 & 2032
- Figure 63: Middle East and Africa Solar Backsheet Industry Revenue (Million), by Country 2024 & 2032
- Figure 64: Middle East and Africa Solar Backsheet Industry Volume (Gigawatt), by Country 2024 & 2032
- Figure 65: Middle East and Africa Solar Backsheet Industry Revenue Share (%), by Country 2024 & 2032
- Figure 66: Middle East and Africa Solar Backsheet Industry Volume Share (%), by Country 2024 & 2032
List of Tables
- Table 1: Global Solar Backsheet Industry Revenue Million Forecast, by Region 2019 & 2032
- Table 2: Global Solar Backsheet Industry Volume Gigawatt Forecast, by Region 2019 & 2032
- Table 3: Global Solar Backsheet Industry Revenue Million Forecast, by Types 2019 & 2032
- Table 4: Global Solar Backsheet Industry Volume Gigawatt Forecast, by Types 2019 & 2032
- Table 5: Global Solar Backsheet Industry Revenue Million Forecast, by Region 2019 & 2032
- Table 6: Global Solar Backsheet Industry Volume Gigawatt Forecast, by Region 2019 & 2032
- Table 7: Global Solar Backsheet Industry Revenue Million Forecast, by Country 2019 & 2032
- Table 8: Global Solar Backsheet Industry Volume Gigawatt Forecast, by Country 2019 & 2032
- Table 9: United States Solar Backsheet Industry Revenue (Million) Forecast, by Application 2019 & 2032
- Table 10: United States Solar Backsheet Industry Volume (Gigawatt) Forecast, by Application 2019 & 2032
- Table 11: Canada Solar Backsheet Industry Revenue (Million) Forecast, by Application 2019 & 2032
- Table 12: Canada Solar Backsheet Industry Volume (Gigawatt) Forecast, by Application 2019 & 2032
- Table 13: Mexico Solar Backsheet Industry Revenue (Million) Forecast, by Application 2019 & 2032
- Table 14: Mexico Solar Backsheet Industry Volume (Gigawatt) Forecast, by Application 2019 & 2032
- Table 15: Global Solar Backsheet Industry Revenue Million Forecast, by Country 2019 & 2032
- Table 16: Global Solar Backsheet Industry Volume Gigawatt Forecast, by Country 2019 & 2032
- Table 17: Germany Solar Backsheet Industry Revenue (Million) Forecast, by Application 2019 & 2032
- Table 18: Germany Solar Backsheet Industry Volume (Gigawatt) Forecast, by Application 2019 & 2032
- Table 19: United Kingdom Solar Backsheet Industry Revenue (Million) Forecast, by Application 2019 & 2032
- Table 20: United Kingdom Solar Backsheet Industry Volume (Gigawatt) Forecast, by Application 2019 & 2032
- Table 21: France Solar Backsheet Industry Revenue (Million) Forecast, by Application 2019 & 2032
- Table 22: France Solar Backsheet Industry Volume (Gigawatt) Forecast, by Application 2019 & 2032
- Table 23: Spain Solar Backsheet Industry Revenue (Million) Forecast, by Application 2019 & 2032
- Table 24: Spain Solar Backsheet Industry Volume (Gigawatt) Forecast, by Application 2019 & 2032
- Table 25: Italy Solar Backsheet Industry Revenue (Million) Forecast, by Application 2019 & 2032
- Table 26: Italy Solar Backsheet Industry Volume (Gigawatt) Forecast, by Application 2019 & 2032
- Table 27: Spain Solar Backsheet Industry Revenue (Million) Forecast, by Application 2019 & 2032
- Table 28: Spain Solar Backsheet Industry Volume (Gigawatt) Forecast, by Application 2019 & 2032
- Table 29: Belgium Solar Backsheet Industry Revenue (Million) Forecast, by Application 2019 & 2032
- Table 30: Belgium Solar Backsheet Industry Volume (Gigawatt) Forecast, by Application 2019 & 2032
- Table 31: Netherland Solar Backsheet Industry Revenue (Million) Forecast, by Application 2019 & 2032
- Table 32: Netherland Solar Backsheet Industry Volume (Gigawatt) Forecast, by Application 2019 & 2032
- Table 33: Nordics Solar Backsheet Industry Revenue (Million) Forecast, by Application 2019 & 2032
- Table 34: Nordics Solar Backsheet Industry Volume (Gigawatt) Forecast, by Application 2019 & 2032
- Table 35: Rest of Europe Solar Backsheet Industry Revenue (Million) Forecast, by Application 2019 & 2032
- Table 36: Rest of Europe Solar Backsheet Industry Volume (Gigawatt) Forecast, by Application 2019 & 2032
- Table 37: Global Solar Backsheet Industry Revenue Million Forecast, by Country 2019 & 2032
- Table 38: Global Solar Backsheet Industry Volume Gigawatt Forecast, by Country 2019 & 2032
- Table 39: China Solar Backsheet Industry Revenue (Million) Forecast, by Application 2019 & 2032
- Table 40: China Solar Backsheet Industry Volume (Gigawatt) Forecast, by Application 2019 & 2032
- Table 41: Japan Solar Backsheet Industry Revenue (Million) Forecast, by Application 2019 & 2032
- Table 42: Japan Solar Backsheet Industry Volume (Gigawatt) Forecast, by Application 2019 & 2032
- Table 43: India Solar Backsheet Industry Revenue (Million) Forecast, by Application 2019 & 2032
- Table 44: India Solar Backsheet Industry Volume (Gigawatt) Forecast, by Application 2019 & 2032
- Table 45: South Korea Solar Backsheet Industry Revenue (Million) Forecast, by Application 2019 & 2032
- Table 46: South Korea Solar Backsheet Industry Volume (Gigawatt) Forecast, by Application 2019 & 2032
- Table 47: Southeast Asia Solar Backsheet Industry Revenue (Million) Forecast, by Application 2019 & 2032
- Table 48: Southeast Asia Solar Backsheet Industry Volume (Gigawatt) Forecast, by Application 2019 & 2032
- Table 49: Australia Solar Backsheet Industry Revenue (Million) Forecast, by Application 2019 & 2032
- Table 50: Australia Solar Backsheet Industry Volume (Gigawatt) Forecast, by Application 2019 & 2032
- Table 51: Indonesia Solar Backsheet Industry Revenue (Million) Forecast, by Application 2019 & 2032
- Table 52: Indonesia Solar Backsheet Industry Volume (Gigawatt) Forecast, by Application 2019 & 2032
- Table 53: Phillipes Solar Backsheet Industry Revenue (Million) Forecast, by Application 2019 & 2032
- Table 54: Phillipes Solar Backsheet Industry Volume (Gigawatt) Forecast, by Application 2019 & 2032
- Table 55: Singapore Solar Backsheet Industry Revenue (Million) Forecast, by Application 2019 & 2032
- Table 56: Singapore Solar Backsheet Industry Volume (Gigawatt) Forecast, by Application 2019 & 2032
- Table 57: Thailandc Solar Backsheet Industry Revenue (Million) Forecast, by Application 2019 & 2032
- Table 58: Thailandc Solar Backsheet Industry Volume (Gigawatt) Forecast, by Application 2019 & 2032
- Table 59: Rest of Asia Pacific Solar Backsheet Industry Revenue (Million) Forecast, by Application 2019 & 2032
- Table 60: Rest of Asia Pacific Solar Backsheet Industry Volume (Gigawatt) Forecast, by Application 2019 & 2032
- Table 61: Global Solar Backsheet Industry Revenue Million Forecast, by Country 2019 & 2032
- Table 62: Global Solar Backsheet Industry Volume Gigawatt Forecast, by Country 2019 & 2032
- Table 63: Brazil Solar Backsheet Industry Revenue (Million) Forecast, by Application 2019 & 2032
- Table 64: Brazil Solar Backsheet Industry Volume (Gigawatt) Forecast, by Application 2019 & 2032
- Table 65: Argentina Solar Backsheet Industry Revenue (Million) Forecast, by Application 2019 & 2032
- Table 66: Argentina Solar Backsheet Industry Volume (Gigawatt) Forecast, by Application 2019 & 2032
- Table 67: Peru Solar Backsheet Industry Revenue (Million) Forecast, by Application 2019 & 2032
- Table 68: Peru Solar Backsheet Industry Volume (Gigawatt) Forecast, by Application 2019 & 2032
- Table 69: Chile Solar Backsheet Industry Revenue (Million) Forecast, by Application 2019 & 2032
- Table 70: Chile Solar Backsheet Industry Volume (Gigawatt) Forecast, by Application 2019 & 2032
- Table 71: Colombia Solar Backsheet Industry Revenue (Million) Forecast, by Application 2019 & 2032
- Table 72: Colombia Solar Backsheet Industry Volume (Gigawatt) Forecast, by Application 2019 & 2032
- Table 73: Ecuador Solar Backsheet Industry Revenue (Million) Forecast, by Application 2019 & 2032
- Table 74: Ecuador Solar Backsheet Industry Volume (Gigawatt) Forecast, by Application 2019 & 2032
- Table 75: Venezuela Solar Backsheet Industry Revenue (Million) Forecast, by Application 2019 & 2032
- Table 76: Venezuela Solar Backsheet Industry Volume (Gigawatt) Forecast, by Application 2019 & 2032
- Table 77: Rest of South America Solar Backsheet Industry Revenue (Million) Forecast, by Application 2019 & 2032
- Table 78: Rest of South America Solar Backsheet Industry Volume (Gigawatt) Forecast, by Application 2019 & 2032
- Table 79: Global Solar Backsheet Industry Revenue Million Forecast, by Country 2019 & 2032
- Table 80: Global Solar Backsheet Industry Volume Gigawatt Forecast, by Country 2019 & 2032
- Table 81: United States Solar Backsheet Industry Revenue (Million) Forecast, by Application 2019 & 2032
- Table 82: United States Solar Backsheet Industry Volume (Gigawatt) Forecast, by Application 2019 & 2032
- Table 83: Canada Solar Backsheet Industry Revenue (Million) Forecast, by Application 2019 & 2032
- Table 84: Canada Solar Backsheet Industry Volume (Gigawatt) Forecast, by Application 2019 & 2032
- Table 85: Mexico Solar Backsheet Industry Revenue (Million) Forecast, by Application 2019 & 2032
- Table 86: Mexico Solar Backsheet Industry Volume (Gigawatt) Forecast, by Application 2019 & 2032
- Table 87: Global Solar Backsheet Industry Revenue Million Forecast, by Country 2019 & 2032
- Table 88: Global Solar Backsheet Industry Volume Gigawatt Forecast, by Country 2019 & 2032
- Table 89: United Arab Emirates Solar Backsheet Industry Revenue (Million) Forecast, by Application 2019 & 2032
- Table 90: United Arab Emirates Solar Backsheet Industry Volume (Gigawatt) Forecast, by Application 2019 & 2032
- Table 91: Saudi Arabia Solar Backsheet Industry Revenue (Million) Forecast, by Application 2019 & 2032
- Table 92: Saudi Arabia Solar Backsheet Industry Volume (Gigawatt) Forecast, by Application 2019 & 2032
- Table 93: South Africa Solar Backsheet Industry Revenue (Million) Forecast, by Application 2019 & 2032
- Table 94: South Africa Solar Backsheet Industry Volume (Gigawatt) Forecast, by Application 2019 & 2032
- Table 95: Rest of Middle East and Africa Solar Backsheet Industry Revenue (Million) Forecast, by Application 2019 & 2032
- Table 96: Rest of Middle East and Africa Solar Backsheet Industry Volume (Gigawatt) Forecast, by Application 2019 & 2032
- Table 97: Global Solar Backsheet Industry Revenue Million Forecast, by Types 2019 & 2032
- Table 98: Global Solar Backsheet Industry Volume Gigawatt Forecast, by Types 2019 & 2032
- Table 99: Global Solar Backsheet Industry Revenue Million Forecast, by Country 2019 & 2032
- Table 100: Global Solar Backsheet Industry Volume Gigawatt Forecast, by Country 2019 & 2032
- Table 101: Global Solar Backsheet Industry Revenue Million Forecast, by Types 2019 & 2032
- Table 102: Global Solar Backsheet Industry Volume Gigawatt Forecast, by Types 2019 & 2032
- Table 103: Global Solar Backsheet Industry Revenue Million Forecast, by Country 2019 & 2032
- Table 104: Global Solar Backsheet Industry Volume Gigawatt Forecast, by Country 2019 & 2032
- Table 105: Global Solar Backsheet Industry Revenue Million Forecast, by Types 2019 & 2032
- Table 106: Global Solar Backsheet Industry Volume Gigawatt Forecast, by Types 2019 & 2032
- Table 107: Global Solar Backsheet Industry Revenue Million Forecast, by Country 2019 & 2032
- Table 108: Global Solar Backsheet Industry Volume Gigawatt Forecast, by Country 2019 & 2032
- Table 109: Global Solar Backsheet Industry Revenue Million Forecast, by Types 2019 & 2032
- Table 110: Global Solar Backsheet Industry Volume Gigawatt Forecast, by Types 2019 & 2032
- Table 111: Global Solar Backsheet Industry Revenue Million Forecast, by Country 2019 & 2032
- Table 112: Global Solar Backsheet Industry Volume Gigawatt Forecast, by Country 2019 & 2032
- Table 113: Global Solar Backsheet Industry Revenue Million Forecast, by Types 2019 & 2032
- Table 114: Global Solar Backsheet Industry Volume Gigawatt Forecast, by Types 2019 & 2032
- Table 115: Global Solar Backsheet Industry Revenue Million Forecast, by Country 2019 & 2032
- Table 116: Global Solar Backsheet Industry Volume Gigawatt Forecast, by Country 2019 & 2032
Frequently Asked Questions
1. What is the projected Compound Annual Growth Rate (CAGR) of the Solar Backsheet Industry?
The projected CAGR is approximately > 15.50%.
2. Which companies are prominent players in the Solar Backsheet Industry?
Key companies in the market include Isovoltaic AG, Arkema SA, Toyo Aluminium KK, DuPont de Nemours Inc, Taiflex Scientific Co Ltd, Targray Technology International Inc *List Not Exhaustive, Coveme SpA, 3M Co, Krempel GmbH, Madico Inc.
3. What are the main segments of the Solar Backsheet Industry?
The market segments include Types.
4. Can you provide details about the market size?
The market size is estimated to be USD 2200 Million as of 2022.
5. What are some drivers contributing to market growth?
4.; Increasing Investments in Water Treatment by Developing Countries4.; Growing Demand for the Various End-Use Sectors.
6. What are the notable trends driving market growth?
Fluoropolymer is Expected to Become a Significant Segment.
7. Are there any restraints impacting market growth?
4.; Availability of Cheap and Alternative Pumps.
8. Can you provide examples of recent developments in the market?
In March 2021, Royal DSM, a global science-based company in health, nutrition, and sustainable living, agreed to sell its Advanced Solar business involved in backsheet products to the Worthen Industries Inc.
9. What pricing options are available for accessing the report?
Pricing options include single-user, multi-user, and enterprise licenses priced at USD 4750, USD 5250, and USD 8750 respectively.
10. Is the market size provided in terms of value or volume?
The market size is provided in terms of value, measured in Million and volume, measured in Gigawatt.
11. Are there any specific market keywords associated with the report?
Yes, the market keyword associated with the report is "Solar Backsheet Industry," which aids in identifying and referencing the specific market segment covered.
12. How do I determine which pricing option suits my needs best?
The pricing options vary based on user requirements and access needs. Individual users may opt for single-user licenses, while businesses requiring broader access may choose multi-user or enterprise licenses for cost-effective access to the report.
13. Are there any additional resources or data provided in the Solar Backsheet Industry report?
While the report offers comprehensive insights, it's advisable to review the specific contents or supplementary materials provided to ascertain if additional resources or data are available.
14. How can I stay updated on further developments or reports in the Solar Backsheet Industry?
To stay informed about further developments, trends, and reports in the Solar Backsheet Industry, consider subscribing to industry newsletters, following relevant companies and organizations, or regularly checking reputable industry news sources and publications.
Methodology
Step 1 - Identification of Relevant Samples Size from Population Database


Step 2 - Approaches for Defining Global Market Size (Value, Volume* & Price*)

Note*: In applicable scenarios
Step 3 - Data Sources
Primary Research
- Web Analytics
- Survey Reports
- Research Institute
- Latest Research Reports
- Opinion Leaders
Secondary Research
- Annual Reports
- White Paper
- Latest Press Release
- Industry Association
- Paid Database
- Investor Presentations

Step 4 - Data Triangulation
Involves using different sources of information in order to increase the validity of a study
These sources are likely to be stakeholders in a program - participants, other researchers, program staff, other community members, and so on.
Then we put all data in single framework & apply various statistical tools to find out the dynamic on the market.
During the analysis stage, feedback from the stakeholder groups would be compared to determine areas of agreement as well as areas of divergence


