

Key Insights
The global solar photovoltaic (PV) glass market is poised for significant expansion, driven by escalating demand for renewable energy and favorable government policies. The market, valued at approximately $17.09 billion in 2025, is projected to achieve a compound annual growth rate (CAGR) of 31.2% from 2025 to 2033. This growth is underpinned by advancements in solar cell efficiency, particularly in crystalline silicon and thin-film technologies, which are reducing costs and enhancing performance. Increased adoption of solar PV systems across residential and non-residential sectors, especially in emerging economies within the Asia Pacific region, is a key demand driver. The market benefits from diverse applications, including anti-reflective (AR) coated, tempered, and transparent conductive oxide (TCO) coated glass, contributing to its robust diversification.
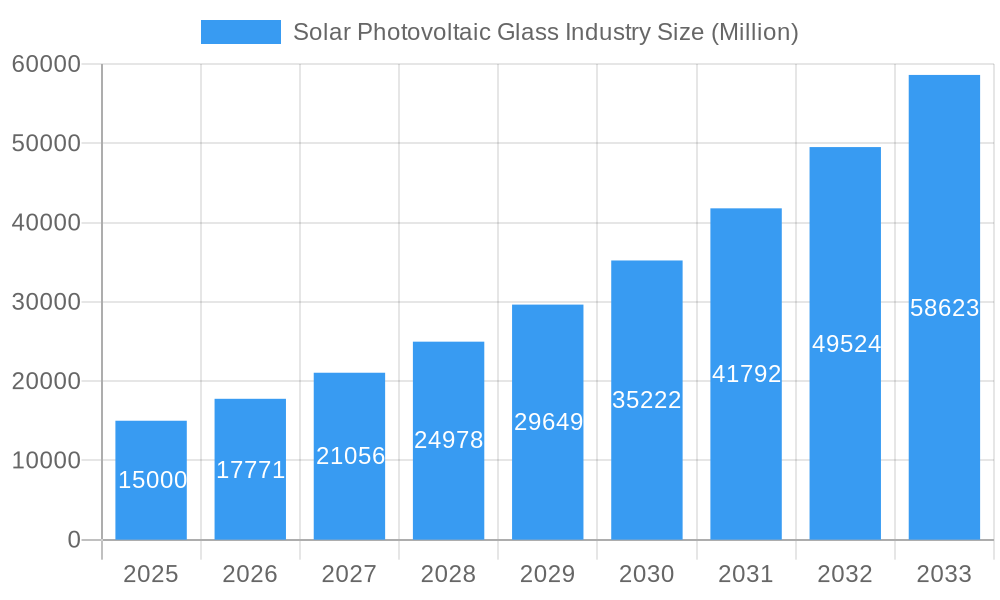
Solar Photovoltaic Glass Industry Market Size (In Billion)
Market segmentation highlights substantial growth opportunities across various solar PV glass types. AR-coated glass, for its superior light transmission, and tempered glass, for its enhanced durability, are leading growth segments. Technological progress in crystalline silicon and thin-film technologies continues to fuel adoption. Geographically, the Asia Pacific region, led by China and India, is a primary market due to extensive renewable energy initiatives and solar installations. North America and Europe are also significant contributors, albeit potentially at a more moderate growth rate compared to Asia Pacific. Leading industry players, including Nippon Sheet Glass, Saint-Gobain, and Xinyi Solar, are strategically investing in R&D, capacity expansion, and global market presence to capitalize on this growth trajectory. The intensifying focus on sustainability and the imperative to address climate change are expected to further accelerate the solar PV glass market's substantial expansion.
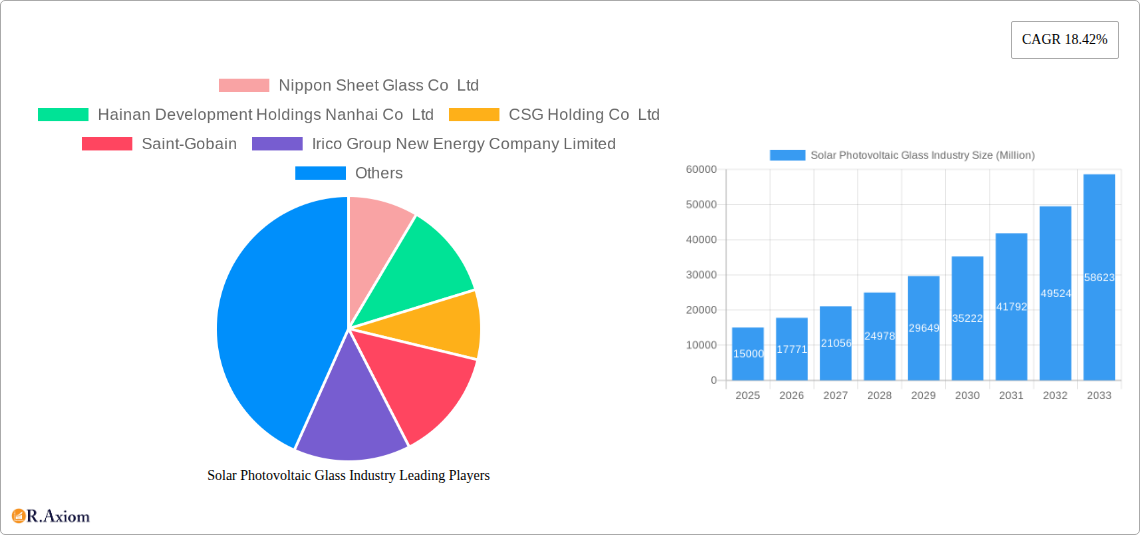
Solar Photovoltaic Glass Industry Company Market Share
Solar Photovoltaic Glass Industry: A Comprehensive Market Report (2019-2033)
This comprehensive report provides an in-depth analysis of the global solar photovoltaic (PV) glass industry, covering market size, growth projections, key players, technological advancements, and future trends. The study period spans from 2019 to 2033, with 2025 serving as both the base and estimated year. The report offers invaluable insights for industry stakeholders, including manufacturers, investors, and researchers, seeking to understand and navigate this dynamic market. The market is valued at xx Million in 2025 and is projected to reach xx Million by 2033, exhibiting a CAGR of xx%.
Solar Photovoltaic Glass Industry Market Concentration & Innovation
The solar photovoltaic glass market exhibits a moderately concentrated structure, with several major players commanding significant market share. Key players include Nippon Sheet Glass Co Ltd, Hainan Development Holdings Nanhai Co Ltd, CSG Holding Co Ltd, Saint-Gobain, Irico Group New Energy Company Limited, Sisecam, Jinjing (Group) Co Ltd, Taiwan Glass Ind Corp, Onyx Solar Group LLC, Guardian Industries Holdings, Flat Glass Group Co Ltd, Xinyi Solar Holdings Limited, Kaneka Energy Management Solutions, AGC Inc, and Borosil Limited. However, the presence of numerous smaller players indicates a competitive landscape.
Market share data for 2025 suggests that the top five players collectively hold approximately xx% of the global market. The remaining share is distributed among a diverse group of regional and specialized manufacturers. Innovation in the sector is driven primarily by the need to enhance energy efficiency, reduce production costs, and improve product durability. This translates into ongoing research and development efforts focused on advanced coatings, new glass compositions, and improved manufacturing processes. Regulatory frameworks, particularly those promoting renewable energy adoption, significantly influence market growth. Stringent environmental regulations drive the adoption of eco-friendly manufacturing practices. Substitutes, such as plastic-based alternatives, pose a challenge, yet their lower performance and durability often limit their adoption. End-user trends favor increased adoption of high-efficiency solar panels, driving demand for superior PV glass.
Mergers and acquisitions (M&A) activity is noteworthy. Significant deals, such as Borosil Renewables Limited’s acquisition of Interfloat Corporation and Glasmanufaktur Brandenburg (GMB) in October 2023, demonstrate strategic consolidation in the industry. The total value of M&A deals in the solar PV glass sector in 2024 reached an estimated xx Million.
Solar Photovoltaic Glass Industry Industry Trends & Insights
The solar photovoltaic glass market is experiencing robust growth, fueled by the global push towards renewable energy and the increasing adoption of solar power across residential, commercial, and industrial sectors. This growth is further accelerated by supportive government policies, decreasing solar panel costs, and technological advancements leading to higher efficiency and durability of solar PV systems. The market is witnessing a significant shift toward crystalline silicon technology, which dominates the market share with xx% in 2025. However, other technologies, such as thin-film solar cells, are also gaining traction due to their potential for cost reduction and flexible applications. Consumer preferences are leaning toward aesthetically pleasing and high-performance PV glass solutions, impacting the demand for AR-coated and tempered glass. Competitive dynamics are characterized by intense competition among established players and the emergence of innovative companies. The market is experiencing pricing pressures due to increasing supply and the need to offer competitive solutions.
Dominant Markets & Segments in Solar Photovoltaic Glass Industry
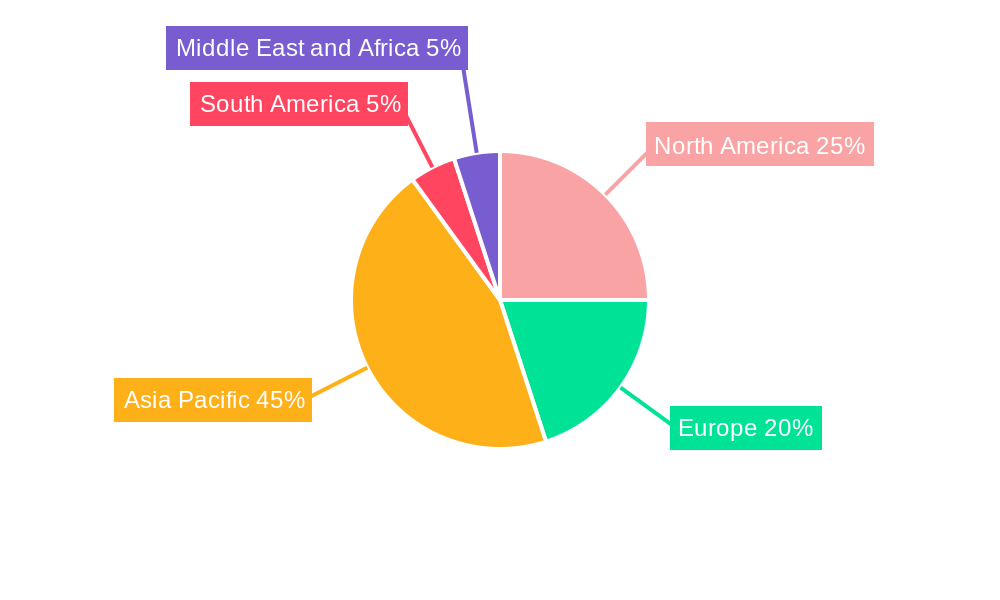
Leading Region/Country: Asia-Pacific currently dominates the global solar PV glass market, driven by strong demand from China and India, owing to significant government support for renewable energy initiatives and substantial investments in solar power infrastructure. Europe and North America also exhibit substantial growth, particularly driven by stringent environmental regulations and consumer awareness about sustainable energy.
Dominant Segment (By Type): Tempered glass and AR-coated glass represent the largest segments within the type classification, due to their enhanced durability and improved light transmission capabilities, respectively.
Dominant Segment (By Technology): Crystalline silicon technology overwhelmingly dominates the market, attributable to its high efficiency and established manufacturing infrastructure.
Dominant Segment (By Application): The non-residential segment holds a larger market share compared to the residential sector, driven primarily by large-scale solar power installations in utility-scale projects and commercial buildings.
Key Drivers:
- Economic policies: Government incentives, subsidies, and tax breaks for solar power installations are significant catalysts.
- Infrastructure development: Expansion of power grids and supportive infrastructure facilitates greater solar power adoption.
- Technological advancements: Improvements in solar panel efficiency and durability lead to increased demand for high-performance glass.
Solar Photovoltaic Glass Industry Product Developments
Recent product innovations focus on enhancing glass properties like light transmission, durability, and self-cleaning capabilities. Advanced coatings, like anti-reflective (AR) coatings and transparent conductive oxide (TCO) coatings, are becoming increasingly prevalent to improve energy efficiency. The market is also witnessing the emergence of new glass types with improved mechanical strength and thermal stability. These developments are driven by the need for long-lasting, high-efficiency solar panels that can withstand harsh environmental conditions. The market fit for these innovations is strong, driven by the increasing demand for high-performance and cost-effective solar power solutions.
Report Scope & Segmentation Analysis
This report segments the solar photovoltaic glass market by type (AR coated glass, tempered glass, TCO coated glass, other types), technology (crystalline silicon, cadmium telluride thin film, amorphous silicon solar, copper indium gallium diselenide (CIGS), other technologies), and application (residential, non-residential). Each segment is analyzed in detail, providing market size, growth projections, and competitive dynamics. For example, the AR coated glass segment is expected to witness substantial growth due to its ability to enhance light absorption, leading to higher energy efficiency. Similarly, the crystalline silicon technology segment continues to dominate due to its maturity and cost-effectiveness. The non-residential sector is projected to have a higher growth rate than the residential sector due to large-scale solar farm development.
Key Drivers of Solar Photovoltaic Glass Growth
The solar photovoltaic glass industry is experiencing substantial growth propelled by several key factors. Technological advancements, such as the development of higher-efficiency solar cells and improved glass coatings, are continuously enhancing the performance and cost-effectiveness of solar panels. Favorable government policies, including subsidies, tax incentives, and renewable energy targets, are strongly encouraging the widespread adoption of solar energy. Furthermore, increasing environmental concerns and the urgent need to reduce carbon emissions are driving the global shift towards sustainable energy solutions, boosting demand for solar PV glass.
Challenges in the Solar Photovoltaic Glass Industry Sector
The industry faces challenges including price volatility of raw materials (e.g., silica sand), supply chain disruptions that impact manufacturing efficiency and costs, and intense competition among manufacturers, leading to pricing pressures. Regulatory hurdles in certain markets can also hinder market expansion. These challenges can significantly affect production costs and profitability, leading to fluctuations in market prices and potentially impacting the overall growth trajectory of the industry. The estimated impact of these challenges on market growth is a reduction of xx% in 2025.
Emerging Opportunities in Solar Photovoltaic Glass Industry
Emerging opportunities lie in the development and adoption of advanced glass technologies, like bifacial solar glass, which can absorb light from both sides, enhancing energy generation. The growth of the building-integrated photovoltaics (BIPV) market, where solar panels are incorporated directly into building materials, presents another significant opportunity. Expanding into new markets, particularly in developing economies with high solar irradiation and growing energy demands, also offers considerable potential. Finally, exploring innovative applications, such as solar-powered windows and transparent solar panels, represents significant areas for growth and innovation.
Leading Players in the Solar Photovoltaic Glass Industry Market
- Nippon Sheet Glass Co Ltd
- Hainan Development Holdings Nanhai Co Ltd
- CSG Holding Co Ltd
- Saint-Gobain
- Irico Group New Energy Company Limited
- Sisecam
- Jinjing (Group) Co Ltd
- Taiwan Glass Ind Corp
- Onyx Solar Group LLC
- Guardian Industries Holdings
- Flat Glass Group Co Ltd
- Xinyi Solar Holdings Limited
- Kaneka Energy Management Solutions
- AGC Inc
- Borosil Limited
Key Developments in Solar Photovoltaic Glass Industry
October 2023: Borosil Renewables Limited acquired an 86% stake in Interfloat Corporation and Glasmanufaktur Brandenburg (GMB), significantly increasing its European solar glass manufacturing capacity to 750 TPD from 450 TPD. This acquisition strengthens Borosil's market position and expands its geographical reach.
July 2023: AGC Flat Glass Ibérica, in collaboration with Helexia España, commissioned a 4,600-kilowatt photovoltaic plant for self-consumption, highlighting the potential of solar PV glass in large-scale projects and demonstrating commitment to sustainability.
Strategic Outlook for Solar Photovoltaic Glass Industry Market
The future of the solar photovoltaic glass industry looks promising, with sustained growth expected over the forecast period. Continued technological advancements, coupled with favorable government policies and increasing environmental awareness, will drive demand for high-performance solar glass. The expansion of renewable energy initiatives globally, coupled with the rising adoption of solar power across diverse applications, will create substantial growth opportunities. The industry is poised for further consolidation, with potential for strategic partnerships and acquisitions, shaping a more competitive yet innovative landscape.
Solar Photovoltaic Glass Industry Segmentation
-
1. Type
- 1.1. AR Coated Glass
- 1.2. Tempered Glass
- 1.3. TCO Coated Glass
- 1.4. Other Types
-
2. Technology
- 2.1. Crystalline Silicon
- 2.2. Cadmium Telluride Thin Film
- 2.3. Amorphous Silicon Solar
- 2.4. Copper Indium Gallium Diselenide (cigs)
- 2.5. Other Technologies
-
3. Application
- 3.1. Residential
-
3.2. Non-residential
- 3.2.1. Commercial
- 3.2.2. Industrial/institutional
- 3.2.3. Other Applications
Solar Photovoltaic Glass Industry Segmentation By Geography
-
1. Asia Pacific
- 1.1. China
- 1.2. India
- 1.3. Japan
- 1.4. South Korea
- 1.5. Rest of Asia Pacific
-
2. North America
- 2.1. United States
- 2.2. Canada
- 2.3. Mexico
-
3. Europe
- 3.1. Germany
- 3.2. United Kingdom
- 3.3. France
- 3.4. Italy
- 3.5. Rest of Europe
-
4. South America
- 4.1. Brazil
- 4.2. Argentina
- 4.3. Rest of South America
-
5. Middle East and Africa
- 5.1. Saudi Arabia
- 5.2. South Africa
- 5.3. Morocco
- 5.4. Rest of Middle East and Africa
Solar Photovoltaic Glass Industry Regional Market Share
Geographic Coverage of Solar Photovoltaic Glass Industry
Solar Photovoltaic Glass Industry REPORT HIGHLIGHTS
| Aspects | Details |
|---|---|
| Study Period | 2020-2034 |
| Base Year | 2025 |
| Estimated Year | 2026 |
| Forecast Period | 2026-2034 |
| Historical Period | 2020-2025 |
| Growth Rate | CAGR of 31.2% from 2020-2034 |
| Segmentation |
|
Table of Contents
- 1. Introduction
- 1.1. Research Scope
- 1.2. Market Segmentation
- 1.3. Research Objective
- 1.4. Definitions and Assumptions
- 2. Executive Summary
- 2.1. Market Snapshot
- 3. Market Dynamics
- 3.1. Market Drivers
- 3.2. Market Restrains
- 3.3. Market Trends
- 3.4. Market Opportunities
- 4. Market Factor Analysis
- 4.1. Porters Five Forces
- 4.1.1. Bargaining Power of Suppliers
- 4.1.2. Bargaining Power of Buyers
- 4.1.3. Threat of New Entrants
- 4.1.4. Threat of Substitutes
- 4.1.5. Competitive Rivalry
- 4.2. PESTEL analysis
- 4.3. BCG Analysis
- 4.3.1. Stars (High Growth, High Market Share)
- 4.3.2. Cash Cows (Low Growth, High Market Share)
- 4.3.3. Question Mark (High Growth, Low Market Share)
- 4.3.4. Dogs (Low Growth, Low Market Share)
- 4.4. Ansoff Matrix Analysis
- 4.5. Supply Chain Analysis
- 4.6. Regulatory Landscape
- 4.7. Current Market Potential and Opportunity Assessment (TAM–SAM–SOM Framework)
- 4.8. RAX Analyst Note
- 4.1. Porters Five Forces
- 5. Market Analysis, Insights and Forecast 2021-2033
- 5.1. Market Analysis, Insights and Forecast - by Type
- 5.1.1. AR Coated Glass
- 5.1.2. Tempered Glass
- 5.1.3. TCO Coated Glass
- 5.1.4. Other Types
- 5.2. Market Analysis, Insights and Forecast - by Technology
- 5.2.1. Crystalline Silicon
- 5.2.2. Cadmium Telluride Thin Film
- 5.2.3. Amorphous Silicon Solar
- 5.2.4. Copper Indium Gallium Diselenide (cigs)
- 5.2.5. Other Technologies
- 5.3. Market Analysis, Insights and Forecast - by Application
- 5.3.1. Residential
- 5.3.2. Non-residential
- 5.3.2.1. Commercial
- 5.3.2.2. Industrial/institutional
- 5.3.2.3. Other Applications
- 5.4. Market Analysis, Insights and Forecast - by Region
- 5.4.1. Asia Pacific
- 5.4.2. North America
- 5.4.3. Europe
- 5.4.4. South America
- 5.4.5. Middle East and Africa
- 5.1. Market Analysis, Insights and Forecast - by Type
- 6. Global Solar Photovoltaic Glass Industry Analysis, Insights and Forecast, 2021-2033
- 6.1. Market Analysis, Insights and Forecast - by Type
- 6.1.1. AR Coated Glass
- 6.1.2. Tempered Glass
- 6.1.3. TCO Coated Glass
- 6.1.4. Other Types
- 6.2. Market Analysis, Insights and Forecast - by Technology
- 6.2.1. Crystalline Silicon
- 6.2.2. Cadmium Telluride Thin Film
- 6.2.3. Amorphous Silicon Solar
- 6.2.4. Copper Indium Gallium Diselenide (cigs)
- 6.2.5. Other Technologies
- 6.3. Market Analysis, Insights and Forecast - by Application
- 6.3.1. Residential
- 6.3.2. Non-residential
- 6.3.2.1. Commercial
- 6.3.2.2. Industrial/institutional
- 6.3.2.3. Other Applications
- 6.1. Market Analysis, Insights and Forecast - by Type
- 7. Asia Pacific Solar Photovoltaic Glass Industry Analysis, Insights and Forecast, 2020-2032
- 7.1. Market Analysis, Insights and Forecast - by Type
- 7.1.1. AR Coated Glass
- 7.1.2. Tempered Glass
- 7.1.3. TCO Coated Glass
- 7.1.4. Other Types
- 7.2. Market Analysis, Insights and Forecast - by Technology
- 7.2.1. Crystalline Silicon
- 7.2.2. Cadmium Telluride Thin Film
- 7.2.3. Amorphous Silicon Solar
- 7.2.4. Copper Indium Gallium Diselenide (cigs)
- 7.2.5. Other Technologies
- 7.3. Market Analysis, Insights and Forecast - by Application
- 7.3.1. Residential
- 7.3.2. Non-residential
- 7.3.2.1. Commercial
- 7.3.2.2. Industrial/institutional
- 7.3.2.3. Other Applications
- 7.1. Market Analysis, Insights and Forecast - by Type
- 8. North America Solar Photovoltaic Glass Industry Analysis, Insights and Forecast, 2020-2032
- 8.1. Market Analysis, Insights and Forecast - by Type
- 8.1.1. AR Coated Glass
- 8.1.2. Tempered Glass
- 8.1.3. TCO Coated Glass
- 8.1.4. Other Types
- 8.2. Market Analysis, Insights and Forecast - by Technology
- 8.2.1. Crystalline Silicon
- 8.2.2. Cadmium Telluride Thin Film
- 8.2.3. Amorphous Silicon Solar
- 8.2.4. Copper Indium Gallium Diselenide (cigs)
- 8.2.5. Other Technologies
- 8.3. Market Analysis, Insights and Forecast - by Application
- 8.3.1. Residential
- 8.3.2. Non-residential
- 8.3.2.1. Commercial
- 8.3.2.2. Industrial/institutional
- 8.3.2.3. Other Applications
- 8.1. Market Analysis, Insights and Forecast - by Type
- 9. Europe Solar Photovoltaic Glass Industry Analysis, Insights and Forecast, 2020-2032
- 9.1. Market Analysis, Insights and Forecast - by Type
- 9.1.1. AR Coated Glass
- 9.1.2. Tempered Glass
- 9.1.3. TCO Coated Glass
- 9.1.4. Other Types
- 9.2. Market Analysis, Insights and Forecast - by Technology
- 9.2.1. Crystalline Silicon
- 9.2.2. Cadmium Telluride Thin Film
- 9.2.3. Amorphous Silicon Solar
- 9.2.4. Copper Indium Gallium Diselenide (cigs)
- 9.2.5. Other Technologies
- 9.3. Market Analysis, Insights and Forecast - by Application
- 9.3.1. Residential
- 9.3.2. Non-residential
- 9.3.2.1. Commercial
- 9.3.2.2. Industrial/institutional
- 9.3.2.3. Other Applications
- 9.1. Market Analysis, Insights and Forecast - by Type
- 10. South America Solar Photovoltaic Glass Industry Analysis, Insights and Forecast, 2020-2032
- 10.1. Market Analysis, Insights and Forecast - by Type
- 10.1.1. AR Coated Glass
- 10.1.2. Tempered Glass
- 10.1.3. TCO Coated Glass
- 10.1.4. Other Types
- 10.2. Market Analysis, Insights and Forecast - by Technology
- 10.2.1. Crystalline Silicon
- 10.2.2. Cadmium Telluride Thin Film
- 10.2.3. Amorphous Silicon Solar
- 10.2.4. Copper Indium Gallium Diselenide (cigs)
- 10.2.5. Other Technologies
- 10.3. Market Analysis, Insights and Forecast - by Application
- 10.3.1. Residential
- 10.3.2. Non-residential
- 10.3.2.1. Commercial
- 10.3.2.2. Industrial/institutional
- 10.3.2.3. Other Applications
- 10.1. Market Analysis, Insights and Forecast - by Type
- 11. Middle East and Africa Solar Photovoltaic Glass Industry Analysis, Insights and Forecast, 2020-2032
- 11.1. Market Analysis, Insights and Forecast - by Type
- 11.1.1. AR Coated Glass
- 11.1.2. Tempered Glass
- 11.1.3. TCO Coated Glass
- 11.1.4. Other Types
- 11.2. Market Analysis, Insights and Forecast - by Technology
- 11.2.1. Crystalline Silicon
- 11.2.2. Cadmium Telluride Thin Film
- 11.2.3. Amorphous Silicon Solar
- 11.2.4. Copper Indium Gallium Diselenide (cigs)
- 11.2.5. Other Technologies
- 11.3. Market Analysis, Insights and Forecast - by Application
- 11.3.1. Residential
- 11.3.2. Non-residential
- 11.3.2.1. Commercial
- 11.3.2.2. Industrial/institutional
- 11.3.2.3. Other Applications
- 11.1. Market Analysis, Insights and Forecast - by Type
- 12. Competitive Analysis
- 12.1. Company Profiles
- 12.1.1 Nippon Sheet Glass Co Ltd
- 12.1.1.1. Company Overview
- 12.1.1.2. Products
- 12.1.1.3. Company Financials
- 12.1.1.4. SWOT Analysis
- 12.1.2 Hainan Development Holdings Nanhai Co Ltd
- 12.1.2.1. Company Overview
- 12.1.2.2. Products
- 12.1.2.3. Company Financials
- 12.1.2.4. SWOT Analysis
- 12.1.3 CSG Holding Co Ltd
- 12.1.3.1. Company Overview
- 12.1.3.2. Products
- 12.1.3.3. Company Financials
- 12.1.3.4. SWOT Analysis
- 12.1.4 Saint-Gobain
- 12.1.4.1. Company Overview
- 12.1.4.2. Products
- 12.1.4.3. Company Financials
- 12.1.4.4. SWOT Analysis
- 12.1.5 Irico Group New Energy Company Limited
- 12.1.5.1. Company Overview
- 12.1.5.2. Products
- 12.1.5.3. Company Financials
- 12.1.5.4. SWOT Analysis
- 12.1.6 Sisecam
- 12.1.6.1. Company Overview
- 12.1.6.2. Products
- 12.1.6.3. Company Financials
- 12.1.6.4. SWOT Analysis
- 12.1.7 Jinjing (Group) Co Ltd
- 12.1.7.1. Company Overview
- 12.1.7.2. Products
- 12.1.7.3. Company Financials
- 12.1.7.4. SWOT Analysis
- 12.1.8 Taiwan Glass Ind Corp
- 12.1.8.1. Company Overview
- 12.1.8.2. Products
- 12.1.8.3. Company Financials
- 12.1.8.4. SWOT Analysis
- 12.1.9 Onyx Solar Group LLC
- 12.1.9.1. Company Overview
- 12.1.9.2. Products
- 12.1.9.3. Company Financials
- 12.1.9.4. SWOT Analysis
- 12.1.10 Guardian Industries Holdings
- 12.1.10.1. Company Overview
- 12.1.10.2. Products
- 12.1.10.3. Company Financials
- 12.1.10.4. SWOT Analysis
- 12.1.11 Flat Glass Group Co Ltd
- 12.1.11.1. Company Overview
- 12.1.11.2. Products
- 12.1.11.3. Company Financials
- 12.1.11.4. SWOT Analysis
- 12.1.12 Xinyi Solar Holdings Limited*List Not Exhaustive
- 12.1.12.1. Company Overview
- 12.1.12.2. Products
- 12.1.12.3. Company Financials
- 12.1.12.4. SWOT Analysis
- 12.1.13 Kaneka Energy Management Solutions
- 12.1.13.1. Company Overview
- 12.1.13.2. Products
- 12.1.13.3. Company Financials
- 12.1.13.4. SWOT Analysis
- 12.1.14 AGC Inc
- 12.1.14.1. Company Overview
- 12.1.14.2. Products
- 12.1.14.3. Company Financials
- 12.1.14.4. SWOT Analysis
- 12.1.15 Borosil Limited
- 12.1.15.1. Company Overview
- 12.1.15.2. Products
- 12.1.15.3. Company Financials
- 12.1.15.4. SWOT Analysis
- 12.1.1 Nippon Sheet Glass Co Ltd
- 12.2. Market Entropy
- 12.2.1 Company's Key Areas Served
- 12.2.2 Recent Developments
- 12.3. Company Market Share Analysis 2025
- 12.3.1 Top 5 Companies Market Share Analysis
- 12.3.2 Top 3 Companies Market Share Analysis
- 12.4. List of Potential Customers
- 13. Research Methodology
List of Figures
- Figure 1: Global Solar Photovoltaic Glass Industry Revenue Breakdown (billion, %) by Region 2025 & 2033
- Figure 2: Global Solar Photovoltaic Glass Industry Volume Breakdown (Million, %) by Region 2025 & 2033
- Figure 3: Asia Pacific Solar Photovoltaic Glass Industry Revenue (billion), by Type 2025 & 2033
- Figure 4: Asia Pacific Solar Photovoltaic Glass Industry Volume (Million), by Type 2025 & 2033
- Figure 5: Asia Pacific Solar Photovoltaic Glass Industry Revenue Share (%), by Type 2025 & 2033
- Figure 6: Asia Pacific Solar Photovoltaic Glass Industry Volume Share (%), by Type 2025 & 2033
- Figure 7: Asia Pacific Solar Photovoltaic Glass Industry Revenue (billion), by Technology 2025 & 2033
- Figure 8: Asia Pacific Solar Photovoltaic Glass Industry Volume (Million), by Technology 2025 & 2033
- Figure 9: Asia Pacific Solar Photovoltaic Glass Industry Revenue Share (%), by Technology 2025 & 2033
- Figure 10: Asia Pacific Solar Photovoltaic Glass Industry Volume Share (%), by Technology 2025 & 2033
- Figure 11: Asia Pacific Solar Photovoltaic Glass Industry Revenue (billion), by Application 2025 & 2033
- Figure 12: Asia Pacific Solar Photovoltaic Glass Industry Volume (Million), by Application 2025 & 2033
- Figure 13: Asia Pacific Solar Photovoltaic Glass Industry Revenue Share (%), by Application 2025 & 2033
- Figure 14: Asia Pacific Solar Photovoltaic Glass Industry Volume Share (%), by Application 2025 & 2033
- Figure 15: Asia Pacific Solar Photovoltaic Glass Industry Revenue (billion), by Country 2025 & 2033
- Figure 16: Asia Pacific Solar Photovoltaic Glass Industry Volume (Million), by Country 2025 & 2033
- Figure 17: Asia Pacific Solar Photovoltaic Glass Industry Revenue Share (%), by Country 2025 & 2033
- Figure 18: Asia Pacific Solar Photovoltaic Glass Industry Volume Share (%), by Country 2025 & 2033
- Figure 19: North America Solar Photovoltaic Glass Industry Revenue (billion), by Type 2025 & 2033
- Figure 20: North America Solar Photovoltaic Glass Industry Volume (Million), by Type 2025 & 2033
- Figure 21: North America Solar Photovoltaic Glass Industry Revenue Share (%), by Type 2025 & 2033
- Figure 22: North America Solar Photovoltaic Glass Industry Volume Share (%), by Type 2025 & 2033
- Figure 23: North America Solar Photovoltaic Glass Industry Revenue (billion), by Technology 2025 & 2033
- Figure 24: North America Solar Photovoltaic Glass Industry Volume (Million), by Technology 2025 & 2033
- Figure 25: North America Solar Photovoltaic Glass Industry Revenue Share (%), by Technology 2025 & 2033
- Figure 26: North America Solar Photovoltaic Glass Industry Volume Share (%), by Technology 2025 & 2033
- Figure 27: North America Solar Photovoltaic Glass Industry Revenue (billion), by Application 2025 & 2033
- Figure 28: North America Solar Photovoltaic Glass Industry Volume (Million), by Application 2025 & 2033
- Figure 29: North America Solar Photovoltaic Glass Industry Revenue Share (%), by Application 2025 & 2033
- Figure 30: North America Solar Photovoltaic Glass Industry Volume Share (%), by Application 2025 & 2033
- Figure 31: North America Solar Photovoltaic Glass Industry Revenue (billion), by Country 2025 & 2033
- Figure 32: North America Solar Photovoltaic Glass Industry Volume (Million), by Country 2025 & 2033
- Figure 33: North America Solar Photovoltaic Glass Industry Revenue Share (%), by Country 2025 & 2033
- Figure 34: North America Solar Photovoltaic Glass Industry Volume Share (%), by Country 2025 & 2033
- Figure 35: Europe Solar Photovoltaic Glass Industry Revenue (billion), by Type 2025 & 2033
- Figure 36: Europe Solar Photovoltaic Glass Industry Volume (Million), by Type 2025 & 2033
- Figure 37: Europe Solar Photovoltaic Glass Industry Revenue Share (%), by Type 2025 & 2033
- Figure 38: Europe Solar Photovoltaic Glass Industry Volume Share (%), by Type 2025 & 2033
- Figure 39: Europe Solar Photovoltaic Glass Industry Revenue (billion), by Technology 2025 & 2033
- Figure 40: Europe Solar Photovoltaic Glass Industry Volume (Million), by Technology 2025 & 2033
- Figure 41: Europe Solar Photovoltaic Glass Industry Revenue Share (%), by Technology 2025 & 2033
- Figure 42: Europe Solar Photovoltaic Glass Industry Volume Share (%), by Technology 2025 & 2033
- Figure 43: Europe Solar Photovoltaic Glass Industry Revenue (billion), by Application 2025 & 2033
- Figure 44: Europe Solar Photovoltaic Glass Industry Volume (Million), by Application 2025 & 2033
- Figure 45: Europe Solar Photovoltaic Glass Industry Revenue Share (%), by Application 2025 & 2033
- Figure 46: Europe Solar Photovoltaic Glass Industry Volume Share (%), by Application 2025 & 2033
- Figure 47: Europe Solar Photovoltaic Glass Industry Revenue (billion), by Country 2025 & 2033
- Figure 48: Europe Solar Photovoltaic Glass Industry Volume (Million), by Country 2025 & 2033
- Figure 49: Europe Solar Photovoltaic Glass Industry Revenue Share (%), by Country 2025 & 2033
- Figure 50: Europe Solar Photovoltaic Glass Industry Volume Share (%), by Country 2025 & 2033
- Figure 51: South America Solar Photovoltaic Glass Industry Revenue (billion), by Type 2025 & 2033
- Figure 52: South America Solar Photovoltaic Glass Industry Volume (Million), by Type 2025 & 2033
- Figure 53: South America Solar Photovoltaic Glass Industry Revenue Share (%), by Type 2025 & 2033
- Figure 54: South America Solar Photovoltaic Glass Industry Volume Share (%), by Type 2025 & 2033
- Figure 55: South America Solar Photovoltaic Glass Industry Revenue (billion), by Technology 2025 & 2033
- Figure 56: South America Solar Photovoltaic Glass Industry Volume (Million), by Technology 2025 & 2033
- Figure 57: South America Solar Photovoltaic Glass Industry Revenue Share (%), by Technology 2025 & 2033
- Figure 58: South America Solar Photovoltaic Glass Industry Volume Share (%), by Technology 2025 & 2033
- Figure 59: South America Solar Photovoltaic Glass Industry Revenue (billion), by Application 2025 & 2033
- Figure 60: South America Solar Photovoltaic Glass Industry Volume (Million), by Application 2025 & 2033
- Figure 61: South America Solar Photovoltaic Glass Industry Revenue Share (%), by Application 2025 & 2033
- Figure 62: South America Solar Photovoltaic Glass Industry Volume Share (%), by Application 2025 & 2033
- Figure 63: South America Solar Photovoltaic Glass Industry Revenue (billion), by Country 2025 & 2033
- Figure 64: South America Solar Photovoltaic Glass Industry Volume (Million), by Country 2025 & 2033
- Figure 65: South America Solar Photovoltaic Glass Industry Revenue Share (%), by Country 2025 & 2033
- Figure 66: South America Solar Photovoltaic Glass Industry Volume Share (%), by Country 2025 & 2033
- Figure 67: Middle East and Africa Solar Photovoltaic Glass Industry Revenue (billion), by Type 2025 & 2033
- Figure 68: Middle East and Africa Solar Photovoltaic Glass Industry Volume (Million), by Type 2025 & 2033
- Figure 69: Middle East and Africa Solar Photovoltaic Glass Industry Revenue Share (%), by Type 2025 & 2033
- Figure 70: Middle East and Africa Solar Photovoltaic Glass Industry Volume Share (%), by Type 2025 & 2033
- Figure 71: Middle East and Africa Solar Photovoltaic Glass Industry Revenue (billion), by Technology 2025 & 2033
- Figure 72: Middle East and Africa Solar Photovoltaic Glass Industry Volume (Million), by Technology 2025 & 2033
- Figure 73: Middle East and Africa Solar Photovoltaic Glass Industry Revenue Share (%), by Technology 2025 & 2033
- Figure 74: Middle East and Africa Solar Photovoltaic Glass Industry Volume Share (%), by Technology 2025 & 2033
- Figure 75: Middle East and Africa Solar Photovoltaic Glass Industry Revenue (billion), by Application 2025 & 2033
- Figure 76: Middle East and Africa Solar Photovoltaic Glass Industry Volume (Million), by Application 2025 & 2033
- Figure 77: Middle East and Africa Solar Photovoltaic Glass Industry Revenue Share (%), by Application 2025 & 2033
- Figure 78: Middle East and Africa Solar Photovoltaic Glass Industry Volume Share (%), by Application 2025 & 2033
- Figure 79: Middle East and Africa Solar Photovoltaic Glass Industry Revenue (billion), by Country 2025 & 2033
- Figure 80: Middle East and Africa Solar Photovoltaic Glass Industry Volume (Million), by Country 2025 & 2033
- Figure 81: Middle East and Africa Solar Photovoltaic Glass Industry Revenue Share (%), by Country 2025 & 2033
- Figure 82: Middle East and Africa Solar Photovoltaic Glass Industry Volume Share (%), by Country 2025 & 2033
List of Tables
- Table 1: Global Solar Photovoltaic Glass Industry Revenue billion Forecast, by Type 2020 & 2033
- Table 2: Global Solar Photovoltaic Glass Industry Volume Million Forecast, by Type 2020 & 2033
- Table 3: Global Solar Photovoltaic Glass Industry Revenue billion Forecast, by Technology 2020 & 2033
- Table 4: Global Solar Photovoltaic Glass Industry Volume Million Forecast, by Technology 2020 & 2033
- Table 5: Global Solar Photovoltaic Glass Industry Revenue billion Forecast, by Application 2020 & 2033
- Table 6: Global Solar Photovoltaic Glass Industry Volume Million Forecast, by Application 2020 & 2033
- Table 7: Global Solar Photovoltaic Glass Industry Revenue billion Forecast, by Region 2020 & 2033
- Table 8: Global Solar Photovoltaic Glass Industry Volume Million Forecast, by Region 2020 & 2033
- Table 9: Global Solar Photovoltaic Glass Industry Revenue billion Forecast, by Type 2020 & 2033
- Table 10: Global Solar Photovoltaic Glass Industry Volume Million Forecast, by Type 2020 & 2033
- Table 11: Global Solar Photovoltaic Glass Industry Revenue billion Forecast, by Technology 2020 & 2033
- Table 12: Global Solar Photovoltaic Glass Industry Volume Million Forecast, by Technology 2020 & 2033
- Table 13: Global Solar Photovoltaic Glass Industry Revenue billion Forecast, by Application 2020 & 2033
- Table 14: Global Solar Photovoltaic Glass Industry Volume Million Forecast, by Application 2020 & 2033
- Table 15: Global Solar Photovoltaic Glass Industry Revenue billion Forecast, by Country 2020 & 2033
- Table 16: Global Solar Photovoltaic Glass Industry Volume Million Forecast, by Country 2020 & 2033
- Table 17: China Solar Photovoltaic Glass Industry Revenue (billion) Forecast, by Application 2020 & 2033
- Table 18: China Solar Photovoltaic Glass Industry Volume (Million) Forecast, by Application 2020 & 2033
- Table 19: India Solar Photovoltaic Glass Industry Revenue (billion) Forecast, by Application 2020 & 2033
- Table 20: India Solar Photovoltaic Glass Industry Volume (Million) Forecast, by Application 2020 & 2033
- Table 21: Japan Solar Photovoltaic Glass Industry Revenue (billion) Forecast, by Application 2020 & 2033
- Table 22: Japan Solar Photovoltaic Glass Industry Volume (Million) Forecast, by Application 2020 & 2033
- Table 23: South Korea Solar Photovoltaic Glass Industry Revenue (billion) Forecast, by Application 2020 & 2033
- Table 24: South Korea Solar Photovoltaic Glass Industry Volume (Million) Forecast, by Application 2020 & 2033
- Table 25: Rest of Asia Pacific Solar Photovoltaic Glass Industry Revenue (billion) Forecast, by Application 2020 & 2033
- Table 26: Rest of Asia Pacific Solar Photovoltaic Glass Industry Volume (Million) Forecast, by Application 2020 & 2033
- Table 27: Global Solar Photovoltaic Glass Industry Revenue billion Forecast, by Type 2020 & 2033
- Table 28: Global Solar Photovoltaic Glass Industry Volume Million Forecast, by Type 2020 & 2033
- Table 29: Global Solar Photovoltaic Glass Industry Revenue billion Forecast, by Technology 2020 & 2033
- Table 30: Global Solar Photovoltaic Glass Industry Volume Million Forecast, by Technology 2020 & 2033
- Table 31: Global Solar Photovoltaic Glass Industry Revenue billion Forecast, by Application 2020 & 2033
- Table 32: Global Solar Photovoltaic Glass Industry Volume Million Forecast, by Application 2020 & 2033
- Table 33: Global Solar Photovoltaic Glass Industry Revenue billion Forecast, by Country 2020 & 2033
- Table 34: Global Solar Photovoltaic Glass Industry Volume Million Forecast, by Country 2020 & 2033
- Table 35: United States Solar Photovoltaic Glass Industry Revenue (billion) Forecast, by Application 2020 & 2033
- Table 36: United States Solar Photovoltaic Glass Industry Volume (Million) Forecast, by Application 2020 & 2033
- Table 37: Canada Solar Photovoltaic Glass Industry Revenue (billion) Forecast, by Application 2020 & 2033
- Table 38: Canada Solar Photovoltaic Glass Industry Volume (Million) Forecast, by Application 2020 & 2033
- Table 39: Mexico Solar Photovoltaic Glass Industry Revenue (billion) Forecast, by Application 2020 & 2033
- Table 40: Mexico Solar Photovoltaic Glass Industry Volume (Million) Forecast, by Application 2020 & 2033
- Table 41: Global Solar Photovoltaic Glass Industry Revenue billion Forecast, by Type 2020 & 2033
- Table 42: Global Solar Photovoltaic Glass Industry Volume Million Forecast, by Type 2020 & 2033
- Table 43: Global Solar Photovoltaic Glass Industry Revenue billion Forecast, by Technology 2020 & 2033
- Table 44: Global Solar Photovoltaic Glass Industry Volume Million Forecast, by Technology 2020 & 2033
- Table 45: Global Solar Photovoltaic Glass Industry Revenue billion Forecast, by Application 2020 & 2033
- Table 46: Global Solar Photovoltaic Glass Industry Volume Million Forecast, by Application 2020 & 2033
- Table 47: Global Solar Photovoltaic Glass Industry Revenue billion Forecast, by Country 2020 & 2033
- Table 48: Global Solar Photovoltaic Glass Industry Volume Million Forecast, by Country 2020 & 2033
- Table 49: Germany Solar Photovoltaic Glass Industry Revenue (billion) Forecast, by Application 2020 & 2033
- Table 50: Germany Solar Photovoltaic Glass Industry Volume (Million) Forecast, by Application 2020 & 2033
- Table 51: United Kingdom Solar Photovoltaic Glass Industry Revenue (billion) Forecast, by Application 2020 & 2033
- Table 52: United Kingdom Solar Photovoltaic Glass Industry Volume (Million) Forecast, by Application 2020 & 2033
- Table 53: France Solar Photovoltaic Glass Industry Revenue (billion) Forecast, by Application 2020 & 2033
- Table 54: France Solar Photovoltaic Glass Industry Volume (Million) Forecast, by Application 2020 & 2033
- Table 55: Italy Solar Photovoltaic Glass Industry Revenue (billion) Forecast, by Application 2020 & 2033
- Table 56: Italy Solar Photovoltaic Glass Industry Volume (Million) Forecast, by Application 2020 & 2033
- Table 57: Rest of Europe Solar Photovoltaic Glass Industry Revenue (billion) Forecast, by Application 2020 & 2033
- Table 58: Rest of Europe Solar Photovoltaic Glass Industry Volume (Million) Forecast, by Application 2020 & 2033
- Table 59: Global Solar Photovoltaic Glass Industry Revenue billion Forecast, by Type 2020 & 2033
- Table 60: Global Solar Photovoltaic Glass Industry Volume Million Forecast, by Type 2020 & 2033
- Table 61: Global Solar Photovoltaic Glass Industry Revenue billion Forecast, by Technology 2020 & 2033
- Table 62: Global Solar Photovoltaic Glass Industry Volume Million Forecast, by Technology 2020 & 2033
- Table 63: Global Solar Photovoltaic Glass Industry Revenue billion Forecast, by Application 2020 & 2033
- Table 64: Global Solar Photovoltaic Glass Industry Volume Million Forecast, by Application 2020 & 2033
- Table 65: Global Solar Photovoltaic Glass Industry Revenue billion Forecast, by Country 2020 & 2033
- Table 66: Global Solar Photovoltaic Glass Industry Volume Million Forecast, by Country 2020 & 2033
- Table 67: Brazil Solar Photovoltaic Glass Industry Revenue (billion) Forecast, by Application 2020 & 2033
- Table 68: Brazil Solar Photovoltaic Glass Industry Volume (Million) Forecast, by Application 2020 & 2033
- Table 69: Argentina Solar Photovoltaic Glass Industry Revenue (billion) Forecast, by Application 2020 & 2033
- Table 70: Argentina Solar Photovoltaic Glass Industry Volume (Million) Forecast, by Application 2020 & 2033
- Table 71: Rest of South America Solar Photovoltaic Glass Industry Revenue (billion) Forecast, by Application 2020 & 2033
- Table 72: Rest of South America Solar Photovoltaic Glass Industry Volume (Million) Forecast, by Application 2020 & 2033
- Table 73: Global Solar Photovoltaic Glass Industry Revenue billion Forecast, by Type 2020 & 2033
- Table 74: Global Solar Photovoltaic Glass Industry Volume Million Forecast, by Type 2020 & 2033
- Table 75: Global Solar Photovoltaic Glass Industry Revenue billion Forecast, by Technology 2020 & 2033
- Table 76: Global Solar Photovoltaic Glass Industry Volume Million Forecast, by Technology 2020 & 2033
- Table 77: Global Solar Photovoltaic Glass Industry Revenue billion Forecast, by Application 2020 & 2033
- Table 78: Global Solar Photovoltaic Glass Industry Volume Million Forecast, by Application 2020 & 2033
- Table 79: Global Solar Photovoltaic Glass Industry Revenue billion Forecast, by Country 2020 & 2033
- Table 80: Global Solar Photovoltaic Glass Industry Volume Million Forecast, by Country 2020 & 2033
- Table 81: Saudi Arabia Solar Photovoltaic Glass Industry Revenue (billion) Forecast, by Application 2020 & 2033
- Table 82: Saudi Arabia Solar Photovoltaic Glass Industry Volume (Million) Forecast, by Application 2020 & 2033
- Table 83: South Africa Solar Photovoltaic Glass Industry Revenue (billion) Forecast, by Application 2020 & 2033
- Table 84: South Africa Solar Photovoltaic Glass Industry Volume (Million) Forecast, by Application 2020 & 2033
- Table 85: Morocco Solar Photovoltaic Glass Industry Revenue (billion) Forecast, by Application 2020 & 2033
- Table 86: Morocco Solar Photovoltaic Glass Industry Volume (Million) Forecast, by Application 2020 & 2033
- Table 87: Rest of Middle East and Africa Solar Photovoltaic Glass Industry Revenue (billion) Forecast, by Application 2020 & 2033
- Table 88: Rest of Middle East and Africa Solar Photovoltaic Glass Industry Volume (Million) Forecast, by Application 2020 & 2033
Frequently Asked Questions
1. What is the projected Compound Annual Growth Rate (CAGR) of the Solar Photovoltaic Glass Industry?
The projected CAGR is approximately 31.2%.
2. Which companies are prominent players in the Solar Photovoltaic Glass Industry?
Key companies in the market include Nippon Sheet Glass Co Ltd, Hainan Development Holdings Nanhai Co Ltd, CSG Holding Co Ltd, Saint-Gobain, Irico Group New Energy Company Limited, Sisecam, Jinjing (Group) Co Ltd, Taiwan Glass Ind Corp, Onyx Solar Group LLC, Guardian Industries Holdings, Flat Glass Group Co Ltd, Xinyi Solar Holdings Limited*List Not Exhaustive, Kaneka Energy Management Solutions, AGC Inc, Borosil Limited.
3. What are the main segments of the Solar Photovoltaic Glass Industry?
The market segments include Type, Technology, Application.
4. Can you provide details about the market size?
The market size is estimated to be USD 17.09 billion as of 2022.
5. What are some drivers contributing to market growth?
Increasing Demand for Renewable Energy.
6. What are the notable trends driving market growth?
Increasing Demand from the Non-residential Sector.
7. Are there any restraints impacting market growth?
Rising Adoption of Alternate Clean Power Sources.
8. Can you provide examples of recent developments in the market?
In October 2023, Borosil Renewables Limited acquired an 86% stake in the two European solar glass manufacturers, Interfloat Corporation and Glasmanufaktur Brandenburg (GMB). The acquisition has boosted the company’s solar glass manufacturing capacity in Europe to 750 TPD from 450 TPD.
9. What pricing options are available for accessing the report?
Pricing options include single-user, multi-user, and enterprise licenses priced at USD 4750, USD 5250, and USD 8750 respectively.
10. Is the market size provided in terms of value or volume?
The market size is provided in terms of value, measured in billion and volume, measured in Million.
11. Are there any specific market keywords associated with the report?
Yes, the market keyword associated with the report is "Solar Photovoltaic Glass Industry," which aids in identifying and referencing the specific market segment covered.
12. How do I determine which pricing option suits my needs best?
The pricing options vary based on user requirements and access needs. Individual users may opt for single-user licenses, while businesses requiring broader access may choose multi-user or enterprise licenses for cost-effective access to the report.
13. Are there any additional resources or data provided in the Solar Photovoltaic Glass Industry report?
While the report offers comprehensive insights, it's advisable to review the specific contents or supplementary materials provided to ascertain if additional resources or data are available.
14. How can I stay updated on further developments or reports in the Solar Photovoltaic Glass Industry?
To stay informed about further developments, trends, and reports in the Solar Photovoltaic Glass Industry, consider subscribing to industry newsletters, following relevant companies and organizations, or regularly checking reputable industry news sources and publications.
Methodology
Step 1 - Identification of Relevant Samples Size from Population Database


Step 2 - Approaches for Defining Global Market Size (Value, Volume* & Price*)

Note*: In applicable scenarios
Step 3 - Data Sources
Primary Research
- Web Analytics
- Survey Reports
- Research Institute
- Latest Research Reports
- Opinion Leaders
Secondary Research
- Annual Reports
- White Paper
- Latest Press Release
- Industry Association
- Paid Database
- Investor Presentations

Step 4 - Data Triangulation
Involves using different sources of information in order to increase the validity of a study
These sources are likely to be stakeholders in a program - participants, other researchers, program staff, other community members, and so on.
Then we put all data in single framework & apply various statistical tools to find out the dynamic on the market.
During the analysis stage, feedback from the stakeholder groups would be compared to determine areas of agreement as well as areas of divergence