
Key Insights
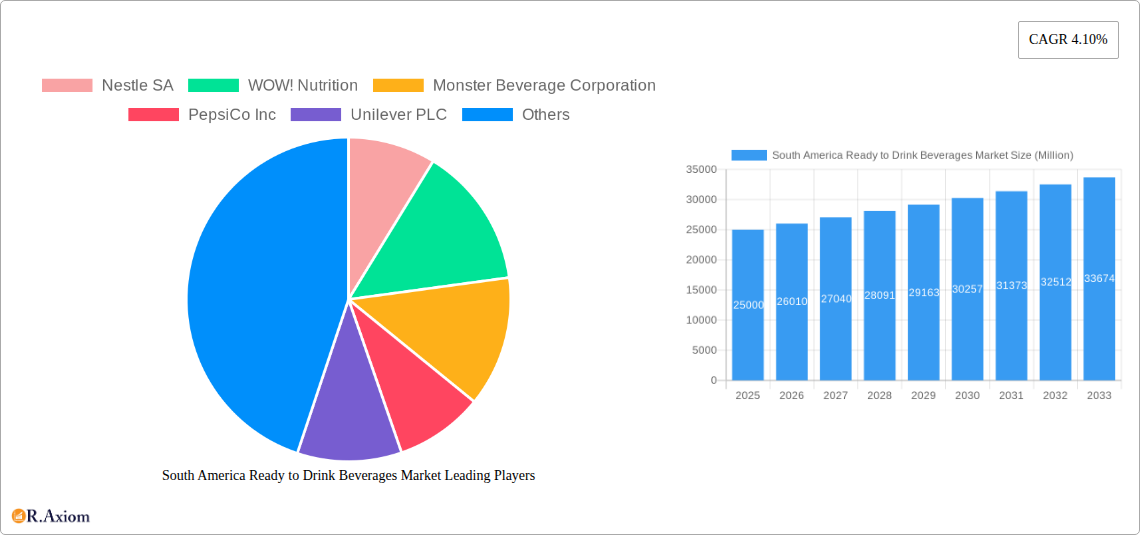
The South American Ready-to-Drink (RTD) beverage market, valued at approximately $XX million in 2025, is projected to experience robust growth, driven by several key factors. Rising disposable incomes, particularly in burgeoning urban centers like São Paulo and Buenos Aires, are fueling increased consumer spending on convenient and refreshing beverages. A young and growing population, coupled with increasing adoption of Western lifestyles, further contributes to heightened demand. The market is segmented by beverage type (tea, coffee, energy drinks, fruit & vegetable juices, dairy-based beverages, and others) and distribution channels (supermarkets/hypermarkets, convenience stores, online stores, and other channels). The strong presence of multinational corporations like Coca-Cola, PepsiCo, and Nestlé, coupled with the rise of local players, indicates a competitive yet dynamic landscape. Growth in the energy drink and functional beverage segments is particularly noteworthy, reflecting consumer interest in healthier options and enhanced performance. However, the market faces challenges such as fluctuating raw material prices and economic instability in certain regions within South America. The increasing popularity of health-conscious consumers selecting natural and organic RTD beverages presents both a challenge and an opportunity for market players to adapt their offerings.
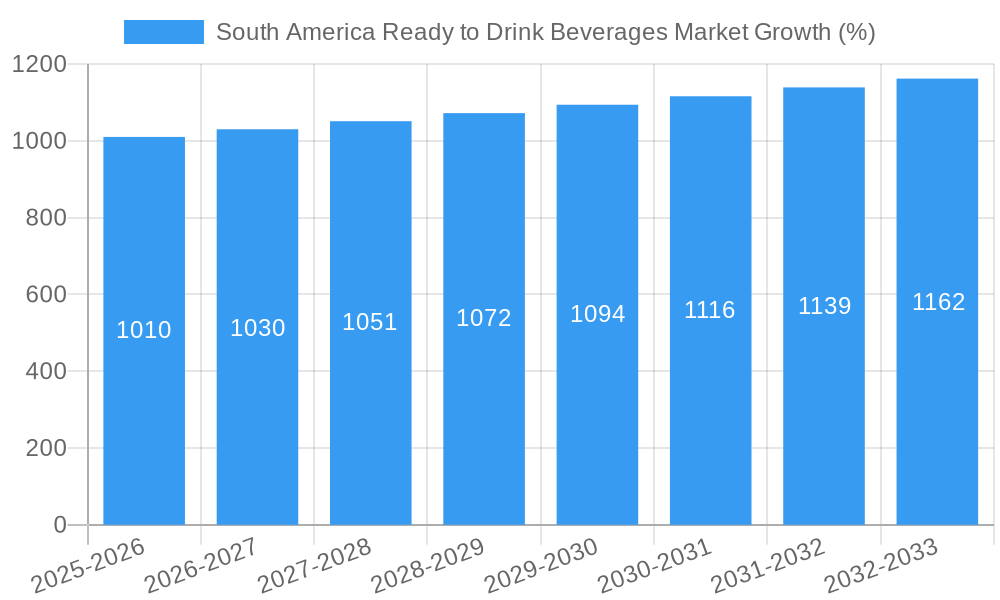
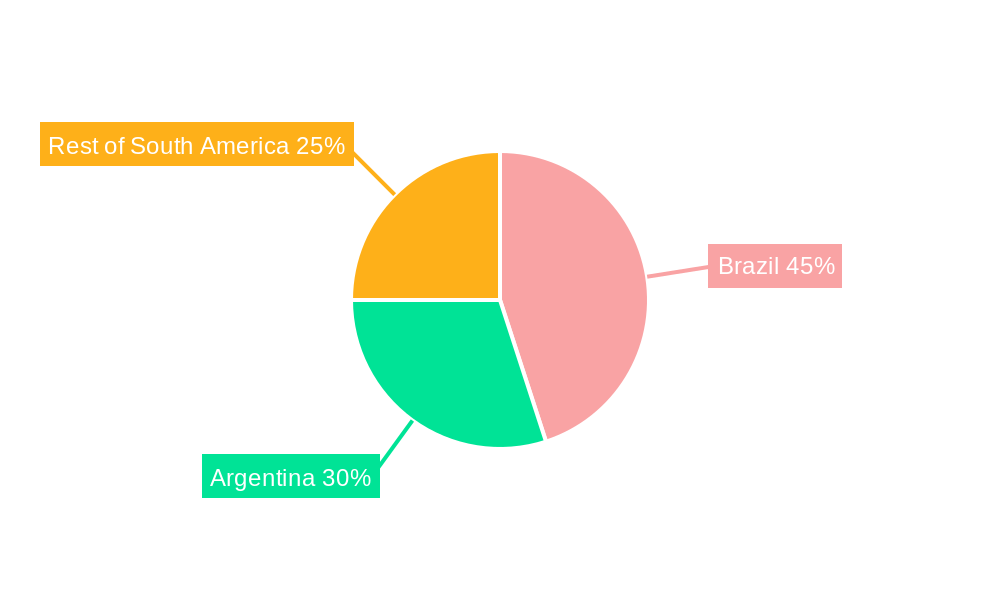
The forecast period (2025-2033) suggests a continued expansion, with a projected Compound Annual Growth Rate (CAGR) of 4.10%. This growth trajectory is anticipated to be influenced by ongoing infrastructural improvements in distribution channels, particularly the expansion of e-commerce platforms. Brazil and Argentina dominate the regional market, representing significant consumption centers. However, the "Rest of South America" segment presents substantial untapped potential, with opportunities for market expansion into lesser-penetrated areas. A key focus for companies will be to cater to the diverse preferences across these regions, including variations in taste profiles and cultural nuances. Successful strategies will involve strong branding, efficient distribution networks, and targeted marketing campaigns. Understanding the specific demands of each segment – be it price sensitivity in certain regions or the preference for specific beverage types – will prove crucial for sustained market penetration and growth.
This detailed report provides a comprehensive analysis of the South America Ready-to-Drink Beverages market, offering valuable insights for industry stakeholders, investors, and businesses seeking to navigate this dynamic landscape. The report covers the period from 2019 to 2033, with a focus on the forecast period of 2025-2033 and a base year of 2025. The market is segmented by beverage type and distribution channel, providing a granular understanding of growth opportunities and challenges.
South America Ready to Drink Beverages Market Market Concentration & Innovation
This section analyzes the competitive landscape, innovation trends, and regulatory influences shaping the South America Ready-to-Drink Beverages market. The market is moderately concentrated, with key players like The Coca-Cola Company, PepsiCo Inc, and Ambev holding significant market share. However, smaller, niche players are also emerging, driven by consumer demand for healthier and more specialized beverages.
Market Concentration: The Herfindahl-Hirschman Index (HHI) for the market is estimated at xx, indicating a moderately concentrated market. The top 5 players account for approximately xx% of the market share.
Innovation Drivers: Key innovation drivers include the increasing demand for functional beverages (e.g., those with added vitamins, probiotics, or protein), the rise of natural and organic products, and the growing adoption of sustainable packaging.
Regulatory Framework: Regulatory frameworks vary across South American countries, impacting labeling requirements, ingredient approvals, and marketing regulations. These regulations significantly influence product development and market access.
Product Substitutes: The ready-to-drink beverage market faces competition from other hydration sources like bottled water and fresh juices. The increasing awareness of health and wellness also fuels competition from other beverage categories.
End-User Trends: Health-conscious consumers are driving demand for low-sugar, low-calorie, and functional beverages. The growing popularity of convenience and on-the-go consumption patterns also boosts the market's growth.
M&A Activities: The South American Ready-to-Drink Beverages market has witnessed several mergers and acquisitions in recent years, driven by the need for market expansion, product diversification, and access to new technologies. For example, the estimated total value of M&A deals in the sector between 2019-2024 was xx Million.
South America Ready to Drink Beverages Market Industry Trends & Insights
The South American Ready-to-Drink Beverages market is experiencing significant growth, driven by several key factors. Rising disposable incomes, changing lifestyles, and increasing urbanization are fueling demand for convenient and readily available beverages. The market exhibits a Compound Annual Growth Rate (CAGR) of xx% during the historical period (2019-2024) and is projected to grow at a CAGR of xx% during the forecast period (2025-2033). Market penetration of ready-to-drink beverages is high in urban areas, but there's potential for growth in rural regions. Technological disruptions, particularly in packaging and distribution, are streamlining operations and enhancing efficiency. Consumer preferences are shifting towards healthier options, creating opportunities for innovative products. The competitive landscape is dynamic, with both established players and new entrants vying for market share. Price competition and promotional activities play a significant role in influencing consumer choices. The market displays regional variations, with some countries demonstrating faster growth than others due to factors like economic conditions and consumer behavior.
Dominant Markets & Segments in South America Ready to Drink Beverages Market
The South American Ready-to-Drink Beverages market is dominated by Brazil, followed by Argentina, Colombia, and Mexico. These countries have large populations, established retail infrastructure, and a significant consumer base with growing disposable incomes. The Fruits & Vegetable Juice segment accounts for the largest market share driven by increasing health consciousness and the availability of diverse options.
Key Drivers:
- Brazil: Large population, high consumption of ready-to-drink beverages, well-developed distribution networks.
- Argentina: Growing disposable incomes, increasing preference for convenience beverages.
- Colombia: Rising urbanization, expanding retail infrastructure.
- Mexico: Significant demand for functional beverages.
- Fruits & Vegetable Juice Segment: Rising demand for healthier options, growing awareness of health benefits.
Dominance Analysis: The dominance of Brazil and the Fruits & Vegetable Juice segment is primarily attributed to factors including higher per capita consumption, favorable economic conditions, and strong consumer demand for convenient and healthy beverage options.
South America Ready to Drink Beverages Market Product Developments
Recent product innovations focus on incorporating functional ingredients, adopting sustainable packaging, and catering to specific consumer needs like low-sugar and low-calorie options. The market witnesses a steady introduction of new flavors, formats, and packaging to enhance consumer appeal. Technological advancements in beverage processing, packaging, and distribution have increased efficiency and improved product quality. Companies are actively developing innovative products that align with health and wellness trends, addressing a growing demand for functional beverages that provide additional health benefits.
Report Scope & Segmentation Analysis
By Type: The market is segmented into Tea, Coffee, Energy Drinks, Fruits & Vegetable Juice, Dairy-based Beverages, and Others. Each segment exhibits different growth trajectories and competitive dynamics. The Fruits & Vegetable Juice segment is anticipated to maintain its leading position due to health-conscious consumer preferences.
By Distribution Channel: The market is segmented into Supermarkets/Hypermarkets, Convenience Stores, Online Stores, and Other Distribution Channels. Supermarkets/Hypermarkets are the dominant distribution channel. However, online stores are growing rapidly driven by e-commerce adoption.
Key Drivers of South America Ready to Drink Beverages Market Growth
Several factors fuel the market's expansion. Rising disposable incomes increase purchasing power. Changing lifestyles and urbanization drive demand for convenience. The increasing prevalence of health-conscious consumers increases the demand for healthier options. Government support for the food and beverage industry through favorable regulations and infrastructure development further stimulates market growth.
Challenges in the South America Ready to Drink Beverages Market Sector
The South American Ready-to-Drink Beverages market faces challenges like fluctuating raw material prices, which increase production costs. Supply chain disruptions can affect product availability. Intense competition from both domestic and international brands creates a competitive pressure. Regulatory changes and compliance requirements may also impede market expansion in some regions.
Emerging Opportunities in South America Ready to Drink Beverages Market
Emerging opportunities include the growing demand for premium and specialized beverages like organic, functional, and sustainable products. The expansion of e-commerce provides new distribution channels. Untapped rural markets hold significant potential for growth. Strategic partnerships and collaborations can allow companies to leverage resources and expand their market presence.
Leading Players in the South America Ready to Drink Beverages Market Market
- Nestle SA
- WOW! Nutrition
- Monster Beverage Corporation
- PepsiCo Inc
- Unilever PLC
- Grupo Petropolis
- Red Bull GmbH
- The Coca-Cola Company
- Starbucks Corporation
- Ambev
Key Developments in South America Ready to Drink Beverages Market Industry
- August 2022: Saudabille launched a line of children's juices in Brazil.
- March 2022: Louis Dreyfus Company invested in expanding orange juice production in Brazil.
- December 2020: Amcor developed a new PET bottle for Frupro protein juice in Colombia.
Strategic Outlook for South America Ready to Drink Beverages Market Market
The South American Ready-to-Drink Beverages market presents promising growth prospects due to several factors. The rising demand for convenient and healthier beverage options, coupled with increasing disposable incomes and expanding retail infrastructure, creates a favorable environment for market expansion. Opportunities exist for companies that can successfully adapt to changing consumer preferences and offer innovative products that meet the evolving needs of the market. The market's future growth will be influenced by factors such as economic stability, regulatory changes, and technological advancements.
South America Ready to Drink Beverages Market Segmentation
-
1. Type
- 1.1. Tea
- 1.2. Coffee
- 1.3. Energy Drinks
- 1.4. Fruits & Vegetable Juice
- 1.5. Dairy-based Beverages
- 1.6. Others
-
2. Distribution Channel
- 2.1. Supermarkets/Hypermarkets
- 2.2. Convenience Stores
- 2.3. Online Stores
- 2.4. Other Distribution Channels
-
3. Geography
- 3.1. Brazil
- 3.2. Argentina
- 3.3. Rest of South America
South America Ready to Drink Beverages Market Segmentation By Geography
- 1. Brazil
- 2. Argentina
- 3. Rest of South America
South America Ready to Drink Beverages Market REPORT HIGHLIGHTS
| Aspects | Details |
|---|---|
| Study Period | 2019-2033 |
| Base Year | 2024 |
| Estimated Year | 2025 |
| Forecast Period | 2025-2033 |
| Historical Period | 2019-2024 |
| Growth Rate | CAGR of 4.10% from 2019-2033 |
| Segmentation |
|
Table of Contents
- 1. Introduction
- 1.1. Research Scope
- 1.2. Market Segmentation
- 1.3. Research Methodology
- 1.4. Definitions and Assumptions
- 2. Executive Summary
- 2.1. Introduction
- 3. Market Dynamics
- 3.1. Introduction
- 3.2. Market Drivers
- 3.2.1. Growing awareness about health and wellness has led to increased demand for healthier RTD options such as low-sugar low-calorie an d fortified beverages
- 3.3. Market Restrains
- 3.3.1. High sugar content and artificial ingredients in some RTD beverages can lead to health concerns potentially limiting their appeal
- 3.4. Market Trends
- 3.4.1. Trend towards personalized and customized RTD beverages with brands offering tailored solutions to meet individual preferences
- 4. Market Factor Analysis
- 4.1. Porters Five Forces
- 4.2. Supply/Value Chain
- 4.3. PESTEL analysis
- 4.4. Market Entropy
- 4.5. Patent/Trademark Analysis
- 5. South America Ready to Drink Beverages Market Analysis, Insights and Forecast, 2019-2031
- 5.1. Market Analysis, Insights and Forecast - by Type
- 5.1.1. Tea
- 5.1.2. Coffee
- 5.1.3. Energy Drinks
- 5.1.4. Fruits & Vegetable Juice
- 5.1.5. Dairy-based Beverages
- 5.1.6. Others
- 5.2. Market Analysis, Insights and Forecast - by Distribution Channel
- 5.2.1. Supermarkets/Hypermarkets
- 5.2.2. Convenience Stores
- 5.2.3. Online Stores
- 5.2.4. Other Distribution Channels
- 5.3. Market Analysis, Insights and Forecast - by Geography
- 5.3.1. Brazil
- 5.3.2. Argentina
- 5.3.3. Rest of South America
- 5.4. Market Analysis, Insights and Forecast - by Region
- 5.4.1. Brazil
- 5.4.2. Argentina
- 5.4.3. Rest of South America
- 5.1. Market Analysis, Insights and Forecast - by Type
- 6. Brazil South America Ready to Drink Beverages Market Analysis, Insights and Forecast, 2019-2031
- 6.1. Market Analysis, Insights and Forecast - by Type
- 6.1.1. Tea
- 6.1.2. Coffee
- 6.1.3. Energy Drinks
- 6.1.4. Fruits & Vegetable Juice
- 6.1.5. Dairy-based Beverages
- 6.1.6. Others
- 6.2. Market Analysis, Insights and Forecast - by Distribution Channel
- 6.2.1. Supermarkets/Hypermarkets
- 6.2.2. Convenience Stores
- 6.2.3. Online Stores
- 6.2.4. Other Distribution Channels
- 6.3. Market Analysis, Insights and Forecast - by Geography
- 6.3.1. Brazil
- 6.3.2. Argentina
- 6.3.3. Rest of South America
- 6.1. Market Analysis, Insights and Forecast - by Type
- 7. Argentina South America Ready to Drink Beverages Market Analysis, Insights and Forecast, 2019-2031
- 7.1. Market Analysis, Insights and Forecast - by Type
- 7.1.1. Tea
- 7.1.2. Coffee
- 7.1.3. Energy Drinks
- 7.1.4. Fruits & Vegetable Juice
- 7.1.5. Dairy-based Beverages
- 7.1.6. Others
- 7.2. Market Analysis, Insights and Forecast - by Distribution Channel
- 7.2.1. Supermarkets/Hypermarkets
- 7.2.2. Convenience Stores
- 7.2.3. Online Stores
- 7.2.4. Other Distribution Channels
- 7.3. Market Analysis, Insights and Forecast - by Geography
- 7.3.1. Brazil
- 7.3.2. Argentina
- 7.3.3. Rest of South America
- 7.1. Market Analysis, Insights and Forecast - by Type
- 8. Rest of South America South America Ready to Drink Beverages Market Analysis, Insights and Forecast, 2019-2031
- 8.1. Market Analysis, Insights and Forecast - by Type
- 8.1.1. Tea
- 8.1.2. Coffee
- 8.1.3. Energy Drinks
- 8.1.4. Fruits & Vegetable Juice
- 8.1.5. Dairy-based Beverages
- 8.1.6. Others
- 8.2. Market Analysis, Insights and Forecast - by Distribution Channel
- 8.2.1. Supermarkets/Hypermarkets
- 8.2.2. Convenience Stores
- 8.2.3. Online Stores
- 8.2.4. Other Distribution Channels
- 8.3. Market Analysis, Insights and Forecast - by Geography
- 8.3.1. Brazil
- 8.3.2. Argentina
- 8.3.3. Rest of South America
- 8.1. Market Analysis, Insights and Forecast - by Type
- 9. Brazil South America Ready to Drink Beverages Market Analysis, Insights and Forecast, 2019-2031
- 10. Argentina South America Ready to Drink Beverages Market Analysis, Insights and Forecast, 2019-2031
- 11. Rest of South America South America Ready to Drink Beverages Market Analysis, Insights and Forecast, 2019-2031
- 12. Competitive Analysis
- 12.1. Market Share Analysis 2024
- 12.2. Company Profiles
- 12.2.1 Nestle SA
- 12.2.1.1. Overview
- 12.2.1.2. Products
- 12.2.1.3. SWOT Analysis
- 12.2.1.4. Recent Developments
- 12.2.1.5. Financials (Based on Availability)
- 12.2.2 WOW! Nutrition
- 12.2.2.1. Overview
- 12.2.2.2. Products
- 12.2.2.3. SWOT Analysis
- 12.2.2.4. Recent Developments
- 12.2.2.5. Financials (Based on Availability)
- 12.2.3 Monster Beverage Corporation
- 12.2.3.1. Overview
- 12.2.3.2. Products
- 12.2.3.3. SWOT Analysis
- 12.2.3.4. Recent Developments
- 12.2.3.5. Financials (Based on Availability)
- 12.2.4 PepsiCo Inc
- 12.2.4.1. Overview
- 12.2.4.2. Products
- 12.2.4.3. SWOT Analysis
- 12.2.4.4. Recent Developments
- 12.2.4.5. Financials (Based on Availability)
- 12.2.5 Unilever PLC
- 12.2.5.1. Overview
- 12.2.5.2. Products
- 12.2.5.3. SWOT Analysis
- 12.2.5.4. Recent Developments
- 12.2.5.5. Financials (Based on Availability)
- 12.2.6 Grupo Petropolis
- 12.2.6.1. Overview
- 12.2.6.2. Products
- 12.2.6.3. SWOT Analysis
- 12.2.6.4. Recent Developments
- 12.2.6.5. Financials (Based on Availability)
- 12.2.7 Red Bull GmbH
- 12.2.7.1. Overview
- 12.2.7.2. Products
- 12.2.7.3. SWOT Analysis
- 12.2.7.4. Recent Developments
- 12.2.7.5. Financials (Based on Availability)
- 12.2.8 The Coca-Cola Company
- 12.2.8.1. Overview
- 12.2.8.2. Products
- 12.2.8.3. SWOT Analysis
- 12.2.8.4. Recent Developments
- 12.2.8.5. Financials (Based on Availability)
- 12.2.9 Starbucks Corporation
- 12.2.9.1. Overview
- 12.2.9.2. Products
- 12.2.9.3. SWOT Analysis
- 12.2.9.4. Recent Developments
- 12.2.9.5. Financials (Based on Availability)
- 12.2.10 Ambev
- 12.2.10.1. Overview
- 12.2.10.2. Products
- 12.2.10.3. SWOT Analysis
- 12.2.10.4. Recent Developments
- 12.2.10.5. Financials (Based on Availability)
- 12.2.1 Nestle SA
List of Figures
- Figure 1: South America Ready to Drink Beverages Market Revenue Breakdown (Million, %) by Product 2024 & 2032
- Figure 2: South America Ready to Drink Beverages Market Share (%) by Company 2024
List of Tables
- Table 1: South America Ready to Drink Beverages Market Revenue Million Forecast, by Region 2019 & 2032
- Table 2: South America Ready to Drink Beverages Market Volume K Litres Forecast, by Region 2019 & 2032
- Table 3: South America Ready to Drink Beverages Market Revenue Million Forecast, by Type 2019 & 2032
- Table 4: South America Ready to Drink Beverages Market Volume K Litres Forecast, by Type 2019 & 2032
- Table 5: South America Ready to Drink Beverages Market Revenue Million Forecast, by Distribution Channel 2019 & 2032
- Table 6: South America Ready to Drink Beverages Market Volume K Litres Forecast, by Distribution Channel 2019 & 2032
- Table 7: South America Ready to Drink Beverages Market Revenue Million Forecast, by Geography 2019 & 2032
- Table 8: South America Ready to Drink Beverages Market Volume K Litres Forecast, by Geography 2019 & 2032
- Table 9: South America Ready to Drink Beverages Market Revenue Million Forecast, by Region 2019 & 2032
- Table 10: South America Ready to Drink Beverages Market Volume K Litres Forecast, by Region 2019 & 2032
- Table 11: South America Ready to Drink Beverages Market Revenue Million Forecast, by Country 2019 & 2032
- Table 12: South America Ready to Drink Beverages Market Volume K Litres Forecast, by Country 2019 & 2032
- Table 13: Brazil South America Ready to Drink Beverages Market Revenue (Million) Forecast, by Application 2019 & 2032
- Table 14: Brazil South America Ready to Drink Beverages Market Volume (K Litres) Forecast, by Application 2019 & 2032
- Table 15: Argentina South America Ready to Drink Beverages Market Revenue (Million) Forecast, by Application 2019 & 2032
- Table 16: Argentina South America Ready to Drink Beverages Market Volume (K Litres) Forecast, by Application 2019 & 2032
- Table 17: Rest of South America South America Ready to Drink Beverages Market Revenue (Million) Forecast, by Application 2019 & 2032
- Table 18: Rest of South America South America Ready to Drink Beverages Market Volume (K Litres) Forecast, by Application 2019 & 2032
- Table 19: South America Ready to Drink Beverages Market Revenue Million Forecast, by Type 2019 & 2032
- Table 20: South America Ready to Drink Beverages Market Volume K Litres Forecast, by Type 2019 & 2032
- Table 21: South America Ready to Drink Beverages Market Revenue Million Forecast, by Distribution Channel 2019 & 2032
- Table 22: South America Ready to Drink Beverages Market Volume K Litres Forecast, by Distribution Channel 2019 & 2032
- Table 23: South America Ready to Drink Beverages Market Revenue Million Forecast, by Geography 2019 & 2032
- Table 24: South America Ready to Drink Beverages Market Volume K Litres Forecast, by Geography 2019 & 2032
- Table 25: South America Ready to Drink Beverages Market Revenue Million Forecast, by Country 2019 & 2032
- Table 26: South America Ready to Drink Beverages Market Volume K Litres Forecast, by Country 2019 & 2032
- Table 27: South America Ready to Drink Beverages Market Revenue Million Forecast, by Type 2019 & 2032
- Table 28: South America Ready to Drink Beverages Market Volume K Litres Forecast, by Type 2019 & 2032
- Table 29: South America Ready to Drink Beverages Market Revenue Million Forecast, by Distribution Channel 2019 & 2032
- Table 30: South America Ready to Drink Beverages Market Volume K Litres Forecast, by Distribution Channel 2019 & 2032
- Table 31: South America Ready to Drink Beverages Market Revenue Million Forecast, by Geography 2019 & 2032
- Table 32: South America Ready to Drink Beverages Market Volume K Litres Forecast, by Geography 2019 & 2032
- Table 33: South America Ready to Drink Beverages Market Revenue Million Forecast, by Country 2019 & 2032
- Table 34: South America Ready to Drink Beverages Market Volume K Litres Forecast, by Country 2019 & 2032
- Table 35: South America Ready to Drink Beverages Market Revenue Million Forecast, by Type 2019 & 2032
- Table 36: South America Ready to Drink Beverages Market Volume K Litres Forecast, by Type 2019 & 2032
- Table 37: South America Ready to Drink Beverages Market Revenue Million Forecast, by Distribution Channel 2019 & 2032
- Table 38: South America Ready to Drink Beverages Market Volume K Litres Forecast, by Distribution Channel 2019 & 2032
- Table 39: South America Ready to Drink Beverages Market Revenue Million Forecast, by Geography 2019 & 2032
- Table 40: South America Ready to Drink Beverages Market Volume K Litres Forecast, by Geography 2019 & 2032
- Table 41: South America Ready to Drink Beverages Market Revenue Million Forecast, by Country 2019 & 2032
- Table 42: South America Ready to Drink Beverages Market Volume K Litres Forecast, by Country 2019 & 2032
Frequently Asked Questions
1. What is the projected Compound Annual Growth Rate (CAGR) of the South America Ready to Drink Beverages Market?
The projected CAGR is approximately 4.10%.
2. Which companies are prominent players in the South America Ready to Drink Beverages Market?
Key companies in the market include Nestle SA, WOW! Nutrition, Monster Beverage Corporation, PepsiCo Inc, Unilever PLC, Grupo Petropolis, Red Bull GmbH, The Coca-Cola Company, Starbucks Corporation, Ambev.
3. What are the main segments of the South America Ready to Drink Beverages Market?
The market segments include Type, Distribution Channel, Geography.
4. Can you provide details about the market size?
The market size is estimated to be USD XX Million as of 2022.
5. What are some drivers contributing to market growth?
Growing awareness about health and wellness has led to increased demand for healthier RTD options such as low-sugar low-calorie an d fortified beverages.
6. What are the notable trends driving market growth?
Trend towards personalized and customized RTD beverages with brands offering tailored solutions to meet individual preferences.
7. Are there any restraints impacting market growth?
High sugar content and artificial ingredients in some RTD beverages can lead to health concerns potentially limiting their appeal.
8. Can you provide examples of recent developments in the market?
In August 2022, Saudabille, a Brazilian company specializing in healthy juices, announced it is launching a complete line of products, featuring kid's favorite flavors: orange, grape, pineapple, tangerine, and apple, 200ml packaging, perfect size to fit kid's school lunch boxes, with 5 exciting emoji Brand designs.
9. What pricing options are available for accessing the report?
Pricing options include single-user, multi-user, and enterprise licenses priced at USD 4750, USD 5250, and USD 8750 respectively.
10. Is the market size provided in terms of value or volume?
The market size is provided in terms of value, measured in Million and volume, measured in K Litres.
11. Are there any specific market keywords associated with the report?
Yes, the market keyword associated with the report is "South America Ready to Drink Beverages Market," which aids in identifying and referencing the specific market segment covered.
12. How do I determine which pricing option suits my needs best?
The pricing options vary based on user requirements and access needs. Individual users may opt for single-user licenses, while businesses requiring broader access may choose multi-user or enterprise licenses for cost-effective access to the report.
13. Are there any additional resources or data provided in the South America Ready to Drink Beverages Market report?
While the report offers comprehensive insights, it's advisable to review the specific contents or supplementary materials provided to ascertain if additional resources or data are available.
14. How can I stay updated on further developments or reports in the South America Ready to Drink Beverages Market?
To stay informed about further developments, trends, and reports in the South America Ready to Drink Beverages Market, consider subscribing to industry newsletters, following relevant companies and organizations, or regularly checking reputable industry news sources and publications.
Methodology
Step 1 - Identification of Relevant Samples Size from Population Database


Step 2 - Approaches for Defining Global Market Size (Value, Volume* & Price*)

Note*: In applicable scenarios
Step 3 - Data Sources
Primary Research
- Web Analytics
- Survey Reports
- Research Institute
- Latest Research Reports
- Opinion Leaders
Secondary Research
- Annual Reports
- White Paper
- Latest Press Release
- Industry Association
- Paid Database
- Investor Presentations

Step 4 - Data Triangulation
Involves using different sources of information in order to increase the validity of a study
These sources are likely to be stakeholders in a program - participants, other researchers, program staff, other community members, and so on.
Then we put all data in single framework & apply various statistical tools to find out the dynamic on the market.
During the analysis stage, feedback from the stakeholder groups would be compared to determine areas of agreement as well as areas of divergence


