
Key Insights
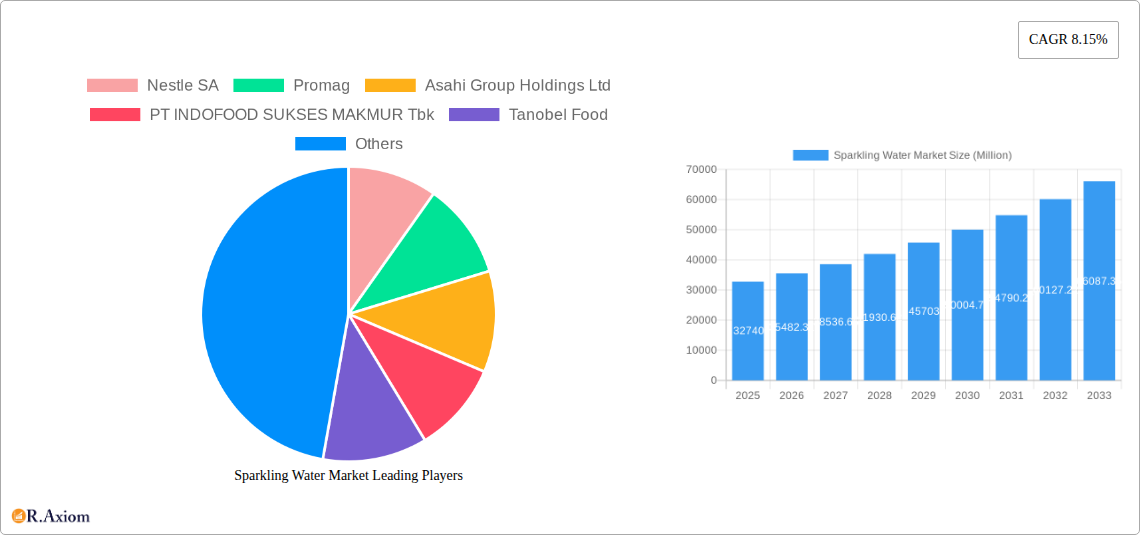
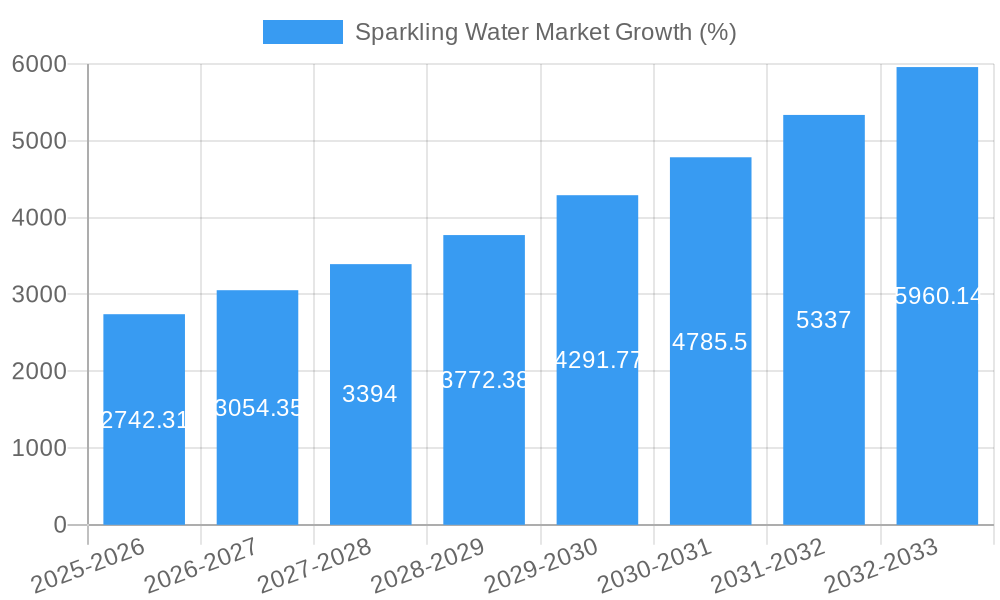
The sparkling water market, valued at $32,740 million in 2025, exhibits robust growth potential, projected to expand at a Compound Annual Growth Rate (CAGR) of 8.15% from 2025 to 2033. This expansion is driven by several key factors. Increasing health consciousness among consumers is fueling demand for healthier alternatives to sugary drinks. The rising prevalence of lifestyle diseases and a growing awareness of the negative impacts of excessive sugar intake are significant contributors. Furthermore, the market is witnessing innovation in flavors and functional additions, such as added vitamins or electrolytes, catering to diverse consumer preferences and expanding the market's appeal beyond its traditional demographic. The convenience of readily available sparkling water in various distribution channels, including supermarkets, convenience stores, and online retailers, further bolsters market growth. Competitive pressures from established beverage giants and emerging brands are leading to product diversification and aggressive marketing strategies, contributing to overall market dynamism.
The market segmentation reveals diverse opportunities. Within distribution channels, supermarkets and hypermarkets dominate, but online retailers are experiencing significant growth, reflecting the evolving consumer shopping habits. Product segmentation shows a preference towards still water; however, functional water is emerging as a high-growth segment, driven by its health benefits and added value proposition. Geographical variations in consumption patterns are expected, with Western European markets (United Kingdom, France, Spain, Italy, Germany) exhibiting relatively higher per capita consumption compared to others, although Eastern European markets like Russia present significant untapped potential. The ongoing expansion into emerging markets and the continued focus on product innovation and marketing will be crucial in driving future market growth. Competition is intense, with major players such as Nestlé, Coca-Cola, and Danone vying for market share through brand building, product differentiation, and strategic acquisitions. However, smaller, niche players are also gaining traction by offering specialized products and focusing on sustainable and ethical sourcing.
Sparkling Water Market: A Comprehensive Report (2019-2033)
This detailed report provides a comprehensive analysis of the global Sparkling Water Market, offering invaluable insights for industry stakeholders, investors, and strategic decision-makers. The report covers the period from 2019 to 2033, with a focus on the forecast period 2025-2033, using 2025 as the base year. The study incorporates meticulous analysis of market size, segmentation, growth drivers, challenges, and opportunities, along with a detailed competitive landscape. Market values are expressed in Millions.
Sparkling Water Market Concentration & Innovation
The global sparkling water market exhibits a moderately concentrated structure, with key players like Nestle SA, The Coca-Cola Company, and Danone S.A. holding significant market share. However, the market also features several regional and smaller players, indicating a dynamic competitive landscape. Innovation in the sparkling water market is driven by consumer demand for healthier alternatives, functional beverages, and sustainable packaging. Companies are investing heavily in research and development to introduce new flavors, enhance functionality (e.g., added vitamins, electrolytes), and adopt eco-friendly packaging materials.
- Market Concentration: The top 5 players account for approximately xx% of the global market share (2024 estimate).
- Innovation Drivers: Health & wellness trends, sustainable packaging, flavor diversification, functional water additions.
- Regulatory Frameworks: Vary across regions impacting labeling, ingredient regulations, and sustainability standards.
- Product Substitutes: Still water, carbonated soft drinks, fruit juices, and other beverages.
- End-User Trends: Growing preference for healthier alternatives, increasing demand for premium and functional waters.
- M&A Activities: The last five years have witnessed xx number of M&A deals in the sparkling water sector, with an estimated total value of $xx Million. These activities have primarily focused on expanding product portfolios, geographical reach, and strengthening brand presence.
Sparkling Water Market Industry Trends & Insights
The global sparkling water market is experiencing robust growth, driven by several key factors. The increasing health consciousness among consumers is a major catalyst, with sparkling water perceived as a healthier alternative to sugary soft drinks. The rising disposable incomes, especially in emerging economies, are fueling market expansion. Technological advancements in packaging and production are also contributing to growth. The market is witnessing a surge in demand for flavored and functional sparkling water, which offers added health benefits. The competitive landscape is dynamic, with both established players and new entrants vying for market share.
- CAGR (2025-2033): xx%
- Market Penetration: xx% in key markets by 2033 (estimated)
- Consumer Preferences: Shift towards healthier, natural, and functional beverages; growing preference for diverse flavors and premium brands.
- Competitive Dynamics: Intense competition driven by new product launches, marketing strategies, and price wars.
Dominant Markets & Segments in Sparkling Water Market
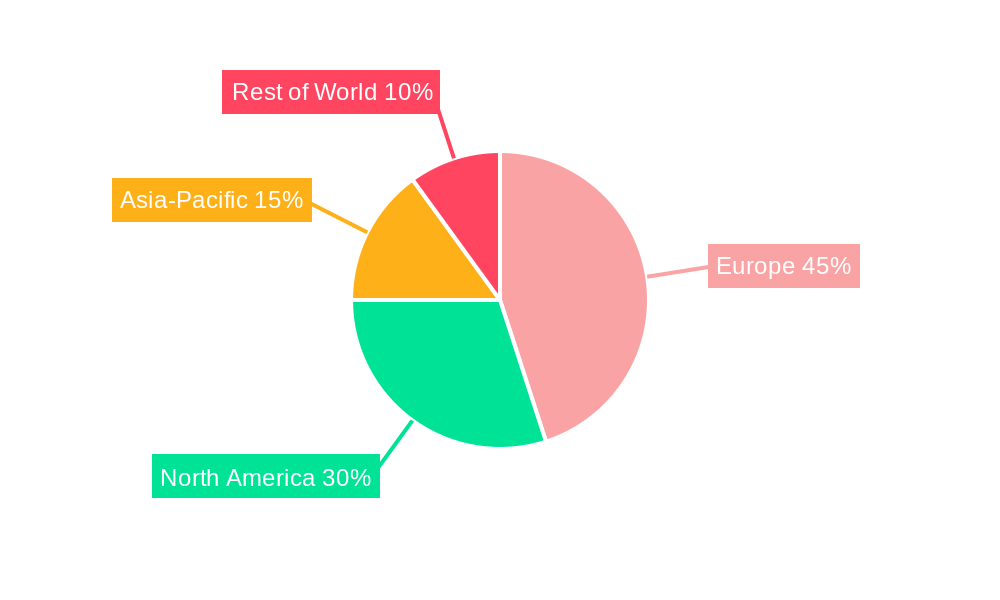
The North American region currently dominates the global sparkling water market, followed by Europe. Within these regions, specific countries like the United States and Germany exhibit particularly strong growth. In terms of segments, sparkling water accounts for the largest share of the market, followed by still water and functional water.
Leading Region: North America
Leading Country: United States
Dominant Segment (Type): Sparkling Water
Dominant Segment (Distribution Channel): Supermarkets/Hypermarkets
Key Drivers (North America): Strong health and wellness culture, high disposable incomes, established distribution networks.
Key Drivers (Europe): Growing awareness of health benefits, increasing demand for premium products, robust retail infrastructure.
Key Drivers (Asia-Pacific): Rapid urbanization, rising disposable incomes, increasing demand for healthier beverage options.
Sparkling Water Market Product Developments
Recent years have witnessed significant product innovation in the sparkling water market. Companies are introducing novel flavors, functional ingredients (vitamins, electrolytes), and sustainable packaging solutions. Technological advancements in production processes are improving efficiency and reducing costs. The focus is on creating value-added products that cater to specific consumer needs and preferences, such as low-sugar, organic, and natural options. The market is witnessing the rise of premium and artisanal sparkling waters, often with unique flavor profiles and higher price points.
Report Scope & Segmentation Analysis
This report comprehensively segments the sparkling water market based on type (Still Water, Sparkling Water, Functional Water) and distribution channel (Supermarkets/Hypermarkets, Convenience Stores, Online Retailers, On-trade, Other Distribution Channels). Each segment's market size, growth projections, and competitive dynamics are analyzed in detail. Detailed growth forecasts are provided for each segment across the forecast period, taking into account the anticipated shifts in consumer preferences and market trends. The report also assesses the competitive landscape within each segment, highlighting key players, their market share, and competitive strategies.
Key Drivers of Sparkling Water Market Growth
The sparkling water market's growth is driven by several factors: the increasing health consciousness among consumers seeking healthier alternatives to sugary drinks; rising disposable incomes in developing countries; the introduction of innovative flavors and functional benefits; and growing demand for sustainable and eco-friendly packaging. Government regulations promoting healthy lifestyles also support market growth.
Challenges in the Sparkling Water Market Sector
The sparkling water market faces challenges such as intense competition, fluctuating raw material prices, and stringent regulatory requirements regarding labeling and ingredients. Supply chain disruptions and the environmental impact of plastic packaging also pose significant challenges. The market volatility, dependent on consumer preferences and trends, presents further challenges.
Emerging Opportunities in Sparkling Water Market
Emerging opportunities include expansion into new geographical markets, particularly in developing economies; the development of innovative flavors and functional ingredients; and the adoption of sustainable packaging materials. Personalized products and the growing online retail channel also present significant opportunities for growth.
Leading Players in the Sparkling Water Market
- Nestle SA
- Promag
- Asahi Group Holdings Ltd
- PT INDOFOOD SUKSES MAKMUR Tbk
- Tanobel Food
- Fraser and Neave Limited
- Danone S A
- Blue Band
- The Coca-Cola Company
- Indo Food
- Kosme Group
Key Developments in Sparkling Water Market Industry
- June 2021: Nestlé Waters announced its commitment to responsible water management and collaboration with partners for regional solutions, aiming to revitalize regional water cycles with over 100 projects by 2025.
- January 2022: Danone-AQUA launched AQUA LIFE in Indonesia, using 100% recycled PET bottles, showcasing sustainable practices.
- August 2022: Kosme Group launched Jiwater in Indonesia, a natural artesian water with Japanese processing, emphasizing a pH range of 7.5-8.
Strategic Outlook for Sparkling Water Market
The sparkling water market is poised for continued growth, driven by evolving consumer preferences, technological advancements, and increasing health consciousness. The market will likely witness further consolidation through mergers and acquisitions, and new product innovations to cater to diverse consumer segments. Sustainable packaging and functional water will be key drivers of future growth.
Sparkling Water Market Segmentation
-
1. Type
- 1.1. Still Water
- 1.2. Sparkling Water
- 1.3. Functional Water
-
2. Distribution Channel
- 2.1. Supermarkets/Hypermarkets
- 2.2. Convenience Stores
- 2.3. Online Retailers
- 2.4. On-trade
- 2.5. Other Distribution Channels
Sparkling Water Market Segmentation By Geography
-
1. North America
- 1.1. United States
- 1.2. Canada
- 1.3. Mexico
-
2. South America
- 2.1. Brazil
- 2.2. Argentina
- 2.3. Rest of South America
-
3. Europe
- 3.1. United Kingdom
- 3.2. Germany
- 3.3. France
- 3.4. Italy
- 3.5. Spain
- 3.6. Russia
- 3.7. Benelux
- 3.8. Nordics
- 3.9. Rest of Europe
-
4. Middle East & Africa
- 4.1. Turkey
- 4.2. Israel
- 4.3. GCC
- 4.4. North Africa
- 4.5. South Africa
- 4.6. Rest of Middle East & Africa
-
5. Asia Pacific
- 5.1. China
- 5.2. India
- 5.3. Japan
- 5.4. South Korea
- 5.5. ASEAN
- 5.6. Oceania
- 5.7. Rest of Asia Pacific
Sparkling Water Market REPORT HIGHLIGHTS
| Aspects | Details |
|---|---|
| Study Period | 2019-2033 |
| Base Year | 2024 |
| Estimated Year | 2025 |
| Forecast Period | 2025-2033 |
| Historical Period | 2019-2024 |
| Growth Rate | CAGR of 8.15% from 2019-2033 |
| Segmentation |
|
Table of Contents
- 1. Introduction
- 1.1. Research Scope
- 1.2. Market Segmentation
- 1.3. Research Methodology
- 1.4. Definitions and Assumptions
- 2. Executive Summary
- 2.1. Introduction
- 3. Market Dynamics
- 3.1. Introduction
- 3.2. Market Drivers
- 3.2.1. Increasing Demand for Alcoholic Beverages; Health Conscious Consumers Accelerating Demand For Gluten-free Beer
- 3.3. Market Restrains
- 3.3.1. Threat From Other Alcoholic Beverages
- 3.4. Market Trends
- 3.4.1. Increasing Expenditure on Drinking Water Due to Lack of Safe Drinking Water Availability
- 4. Market Factor Analysis
- 4.1. Porters Five Forces
- 4.2. Supply/Value Chain
- 4.3. PESTEL analysis
- 4.4. Market Entropy
- 4.5. Patent/Trademark Analysis
- 5. Global Sparkling Water Market Analysis, Insights and Forecast, 2019-2031
- 5.1. Market Analysis, Insights and Forecast - by Type
- 5.1.1. Still Water
- 5.1.2. Sparkling Water
- 5.1.3. Functional Water
- 5.2. Market Analysis, Insights and Forecast - by Distribution Channel
- 5.2.1. Supermarkets/Hypermarkets
- 5.2.2. Convenience Stores
- 5.2.3. Online Retailers
- 5.2.4. On-trade
- 5.2.5. Other Distribution Channels
- 5.3. Market Analysis, Insights and Forecast - by Region
- 5.3.1. North America
- 5.3.2. South America
- 5.3.3. Europe
- 5.3.4. Middle East & Africa
- 5.3.5. Asia Pacific
- 5.1. Market Analysis, Insights and Forecast - by Type
- 6. North America Sparkling Water Market Analysis, Insights and Forecast, 2019-2031
- 6.1. Market Analysis, Insights and Forecast - by Type
- 6.1.1. Still Water
- 6.1.2. Sparkling Water
- 6.1.3. Functional Water
- 6.2. Market Analysis, Insights and Forecast - by Distribution Channel
- 6.2.1. Supermarkets/Hypermarkets
- 6.2.2. Convenience Stores
- 6.2.3. Online Retailers
- 6.2.4. On-trade
- 6.2.5. Other Distribution Channels
- 6.1. Market Analysis, Insights and Forecast - by Type
- 7. South America Sparkling Water Market Analysis, Insights and Forecast, 2019-2031
- 7.1. Market Analysis, Insights and Forecast - by Type
- 7.1.1. Still Water
- 7.1.2. Sparkling Water
- 7.1.3. Functional Water
- 7.2. Market Analysis, Insights and Forecast - by Distribution Channel
- 7.2.1. Supermarkets/Hypermarkets
- 7.2.2. Convenience Stores
- 7.2.3. Online Retailers
- 7.2.4. On-trade
- 7.2.5. Other Distribution Channels
- 7.1. Market Analysis, Insights and Forecast - by Type
- 8. Europe Sparkling Water Market Analysis, Insights and Forecast, 2019-2031
- 8.1. Market Analysis, Insights and Forecast - by Type
- 8.1.1. Still Water
- 8.1.2. Sparkling Water
- 8.1.3. Functional Water
- 8.2. Market Analysis, Insights and Forecast - by Distribution Channel
- 8.2.1. Supermarkets/Hypermarkets
- 8.2.2. Convenience Stores
- 8.2.3. Online Retailers
- 8.2.4. On-trade
- 8.2.5. Other Distribution Channels
- 8.1. Market Analysis, Insights and Forecast - by Type
- 9. Middle East & Africa Sparkling Water Market Analysis, Insights and Forecast, 2019-2031
- 9.1. Market Analysis, Insights and Forecast - by Type
- 9.1.1. Still Water
- 9.1.2. Sparkling Water
- 9.1.3. Functional Water
- 9.2. Market Analysis, Insights and Forecast - by Distribution Channel
- 9.2.1. Supermarkets/Hypermarkets
- 9.2.2. Convenience Stores
- 9.2.3. Online Retailers
- 9.2.4. On-trade
- 9.2.5. Other Distribution Channels
- 9.1. Market Analysis, Insights and Forecast - by Type
- 10. Asia Pacific Sparkling Water Market Analysis, Insights and Forecast, 2019-2031
- 10.1. Market Analysis, Insights and Forecast - by Type
- 10.1.1. Still Water
- 10.1.2. Sparkling Water
- 10.1.3. Functional Water
- 10.2. Market Analysis, Insights and Forecast - by Distribution Channel
- 10.2.1. Supermarkets/Hypermarkets
- 10.2.2. Convenience Stores
- 10.2.3. Online Retailers
- 10.2.4. On-trade
- 10.2.5. Other Distribution Channels
- 10.1. Market Analysis, Insights and Forecast - by Type
- 11. United Kingdom Sparkling Water Market Analysis, Insights and Forecast, 2019-2031
- 11.1. Market Analysis, Insights and Forecast - By Country/Sub-region
- 11.1.1.
- 12. France Sparkling Water Market Analysis, Insights and Forecast, 2019-2031
- 12.1. Market Analysis, Insights and Forecast - By Country/Sub-region
- 12.1.1.
- 13. Spain Sparkling Water Market Analysis, Insights and Forecast, 2019-2031
- 13.1. Market Analysis, Insights and Forecast - By Country/Sub-region
- 13.1.1.
- 14. Italy Sparkling Water Market Analysis, Insights and Forecast, 2019-2031
- 14.1. Market Analysis, Insights and Forecast - By Country/Sub-region
- 14.1.1.
- 15. Germany Sparkling Water Market Analysis, Insights and Forecast, 2019-2031
- 15.1. Market Analysis, Insights and Forecast - By Country/Sub-region
- 15.1.1.
- 16. Russia Sparkling Water Market Analysis, Insights and Forecast, 2019-2031
- 16.1. Market Analysis, Insights and Forecast - By Country/Sub-region
- 16.1.1.
- 17. Rest of Europe Sparkling Water Market Analysis, Insights and Forecast, 2019-2031
- 17.1. Market Analysis, Insights and Forecast - By Country/Sub-region
- 17.1.1.
- 18. Competitive Analysis
- 18.1. Global Market Share Analysis 2024
- 18.2. Company Profiles
- 18.2.1 Nestle SA
- 18.2.1.1. Overview
- 18.2.1.2. Products
- 18.2.1.3. SWOT Analysis
- 18.2.1.4. Recent Developments
- 18.2.1.5. Financials (Based on Availability)
- 18.2.2 Promag
- 18.2.2.1. Overview
- 18.2.2.2. Products
- 18.2.2.3. SWOT Analysis
- 18.2.2.4. Recent Developments
- 18.2.2.5. Financials (Based on Availability)
- 18.2.3 Asahi Group Holdings Ltd
- 18.2.3.1. Overview
- 18.2.3.2. Products
- 18.2.3.3. SWOT Analysis
- 18.2.3.4. Recent Developments
- 18.2.3.5. Financials (Based on Availability)
- 18.2.4 PT INDOFOOD SUKSES MAKMUR Tbk
- 18.2.4.1. Overview
- 18.2.4.2. Products
- 18.2.4.3. SWOT Analysis
- 18.2.4.4. Recent Developments
- 18.2.4.5. Financials (Based on Availability)
- 18.2.5 Tanobel Food
- 18.2.5.1. Overview
- 18.2.5.2. Products
- 18.2.5.3. SWOT Analysis
- 18.2.5.4. Recent Developments
- 18.2.5.5. Financials (Based on Availability)
- 18.2.6 Fraser and Neave Limited
- 18.2.6.1. Overview
- 18.2.6.2. Products
- 18.2.6.3. SWOT Analysis
- 18.2.6.4. Recent Developments
- 18.2.6.5. Financials (Based on Availability)
- 18.2.7 Danone S A
- 18.2.7.1. Overview
- 18.2.7.2. Products
- 18.2.7.3. SWOT Analysis
- 18.2.7.4. Recent Developments
- 18.2.7.5. Financials (Based on Availability)
- 18.2.8 Blue Band
- 18.2.8.1. Overview
- 18.2.8.2. Products
- 18.2.8.3. SWOT Analysis
- 18.2.8.4. Recent Developments
- 18.2.8.5. Financials (Based on Availability)
- 18.2.9 The Coca-Cola Company
- 18.2.9.1. Overview
- 18.2.9.2. Products
- 18.2.9.3. SWOT Analysis
- 18.2.9.4. Recent Developments
- 18.2.9.5. Financials (Based on Availability)
- 18.2.10 Indo Food
- 18.2.10.1. Overview
- 18.2.10.2. Products
- 18.2.10.3. SWOT Analysis
- 18.2.10.4. Recent Developments
- 18.2.10.5. Financials (Based on Availability)
- 18.2.11 Kosme Group*List Not Exhaustive
- 18.2.11.1. Overview
- 18.2.11.2. Products
- 18.2.11.3. SWOT Analysis
- 18.2.11.4. Recent Developments
- 18.2.11.5. Financials (Based on Availability)
- 18.2.1 Nestle SA
List of Figures
- Figure 1: Global Sparkling Water Market Revenue Breakdown (Million, %) by Region 2024 & 2032
- Figure 2: Global Sparkling Water Market Volume Breakdown (liter , %) by Region 2024 & 2032
- Figure 3: United Kingdom Sparkling Water Market Revenue (Million), by Country 2024 & 2032
- Figure 4: United Kingdom Sparkling Water Market Volume (liter ), by Country 2024 & 2032
- Figure 5: United Kingdom Sparkling Water Market Revenue Share (%), by Country 2024 & 2032
- Figure 6: United Kingdom Sparkling Water Market Volume Share (%), by Country 2024 & 2032
- Figure 7: France Sparkling Water Market Revenue (Million), by Country 2024 & 2032
- Figure 8: France Sparkling Water Market Volume (liter ), by Country 2024 & 2032
- Figure 9: France Sparkling Water Market Revenue Share (%), by Country 2024 & 2032
- Figure 10: France Sparkling Water Market Volume Share (%), by Country 2024 & 2032
- Figure 11: Spain Sparkling Water Market Revenue (Million), by Country 2024 & 2032
- Figure 12: Spain Sparkling Water Market Volume (liter ), by Country 2024 & 2032
- Figure 13: Spain Sparkling Water Market Revenue Share (%), by Country 2024 & 2032
- Figure 14: Spain Sparkling Water Market Volume Share (%), by Country 2024 & 2032
- Figure 15: Italy Sparkling Water Market Revenue (Million), by Country 2024 & 2032
- Figure 16: Italy Sparkling Water Market Volume (liter ), by Country 2024 & 2032
- Figure 17: Italy Sparkling Water Market Revenue Share (%), by Country 2024 & 2032
- Figure 18: Italy Sparkling Water Market Volume Share (%), by Country 2024 & 2032
- Figure 19: Germany Sparkling Water Market Revenue (Million), by Country 2024 & 2032
- Figure 20: Germany Sparkling Water Market Volume (liter ), by Country 2024 & 2032
- Figure 21: Germany Sparkling Water Market Revenue Share (%), by Country 2024 & 2032
- Figure 22: Germany Sparkling Water Market Volume Share (%), by Country 2024 & 2032
- Figure 23: Russia Sparkling Water Market Revenue (Million), by Country 2024 & 2032
- Figure 24: Russia Sparkling Water Market Volume (liter ), by Country 2024 & 2032
- Figure 25: Russia Sparkling Water Market Revenue Share (%), by Country 2024 & 2032
- Figure 26: Russia Sparkling Water Market Volume Share (%), by Country 2024 & 2032
- Figure 27: Rest of Europe Sparkling Water Market Revenue (Million), by Country 2024 & 2032
- Figure 28: Rest of Europe Sparkling Water Market Volume (liter ), by Country 2024 & 2032
- Figure 29: Rest of Europe Sparkling Water Market Revenue Share (%), by Country 2024 & 2032
- Figure 30: Rest of Europe Sparkling Water Market Volume Share (%), by Country 2024 & 2032
- Figure 31: North America Sparkling Water Market Revenue (Million), by Type 2024 & 2032
- Figure 32: North America Sparkling Water Market Volume (liter ), by Type 2024 & 2032
- Figure 33: North America Sparkling Water Market Revenue Share (%), by Type 2024 & 2032
- Figure 34: North America Sparkling Water Market Volume Share (%), by Type 2024 & 2032
- Figure 35: North America Sparkling Water Market Revenue (Million), by Distribution Channel 2024 & 2032
- Figure 36: North America Sparkling Water Market Volume (liter ), by Distribution Channel 2024 & 2032
- Figure 37: North America Sparkling Water Market Revenue Share (%), by Distribution Channel 2024 & 2032
- Figure 38: North America Sparkling Water Market Volume Share (%), by Distribution Channel 2024 & 2032
- Figure 39: North America Sparkling Water Market Revenue (Million), by Country 2024 & 2032
- Figure 40: North America Sparkling Water Market Volume (liter ), by Country 2024 & 2032
- Figure 41: North America Sparkling Water Market Revenue Share (%), by Country 2024 & 2032
- Figure 42: North America Sparkling Water Market Volume Share (%), by Country 2024 & 2032
- Figure 43: South America Sparkling Water Market Revenue (Million), by Type 2024 & 2032
- Figure 44: South America Sparkling Water Market Volume (liter ), by Type 2024 & 2032
- Figure 45: South America Sparkling Water Market Revenue Share (%), by Type 2024 & 2032
- Figure 46: South America Sparkling Water Market Volume Share (%), by Type 2024 & 2032
- Figure 47: South America Sparkling Water Market Revenue (Million), by Distribution Channel 2024 & 2032
- Figure 48: South America Sparkling Water Market Volume (liter ), by Distribution Channel 2024 & 2032
- Figure 49: South America Sparkling Water Market Revenue Share (%), by Distribution Channel 2024 & 2032
- Figure 50: South America Sparkling Water Market Volume Share (%), by Distribution Channel 2024 & 2032
- Figure 51: South America Sparkling Water Market Revenue (Million), by Country 2024 & 2032
- Figure 52: South America Sparkling Water Market Volume (liter ), by Country 2024 & 2032
- Figure 53: South America Sparkling Water Market Revenue Share (%), by Country 2024 & 2032
- Figure 54: South America Sparkling Water Market Volume Share (%), by Country 2024 & 2032
- Figure 55: Europe Sparkling Water Market Revenue (Million), by Type 2024 & 2032
- Figure 56: Europe Sparkling Water Market Volume (liter ), by Type 2024 & 2032
- Figure 57: Europe Sparkling Water Market Revenue Share (%), by Type 2024 & 2032
- Figure 58: Europe Sparkling Water Market Volume Share (%), by Type 2024 & 2032
- Figure 59: Europe Sparkling Water Market Revenue (Million), by Distribution Channel 2024 & 2032
- Figure 60: Europe Sparkling Water Market Volume (liter ), by Distribution Channel 2024 & 2032
- Figure 61: Europe Sparkling Water Market Revenue Share (%), by Distribution Channel 2024 & 2032
- Figure 62: Europe Sparkling Water Market Volume Share (%), by Distribution Channel 2024 & 2032
- Figure 63: Europe Sparkling Water Market Revenue (Million), by Country 2024 & 2032
- Figure 64: Europe Sparkling Water Market Volume (liter ), by Country 2024 & 2032
- Figure 65: Europe Sparkling Water Market Revenue Share (%), by Country 2024 & 2032
- Figure 66: Europe Sparkling Water Market Volume Share (%), by Country 2024 & 2032
- Figure 67: Middle East & Africa Sparkling Water Market Revenue (Million), by Type 2024 & 2032
- Figure 68: Middle East & Africa Sparkling Water Market Volume (liter ), by Type 2024 & 2032
- Figure 69: Middle East & Africa Sparkling Water Market Revenue Share (%), by Type 2024 & 2032
- Figure 70: Middle East & Africa Sparkling Water Market Volume Share (%), by Type 2024 & 2032
- Figure 71: Middle East & Africa Sparkling Water Market Revenue (Million), by Distribution Channel 2024 & 2032
- Figure 72: Middle East & Africa Sparkling Water Market Volume (liter ), by Distribution Channel 2024 & 2032
- Figure 73: Middle East & Africa Sparkling Water Market Revenue Share (%), by Distribution Channel 2024 & 2032
- Figure 74: Middle East & Africa Sparkling Water Market Volume Share (%), by Distribution Channel 2024 & 2032
- Figure 75: Middle East & Africa Sparkling Water Market Revenue (Million), by Country 2024 & 2032
- Figure 76: Middle East & Africa Sparkling Water Market Volume (liter ), by Country 2024 & 2032
- Figure 77: Middle East & Africa Sparkling Water Market Revenue Share (%), by Country 2024 & 2032
- Figure 78: Middle East & Africa Sparkling Water Market Volume Share (%), by Country 2024 & 2032
- Figure 79: Asia Pacific Sparkling Water Market Revenue (Million), by Type 2024 & 2032
- Figure 80: Asia Pacific Sparkling Water Market Volume (liter ), by Type 2024 & 2032
- Figure 81: Asia Pacific Sparkling Water Market Revenue Share (%), by Type 2024 & 2032
- Figure 82: Asia Pacific Sparkling Water Market Volume Share (%), by Type 2024 & 2032
- Figure 83: Asia Pacific Sparkling Water Market Revenue (Million), by Distribution Channel 2024 & 2032
- Figure 84: Asia Pacific Sparkling Water Market Volume (liter ), by Distribution Channel 2024 & 2032
- Figure 85: Asia Pacific Sparkling Water Market Revenue Share (%), by Distribution Channel 2024 & 2032
- Figure 86: Asia Pacific Sparkling Water Market Volume Share (%), by Distribution Channel 2024 & 2032
- Figure 87: Asia Pacific Sparkling Water Market Revenue (Million), by Country 2024 & 2032
- Figure 88: Asia Pacific Sparkling Water Market Volume (liter ), by Country 2024 & 2032
- Figure 89: Asia Pacific Sparkling Water Market Revenue Share (%), by Country 2024 & 2032
- Figure 90: Asia Pacific Sparkling Water Market Volume Share (%), by Country 2024 & 2032
List of Tables
- Table 1: Global Sparkling Water Market Revenue Million Forecast, by Region 2019 & 2032
- Table 2: Global Sparkling Water Market Volume liter Forecast, by Region 2019 & 2032
- Table 3: Global Sparkling Water Market Revenue Million Forecast, by Type 2019 & 2032
- Table 4: Global Sparkling Water Market Volume liter Forecast, by Type 2019 & 2032
- Table 5: Global Sparkling Water Market Revenue Million Forecast, by Distribution Channel 2019 & 2032
- Table 6: Global Sparkling Water Market Volume liter Forecast, by Distribution Channel 2019 & 2032
- Table 7: Global Sparkling Water Market Revenue Million Forecast, by Region 2019 & 2032
- Table 8: Global Sparkling Water Market Volume liter Forecast, by Region 2019 & 2032
- Table 9: Global Sparkling Water Market Revenue Million Forecast, by Country 2019 & 2032
- Table 10: Global Sparkling Water Market Volume liter Forecast, by Country 2019 & 2032
- Table 11: Sparkling Water Market Revenue (Million) Forecast, by Application 2019 & 2032
- Table 12: Sparkling Water Market Volume (liter ) Forecast, by Application 2019 & 2032
- Table 13: Global Sparkling Water Market Revenue Million Forecast, by Country 2019 & 2032
- Table 14: Global Sparkling Water Market Volume liter Forecast, by Country 2019 & 2032
- Table 15: Sparkling Water Market Revenue (Million) Forecast, by Application 2019 & 2032
- Table 16: Sparkling Water Market Volume (liter ) Forecast, by Application 2019 & 2032
- Table 17: Global Sparkling Water Market Revenue Million Forecast, by Country 2019 & 2032
- Table 18: Global Sparkling Water Market Volume liter Forecast, by Country 2019 & 2032
- Table 19: Sparkling Water Market Revenue (Million) Forecast, by Application 2019 & 2032
- Table 20: Sparkling Water Market Volume (liter ) Forecast, by Application 2019 & 2032
- Table 21: Global Sparkling Water Market Revenue Million Forecast, by Country 2019 & 2032
- Table 22: Global Sparkling Water Market Volume liter Forecast, by Country 2019 & 2032
- Table 23: Sparkling Water Market Revenue (Million) Forecast, by Application 2019 & 2032
- Table 24: Sparkling Water Market Volume (liter ) Forecast, by Application 2019 & 2032
- Table 25: Global Sparkling Water Market Revenue Million Forecast, by Country 2019 & 2032
- Table 26: Global Sparkling Water Market Volume liter Forecast, by Country 2019 & 2032
- Table 27: Sparkling Water Market Revenue (Million) Forecast, by Application 2019 & 2032
- Table 28: Sparkling Water Market Volume (liter ) Forecast, by Application 2019 & 2032
- Table 29: Global Sparkling Water Market Revenue Million Forecast, by Country 2019 & 2032
- Table 30: Global Sparkling Water Market Volume liter Forecast, by Country 2019 & 2032
- Table 31: Sparkling Water Market Revenue (Million) Forecast, by Application 2019 & 2032
- Table 32: Sparkling Water Market Volume (liter ) Forecast, by Application 2019 & 2032
- Table 33: Global Sparkling Water Market Revenue Million Forecast, by Country 2019 & 2032
- Table 34: Global Sparkling Water Market Volume liter Forecast, by Country 2019 & 2032
- Table 35: Sparkling Water Market Revenue (Million) Forecast, by Application 2019 & 2032
- Table 36: Sparkling Water Market Volume (liter ) Forecast, by Application 2019 & 2032
- Table 37: Global Sparkling Water Market Revenue Million Forecast, by Type 2019 & 2032
- Table 38: Global Sparkling Water Market Volume liter Forecast, by Type 2019 & 2032
- Table 39: Global Sparkling Water Market Revenue Million Forecast, by Distribution Channel 2019 & 2032
- Table 40: Global Sparkling Water Market Volume liter Forecast, by Distribution Channel 2019 & 2032
- Table 41: Global Sparkling Water Market Revenue Million Forecast, by Country 2019 & 2032
- Table 42: Global Sparkling Water Market Volume liter Forecast, by Country 2019 & 2032
- Table 43: United States Sparkling Water Market Revenue (Million) Forecast, by Application 2019 & 2032
- Table 44: United States Sparkling Water Market Volume (liter ) Forecast, by Application 2019 & 2032
- Table 45: Canada Sparkling Water Market Revenue (Million) Forecast, by Application 2019 & 2032
- Table 46: Canada Sparkling Water Market Volume (liter ) Forecast, by Application 2019 & 2032
- Table 47: Mexico Sparkling Water Market Revenue (Million) Forecast, by Application 2019 & 2032
- Table 48: Mexico Sparkling Water Market Volume (liter ) Forecast, by Application 2019 & 2032
- Table 49: Global Sparkling Water Market Revenue Million Forecast, by Type 2019 & 2032
- Table 50: Global Sparkling Water Market Volume liter Forecast, by Type 2019 & 2032
- Table 51: Global Sparkling Water Market Revenue Million Forecast, by Distribution Channel 2019 & 2032
- Table 52: Global Sparkling Water Market Volume liter Forecast, by Distribution Channel 2019 & 2032
- Table 53: Global Sparkling Water Market Revenue Million Forecast, by Country 2019 & 2032
- Table 54: Global Sparkling Water Market Volume liter Forecast, by Country 2019 & 2032
- Table 55: Brazil Sparkling Water Market Revenue (Million) Forecast, by Application 2019 & 2032
- Table 56: Brazil Sparkling Water Market Volume (liter ) Forecast, by Application 2019 & 2032
- Table 57: Argentina Sparkling Water Market Revenue (Million) Forecast, by Application 2019 & 2032
- Table 58: Argentina Sparkling Water Market Volume (liter ) Forecast, by Application 2019 & 2032
- Table 59: Rest of South America Sparkling Water Market Revenue (Million) Forecast, by Application 2019 & 2032
- Table 60: Rest of South America Sparkling Water Market Volume (liter ) Forecast, by Application 2019 & 2032
- Table 61: Global Sparkling Water Market Revenue Million Forecast, by Type 2019 & 2032
- Table 62: Global Sparkling Water Market Volume liter Forecast, by Type 2019 & 2032
- Table 63: Global Sparkling Water Market Revenue Million Forecast, by Distribution Channel 2019 & 2032
- Table 64: Global Sparkling Water Market Volume liter Forecast, by Distribution Channel 2019 & 2032
- Table 65: Global Sparkling Water Market Revenue Million Forecast, by Country 2019 & 2032
- Table 66: Global Sparkling Water Market Volume liter Forecast, by Country 2019 & 2032
- Table 67: United Kingdom Sparkling Water Market Revenue (Million) Forecast, by Application 2019 & 2032
- Table 68: United Kingdom Sparkling Water Market Volume (liter ) Forecast, by Application 2019 & 2032
- Table 69: Germany Sparkling Water Market Revenue (Million) Forecast, by Application 2019 & 2032
- Table 70: Germany Sparkling Water Market Volume (liter ) Forecast, by Application 2019 & 2032
- Table 71: France Sparkling Water Market Revenue (Million) Forecast, by Application 2019 & 2032
- Table 72: France Sparkling Water Market Volume (liter ) Forecast, by Application 2019 & 2032
- Table 73: Italy Sparkling Water Market Revenue (Million) Forecast, by Application 2019 & 2032
- Table 74: Italy Sparkling Water Market Volume (liter ) Forecast, by Application 2019 & 2032
- Table 75: Spain Sparkling Water Market Revenue (Million) Forecast, by Application 2019 & 2032
- Table 76: Spain Sparkling Water Market Volume (liter ) Forecast, by Application 2019 & 2032
- Table 77: Russia Sparkling Water Market Revenue (Million) Forecast, by Application 2019 & 2032
- Table 78: Russia Sparkling Water Market Volume (liter ) Forecast, by Application 2019 & 2032
- Table 79: Benelux Sparkling Water Market Revenue (Million) Forecast, by Application 2019 & 2032
- Table 80: Benelux Sparkling Water Market Volume (liter ) Forecast, by Application 2019 & 2032
- Table 81: Nordics Sparkling Water Market Revenue (Million) Forecast, by Application 2019 & 2032
- Table 82: Nordics Sparkling Water Market Volume (liter ) Forecast, by Application 2019 & 2032
- Table 83: Rest of Europe Sparkling Water Market Revenue (Million) Forecast, by Application 2019 & 2032
- Table 84: Rest of Europe Sparkling Water Market Volume (liter ) Forecast, by Application 2019 & 2032
- Table 85: Global Sparkling Water Market Revenue Million Forecast, by Type 2019 & 2032
- Table 86: Global Sparkling Water Market Volume liter Forecast, by Type 2019 & 2032
- Table 87: Global Sparkling Water Market Revenue Million Forecast, by Distribution Channel 2019 & 2032
- Table 88: Global Sparkling Water Market Volume liter Forecast, by Distribution Channel 2019 & 2032
- Table 89: Global Sparkling Water Market Revenue Million Forecast, by Country 2019 & 2032
- Table 90: Global Sparkling Water Market Volume liter Forecast, by Country 2019 & 2032
- Table 91: Turkey Sparkling Water Market Revenue (Million) Forecast, by Application 2019 & 2032
- Table 92: Turkey Sparkling Water Market Volume (liter ) Forecast, by Application 2019 & 2032
- Table 93: Israel Sparkling Water Market Revenue (Million) Forecast, by Application 2019 & 2032
- Table 94: Israel Sparkling Water Market Volume (liter ) Forecast, by Application 2019 & 2032
- Table 95: GCC Sparkling Water Market Revenue (Million) Forecast, by Application 2019 & 2032
- Table 96: GCC Sparkling Water Market Volume (liter ) Forecast, by Application 2019 & 2032
- Table 97: North Africa Sparkling Water Market Revenue (Million) Forecast, by Application 2019 & 2032
- Table 98: North Africa Sparkling Water Market Volume (liter ) Forecast, by Application 2019 & 2032
- Table 99: South Africa Sparkling Water Market Revenue (Million) Forecast, by Application 2019 & 2032
- Table 100: South Africa Sparkling Water Market Volume (liter ) Forecast, by Application 2019 & 2032
- Table 101: Rest of Middle East & Africa Sparkling Water Market Revenue (Million) Forecast, by Application 2019 & 2032
- Table 102: Rest of Middle East & Africa Sparkling Water Market Volume (liter ) Forecast, by Application 2019 & 2032
- Table 103: Global Sparkling Water Market Revenue Million Forecast, by Type 2019 & 2032
- Table 104: Global Sparkling Water Market Volume liter Forecast, by Type 2019 & 2032
- Table 105: Global Sparkling Water Market Revenue Million Forecast, by Distribution Channel 2019 & 2032
- Table 106: Global Sparkling Water Market Volume liter Forecast, by Distribution Channel 2019 & 2032
- Table 107: Global Sparkling Water Market Revenue Million Forecast, by Country 2019 & 2032
- Table 108: Global Sparkling Water Market Volume liter Forecast, by Country 2019 & 2032
- Table 109: China Sparkling Water Market Revenue (Million) Forecast, by Application 2019 & 2032
- Table 110: China Sparkling Water Market Volume (liter ) Forecast, by Application 2019 & 2032
- Table 111: India Sparkling Water Market Revenue (Million) Forecast, by Application 2019 & 2032
- Table 112: India Sparkling Water Market Volume (liter ) Forecast, by Application 2019 & 2032
- Table 113: Japan Sparkling Water Market Revenue (Million) Forecast, by Application 2019 & 2032
- Table 114: Japan Sparkling Water Market Volume (liter ) Forecast, by Application 2019 & 2032
- Table 115: South Korea Sparkling Water Market Revenue (Million) Forecast, by Application 2019 & 2032
- Table 116: South Korea Sparkling Water Market Volume (liter ) Forecast, by Application 2019 & 2032
- Table 117: ASEAN Sparkling Water Market Revenue (Million) Forecast, by Application 2019 & 2032
- Table 118: ASEAN Sparkling Water Market Volume (liter ) Forecast, by Application 2019 & 2032
- Table 119: Oceania Sparkling Water Market Revenue (Million) Forecast, by Application 2019 & 2032
- Table 120: Oceania Sparkling Water Market Volume (liter ) Forecast, by Application 2019 & 2032
- Table 121: Rest of Asia Pacific Sparkling Water Market Revenue (Million) Forecast, by Application 2019 & 2032
- Table 122: Rest of Asia Pacific Sparkling Water Market Volume (liter ) Forecast, by Application 2019 & 2032
Frequently Asked Questions
1. What is the projected Compound Annual Growth Rate (CAGR) of the Sparkling Water Market?
The projected CAGR is approximately 8.15%.
2. Which companies are prominent players in the Sparkling Water Market?
Key companies in the market include Nestle SA, Promag, Asahi Group Holdings Ltd, PT INDOFOOD SUKSES MAKMUR Tbk, Tanobel Food, Fraser and Neave Limited, Danone S A, Blue Band, The Coca-Cola Company, Indo Food, Kosme Group*List Not Exhaustive.
3. What are the main segments of the Sparkling Water Market?
The market segments include Type, Distribution Channel.
4. Can you provide details about the market size?
The market size is estimated to be USD 32740 Million as of 2022.
5. What are some drivers contributing to market growth?
Increasing Demand for Alcoholic Beverages; Health Conscious Consumers Accelerating Demand For Gluten-free Beer.
6. What are the notable trends driving market growth?
Increasing Expenditure on Drinking Water Due to Lack of Safe Drinking Water Availability.
7. Are there any restraints impacting market growth?
Threat From Other Alcoholic Beverages.
8. Can you provide examples of recent developments in the market?
August 2022: Kosme Group has launched Jiwater in Indonesia. Jiwater is natural artesian water that has undergone Japanese technological processing. The pH range of the new mineral water is between 7.5 and 8.
9. What pricing options are available for accessing the report?
Pricing options include single-user, multi-user, and enterprise licenses priced at USD 3800, USD 4500, and USD 5800 respectively.
10. Is the market size provided in terms of value or volume?
The market size is provided in terms of value, measured in Million and volume, measured in liter .
11. Are there any specific market keywords associated with the report?
Yes, the market keyword associated with the report is "Sparkling Water Market," which aids in identifying and referencing the specific market segment covered.
12. How do I determine which pricing option suits my needs best?
The pricing options vary based on user requirements and access needs. Individual users may opt for single-user licenses, while businesses requiring broader access may choose multi-user or enterprise licenses for cost-effective access to the report.
13. Are there any additional resources or data provided in the Sparkling Water Market report?
While the report offers comprehensive insights, it's advisable to review the specific contents or supplementary materials provided to ascertain if additional resources or data are available.
14. How can I stay updated on further developments or reports in the Sparkling Water Market?
To stay informed about further developments, trends, and reports in the Sparkling Water Market, consider subscribing to industry newsletters, following relevant companies and organizations, or regularly checking reputable industry news sources and publications.
Methodology
Step 1 - Identification of Relevant Samples Size from Population Database


Step 2 - Approaches for Defining Global Market Size (Value, Volume* & Price*)

Note*: In applicable scenarios
Step 3 - Data Sources
Primary Research
- Web Analytics
- Survey Reports
- Research Institute
- Latest Research Reports
- Opinion Leaders
Secondary Research
- Annual Reports
- White Paper
- Latest Press Release
- Industry Association
- Paid Database
- Investor Presentations

Step 4 - Data Triangulation
Involves using different sources of information in order to increase the validity of a study
These sources are likely to be stakeholders in a program - participants, other researchers, program staff, other community members, and so on.
Then we put all data in single framework & apply various statistical tools to find out the dynamic on the market.
During the analysis stage, feedback from the stakeholder groups would be compared to determine areas of agreement as well as areas of divergence


