

Key Insights
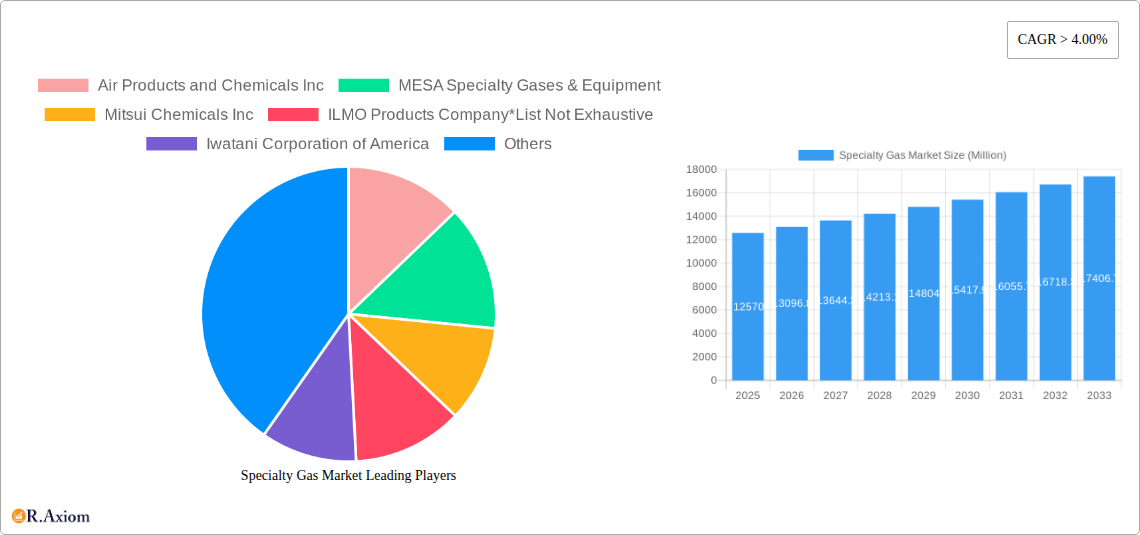
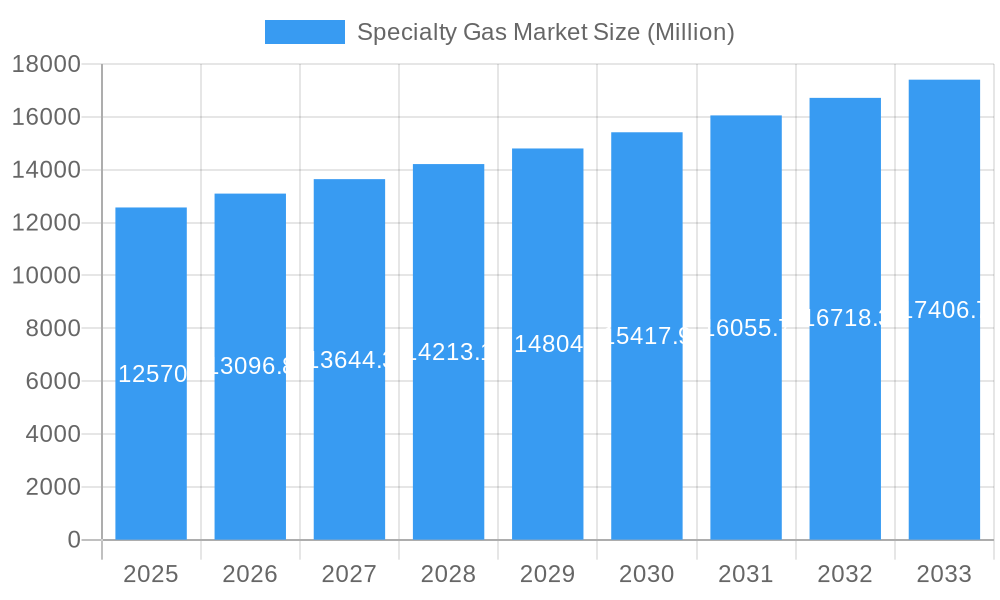
The specialty gas market, valued at $12,570 million in 2025, is projected to experience robust growth, exhibiting a Compound Annual Growth Rate (CAGR) exceeding 4.00% from 2025 to 2033. This expansion is fueled by several key drivers. The burgeoning electronics industry, particularly in semiconductor manufacturing and display technologies, necessitates high-purity gases for various processes, significantly boosting market demand. Similarly, the automotive sector's increasing adoption of advanced driver-assistance systems (ADAS) and electric vehicles (EVs) creates heightened demand for specialized gases used in manufacturing components and fuel cells. The medical and healthcare sector relies heavily on specialty gases for medical equipment sterilization, analytical testing, and therapeutic applications, further contributing to market growth. Furthermore, rising environmental regulations are pushing industries toward cleaner processes, increasing the demand for gases with reduced environmental impact. Growth is expected to be particularly strong in the Asia-Pacific region, driven by rapid industrialization and economic expansion in countries like China and India.
Specialty Gas Market Market Size (In Billion)
However, market growth is not without its challenges. Fluctuations in raw material prices, particularly for rare gases, can significantly impact profitability. Stringent safety regulations and the need for specialized handling and storage infrastructure present operational complexities and potentially increase costs. Competition among established players and emerging regional producers also necessitates strategic innovation and efficient cost management to maintain market share. Despite these constraints, the long-term outlook for the specialty gas market remains positive, driven by technological advancements and sustained demand across diverse end-user industries. The continued focus on sustainability and the rising need for precision in various manufacturing sectors will act as catalysts for market growth in the forecast period.
Specialty Gas Market Company Market Share
Specialty Gas Market: A Comprehensive Report (2019-2033)
This in-depth report provides a comprehensive analysis of the global Specialty Gas Market, covering the period from 2019 to 2033. It offers invaluable insights into market dynamics, competitive landscape, and future growth prospects, empowering stakeholders to make informed strategic decisions. The report leverages extensive primary and secondary research, incorporating detailed data analysis and expert opinions to deliver actionable intelligence. The base year for this report is 2025, with an estimated year of 2025 and a forecast period spanning 2025-2033. The historical period covered is 2019-2024.
Specialty Gas Market Concentration & Innovation
The specialty gas market exhibits a moderately concentrated landscape, dominated by a few multinational players alongside several regional specialists. Major players such as Air Products and Chemicals Inc, Linde plc, Air Liquide, and Messer Group GmbH hold significant market share, often exceeding xx% collectively. This concentration is driven by substantial investments in research and development, extensive distribution networks, and economies of scale. However, smaller, niche players thrive by focusing on specific gas types or end-user industries, exhibiting robust innovation in specialized applications.
Market Concentration Metrics:
- Global Market Share (Top 5 players): xx% (Estimated 2025)
- Average M&A Deal Value (2019-2024): $xx Million (Estimated)
Innovation Drivers:
- Stringent regulatory compliance driving demand for high-purity gases.
- Technological advancements in gas separation and purification techniques.
- Growing demand for specialized gases across diverse industries.
Regulatory Frameworks & Product Substitutes:
- Environmental regulations influence the adoption of sustainable practices and cleaner gas production methods.
- The presence of limited direct substitutes for certain specialized gases limits price competition.
End-User Trends & M&A Activities:
- Shifting end-user preferences toward high-purity and specialized gases in key sectors such as electronics and healthcare.
- Increased M&A activity reflects consolidation trends in the market, with larger players seeking to expand their product portfolios and geographical reach.
Specialty Gas Market Industry Trends & Insights
The specialty gas market is witnessing robust growth, driven by several key factors. The rising demand for advanced materials in various sectors (electronics, healthcare) fuels the need for high-purity gases. Technological advancements in gas separation and purification methods are enabling the production of increasingly specialized gases at competitive costs. Furthermore, stringent environmental regulations are pushing industries towards cleaner gas options, accelerating the adoption of sustainable production methods. The market is exhibiting a Compound Annual Growth Rate (CAGR) of xx% during the forecast period (2025-2033), with notable penetration in sectors like automotive and electronics manufacturing. Competitive dynamics are characterized by both aggressive pricing strategies and innovative product launches, leading to market share fluctuations among key players.
Dominant Markets & Segments in Specialty Gas Market
The Asia-Pacific region is the leading market for specialty gases, driven by rapid industrialization, particularly in electronics manufacturing and automotive sectors. Within the Type segment, High-purity gases and noble gases dominate, due to their critical applications in various technologies. In terms of End-User Industries, the electronics and medical sectors are major contributors to market growth, reflecting their high reliance on specialized gas products for processes and manufacturing.
Key Drivers (By Region/Segment):
- Asia-Pacific: Rapid industrialization, rising disposable incomes, and supportive government policies.
- North America: High technological advancements, strong research and development investments, and stringent environmental regulations.
- Europe: Established industrial base, increasing focus on sustainable practices, and robust regulatory frameworks.
- High-Purity Gases: Demand driven by stringent quality requirements in semiconductors, pharmaceuticals, and analytical testing.
- Noble Gases: Critical applications in advanced lighting, medical imaging, and scientific research.
- Electronics Sector: Growing demand for high-purity gases in semiconductor manufacturing and advanced electronics production.
- Medical and Healthcare Sector: Rising demand for specialty gases in medical equipment, drug manufacturing, and medical research.
Dominance Analysis:
The dominance of Asia-Pacific in the specialty gas market reflects the region's rapid economic growth and increasing industrial activity. Similarly, the prominence of high-purity and noble gases underscores the importance of precision and specialized applications across various sectors. The electronics and medical sectors' strong growth signifies the increasing reliance on sophisticated gas products in high-technology applications.
Specialty Gas Market Product Developments
Recent innovations center on developing more efficient and sustainable gas production methods, including advanced membrane separation technologies and cryogenic processes. This focus on sustainability aligns with stricter environmental regulations and growing consumer awareness. New product introductions include enhanced nitrogen membrane systems for oil and gas applications (like Air Products' PRISM InertPro), highlighting the drive for improved efficiency and reduced emissions. These innovations offer competitive advantages through improved process efficiency, reduced operational costs, and enhanced environmental compliance.
Report Scope & Segmentation Analysis
The report comprehensively segments the specialty gas market based on Type (High-purity Gases, Noble Gases, Carbon Gases, Halogen Gases, Other Types) and End-User Industry (Automotive, Electronics, Medical and Healthcare, Food and Beverage, Oil and Gas, Other End-User Industries). Each segment's growth projections, market size estimates, and competitive dynamics are detailed within the report.
Type Segment: Each type segment is analyzed for its unique characteristics, applications, and market trends. For example, the high-purity gas segment is projected to maintain a substantial market share owing to its indispensable role in advanced manufacturing processes.
End-User Industry Segment: Each end-user industry segment's consumption patterns, growth drivers, and specific demands for specialty gases are examined. The electronics industry, for instance, stands out as a major consumer due to the high purity standards required for semiconductor manufacturing.
Key Drivers of Specialty Gas Market Growth
Technological advancements in gas separation and purification, coupled with growing demand across diverse industries, are key growth drivers. Stringent environmental regulations are pushing for cleaner production methods, while increasing investments in R&D are fuelling innovations in gas applications. Economic growth, particularly in developing economies, further enhances the market's expansion.
Challenges in the Specialty Gas Market Sector
The specialty gas market faces challenges such as fluctuating raw material prices, stringent regulatory compliance requirements, and intense competition. Supply chain disruptions can impact production and delivery, while the high capital investment required for advanced production facilities presents a barrier to entry for new players. Furthermore, price pressure from established players can constrain margins for smaller competitors.
Emerging Opportunities in Specialty Gas Market
Emerging opportunities lie in expanding into new applications within existing industries and venturing into novel markets, such as renewable energy and advanced materials. Technological breakthroughs in gas separation and purification create avenues for cost-effective and environmentally friendly production. Growing demand for specialty gases in emerging economies presents a significant market expansion opportunity.
Leading Players in the Specialty Gas Market Market
- Air Products and Chemicals Inc
- MESA Specialty Gases & Equipment
- Mitsui Chemicals Inc
- ILMO Products Company
- Iwatani Corporation of America
- Linde plc
- Messer Group GmbH
- Air Liquide
- Norco Inc
- YUEYANG KAIMEITE ELECTRONIC AND SPECLALTY RARE GASES CO
- SHOWA DENKO K K
- Coregas
Key Developments in Specialty Gas Market Industry
- February 2023: Linde announced a long-term agreement with OCI to supply clean hydrogen and other industrial gases to OCI's new blue ammonia factory in Beaumont, Texas. This highlights the growing demand for clean energy solutions and Linde's strategic move in this space. The agreement represents a significant market opportunity for Linde, estimated at 1.1 Million tons of blue ammonia production supported annually by Linde’s clean hydrogen and nitrogen supply. The project also involves the sequestration of over 1.7 Million tons of CO2 emissions per year.
- February 2023: Air Products launched the PRISM InertPro Nitrogen Membrane System at the Middle East Oil and Gas Show. This innovative product showcases Air Products' technological leadership and its commitment to providing efficient and reliable nitrogen solutions to the energy industry. The modular design of the system makes it suitable for diverse energy applications.
Strategic Outlook for Specialty Gas Market Market
The specialty gas market's future is promising, driven by consistent growth across diverse sectors. Ongoing technological advancements, coupled with rising environmental awareness, will shape the market's trajectory. The increasing demand for high-purity gases in various industries will present significant opportunities for market players. The expansion of specialized gas applications into renewable energy and other emerging technologies will further fuel market growth.
Specialty Gas Market Segmentation
-
1. Type
- 1.1. High-purity Gases
- 1.2. Noble Gases
- 1.3. Carbon Gases
- 1.4. Halogen Gases
- 1.5. Other Types
-
2. End-User Industry
- 2.1. Automotive
- 2.2. Electronics
- 2.3. Medical and Healthcare
- 2.4. Food and Beverage
- 2.5. Oil and Gas
- 2.6. Other End-User Industries
Specialty Gas Market Segmentation By Geography
-
1. Asia Pacific
- 1.1. China
- 1.2. India
- 1.3. Japan
- 1.4. South Korea
- 1.5. Rest of Asia Pacific
-
2. North America
- 2.1. United States
- 2.2. Canada
- 2.3. Mexico
- 2.4. Rest of North America
-
3. Europe
- 3.1. Germany
- 3.2. United Kingdom
- 3.3. Italy
- 3.4. France
- 3.5. Rest of Europe
-
4. South America
- 4.1. Brazil
- 4.2. Aregentina
- 4.3. Rest of South America
-
5. Middle East and Africa
- 5.1. Saudi Arabia
- 5.2. South Africa
- 5.3. Rest of Middle East and Africa
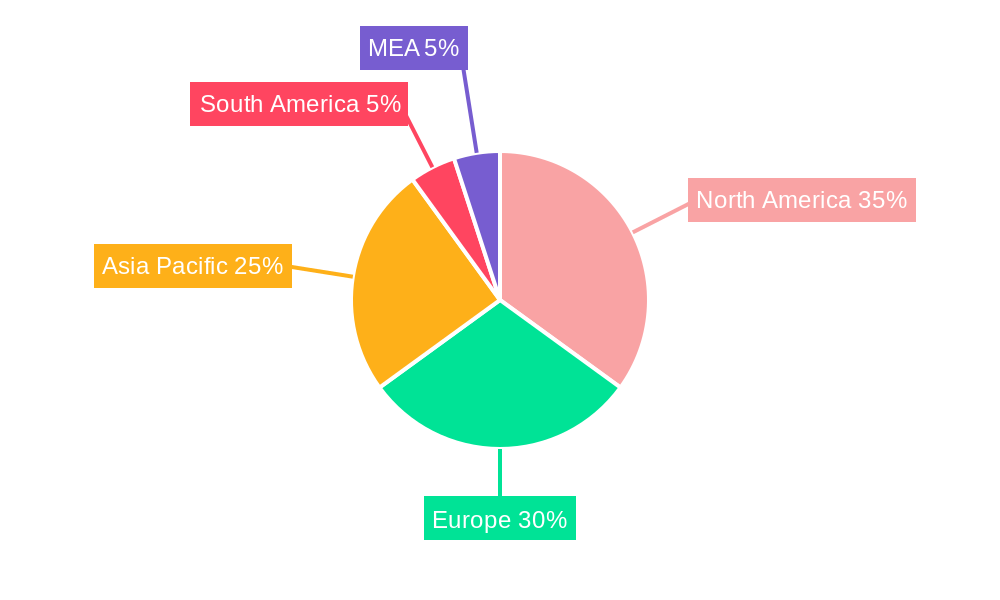
Specialty Gas Market Regional Market Share
Geographic Coverage of Specialty Gas Market
Specialty Gas Market REPORT HIGHLIGHTS
| Aspects | Details |
|---|---|
| Study Period | 2020-2034 |
| Base Year | 2025 |
| Estimated Year | 2026 |
| Forecast Period | 2026-2034 |
| Historical Period | 2020-2025 |
| Growth Rate | CAGR of > 4.00% from 2020-2034 |
| Segmentation |
|
Table of Contents
- 1. Introduction
- 1.1. Research Scope
- 1.2. Market Segmentation
- 1.3. Research Objective
- 1.4. Definitions and Assumptions
- 2. Executive Summary
- 2.1. Market Snapshot
- 3. Market Dynamics
- 3.1. Market Drivers
- 3.2. Market Restrains
- 3.3. Market Trends
- 3.4. Market Opportunities
- 4. Market Factor Analysis
- 4.1. Porters Five Forces
- 4.1.1. Bargaining Power of Suppliers
- 4.1.2. Bargaining Power of Buyers
- 4.1.3. Threat of New Entrants
- 4.1.4. Threat of Substitutes
- 4.1.5. Competitive Rivalry
- 4.2. PESTEL analysis
- 4.3. BCG Analysis
- 4.3.1. Stars (High Growth, High Market Share)
- 4.3.2. Cash Cows (Low Growth, High Market Share)
- 4.3.3. Question Mark (High Growth, Low Market Share)
- 4.3.4. Dogs (Low Growth, Low Market Share)
- 4.4. Ansoff Matrix Analysis
- 4.5. Supply Chain Analysis
- 4.6. Regulatory Landscape
- 4.7. Current Market Potential and Opportunity Assessment (TAM–SAM–SOM Framework)
- 4.8. RAX Analyst Note
- 4.1. Porters Five Forces
- 5. Market Analysis, Insights and Forecast 2021-2033
- 5.1. Market Analysis, Insights and Forecast - by Type
- 5.1.1. High-purity Gases
- 5.1.2. Noble Gases
- 5.1.3. Carbon Gases
- 5.1.4. Halogen Gases
- 5.1.5. Other Types
- 5.2. Market Analysis, Insights and Forecast - by End-User Industry
- 5.2.1. Automotive
- 5.2.2. Electronics
- 5.2.3. Medical and Healthcare
- 5.2.4. Food and Beverage
- 5.2.5. Oil and Gas
- 5.2.6. Other End-User Industries
- 5.3. Market Analysis, Insights and Forecast - by Region
- 5.3.1. Asia Pacific
- 5.3.2. North America
- 5.3.3. Europe
- 5.3.4. South America
- 5.3.5. Middle East and Africa
- 5.1. Market Analysis, Insights and Forecast - by Type
- 6. Global Specialty Gas Market Analysis, Insights and Forecast, 2021-2033
- 6.1. Market Analysis, Insights and Forecast - by Type
- 6.1.1. High-purity Gases
- 6.1.2. Noble Gases
- 6.1.3. Carbon Gases
- 6.1.4. Halogen Gases
- 6.1.5. Other Types
- 6.2. Market Analysis, Insights and Forecast - by End-User Industry
- 6.2.1. Automotive
- 6.2.2. Electronics
- 6.2.3. Medical and Healthcare
- 6.2.4. Food and Beverage
- 6.2.5. Oil and Gas
- 6.2.6. Other End-User Industries
- 6.1. Market Analysis, Insights and Forecast - by Type
- 7. Asia Pacific Specialty Gas Market Analysis, Insights and Forecast, 2020-2032
- 7.1. Market Analysis, Insights and Forecast - by Type
- 7.1.1. High-purity Gases
- 7.1.2. Noble Gases
- 7.1.3. Carbon Gases
- 7.1.4. Halogen Gases
- 7.1.5. Other Types
- 7.2. Market Analysis, Insights and Forecast - by End-User Industry
- 7.2.1. Automotive
- 7.2.2. Electronics
- 7.2.3. Medical and Healthcare
- 7.2.4. Food and Beverage
- 7.2.5. Oil and Gas
- 7.2.6. Other End-User Industries
- 7.1. Market Analysis, Insights and Forecast - by Type
- 8. North America Specialty Gas Market Analysis, Insights and Forecast, 2020-2032
- 8.1. Market Analysis, Insights and Forecast - by Type
- 8.1.1. High-purity Gases
- 8.1.2. Noble Gases
- 8.1.3. Carbon Gases
- 8.1.4. Halogen Gases
- 8.1.5. Other Types
- 8.2. Market Analysis, Insights and Forecast - by End-User Industry
- 8.2.1. Automotive
- 8.2.2. Electronics
- 8.2.3. Medical and Healthcare
- 8.2.4. Food and Beverage
- 8.2.5. Oil and Gas
- 8.2.6. Other End-User Industries
- 8.1. Market Analysis, Insights and Forecast - by Type
- 9. Europe Specialty Gas Market Analysis, Insights and Forecast, 2020-2032
- 9.1. Market Analysis, Insights and Forecast - by Type
- 9.1.1. High-purity Gases
- 9.1.2. Noble Gases
- 9.1.3. Carbon Gases
- 9.1.4. Halogen Gases
- 9.1.5. Other Types
- 9.2. Market Analysis, Insights and Forecast - by End-User Industry
- 9.2.1. Automotive
- 9.2.2. Electronics
- 9.2.3. Medical and Healthcare
- 9.2.4. Food and Beverage
- 9.2.5. Oil and Gas
- 9.2.6. Other End-User Industries
- 9.1. Market Analysis, Insights and Forecast - by Type
- 10. South America Specialty Gas Market Analysis, Insights and Forecast, 2020-2032
- 10.1. Market Analysis, Insights and Forecast - by Type
- 10.1.1. High-purity Gases
- 10.1.2. Noble Gases
- 10.1.3. Carbon Gases
- 10.1.4. Halogen Gases
- 10.1.5. Other Types
- 10.2. Market Analysis, Insights and Forecast - by End-User Industry
- 10.2.1. Automotive
- 10.2.2. Electronics
- 10.2.3. Medical and Healthcare
- 10.2.4. Food and Beverage
- 10.2.5. Oil and Gas
- 10.2.6. Other End-User Industries
- 10.1. Market Analysis, Insights and Forecast - by Type
- 11. Middle East and Africa Specialty Gas Market Analysis, Insights and Forecast, 2020-2032
- 11.1. Market Analysis, Insights and Forecast - by Type
- 11.1.1. High-purity Gases
- 11.1.2. Noble Gases
- 11.1.3. Carbon Gases
- 11.1.4. Halogen Gases
- 11.1.5. Other Types
- 11.2. Market Analysis, Insights and Forecast - by End-User Industry
- 11.2.1. Automotive
- 11.2.2. Electronics
- 11.2.3. Medical and Healthcare
- 11.2.4. Food and Beverage
- 11.2.5. Oil and Gas
- 11.2.6. Other End-User Industries
- 11.1. Market Analysis, Insights and Forecast - by Type
- 12. Competitive Analysis
- 12.1. Company Profiles
- 12.1.1 Air Products and Chemicals Inc
- 12.1.1.1. Company Overview
- 12.1.1.2. Products
- 12.1.1.3. Company Financials
- 12.1.1.4. SWOT Analysis
- 12.1.2 MESA Specialty Gases & Equipment
- 12.1.2.1. Company Overview
- 12.1.2.2. Products
- 12.1.2.3. Company Financials
- 12.1.2.4. SWOT Analysis
- 12.1.3 Mitsui Chemicals Inc
- 12.1.3.1. Company Overview
- 12.1.3.2. Products
- 12.1.3.3. Company Financials
- 12.1.3.4. SWOT Analysis
- 12.1.4 ILMO Products Company*List Not Exhaustive
- 12.1.4.1. Company Overview
- 12.1.4.2. Products
- 12.1.4.3. Company Financials
- 12.1.4.4. SWOT Analysis
- 12.1.5 Iwatani Corporation of America
- 12.1.5.1. Company Overview
- 12.1.5.2. Products
- 12.1.5.3. Company Financials
- 12.1.5.4. SWOT Analysis
- 12.1.6 Linde plc
- 12.1.6.1. Company Overview
- 12.1.6.2. Products
- 12.1.6.3. Company Financials
- 12.1.6.4. SWOT Analysis
- 12.1.7 Messer Group GmbH
- 12.1.7.1. Company Overview
- 12.1.7.2. Products
- 12.1.7.3. Company Financials
- 12.1.7.4. SWOT Analysis
- 12.1.8 Air Liquide
- 12.1.8.1. Company Overview
- 12.1.8.2. Products
- 12.1.8.3. Company Financials
- 12.1.8.4. SWOT Analysis
- 12.1.9 Norco Inc
- 12.1.9.1. Company Overview
- 12.1.9.2. Products
- 12.1.9.3. Company Financials
- 12.1.9.4. SWOT Analysis
- 12.1.10 YUEYANG KAIMEITE ELECTRONIC AND SPECLALTY RARE GASES CO
- 12.1.10.1. Company Overview
- 12.1.10.2. Products
- 12.1.10.3. Company Financials
- 12.1.10.4. SWOT Analysis
- 12.1.11 SHOWA DENKO K K
- 12.1.11.1. Company Overview
- 12.1.11.2. Products
- 12.1.11.3. Company Financials
- 12.1.11.4. SWOT Analysis
- 12.1.12 Coregas
- 12.1.12.1. Company Overview
- 12.1.12.2. Products
- 12.1.12.3. Company Financials
- 12.1.12.4. SWOT Analysis
- 12.1.1 Air Products and Chemicals Inc
- 12.2. Market Entropy
- 12.2.1 Company's Key Areas Served
- 12.2.2 Recent Developments
- 12.3. Company Market Share Analysis 2025
- 12.3.1 Top 5 Companies Market Share Analysis
- 12.3.2 Top 3 Companies Market Share Analysis
- 12.4. List of Potential Customers
- 13. Research Methodology
List of Figures
- Figure 1: Global Specialty Gas Market Revenue Breakdown (Million, %) by Region 2025 & 2033
- Figure 2: Global Specialty Gas Market Volume Breakdown (K Tons, %) by Region 2025 & 2033
- Figure 3: Asia Pacific Specialty Gas Market Revenue (Million), by Type 2025 & 2033
- Figure 4: Asia Pacific Specialty Gas Market Volume (K Tons), by Type 2025 & 2033
- Figure 5: Asia Pacific Specialty Gas Market Revenue Share (%), by Type 2025 & 2033
- Figure 6: Asia Pacific Specialty Gas Market Volume Share (%), by Type 2025 & 2033
- Figure 7: Asia Pacific Specialty Gas Market Revenue (Million), by End-User Industry 2025 & 2033
- Figure 8: Asia Pacific Specialty Gas Market Volume (K Tons), by End-User Industry 2025 & 2033
- Figure 9: Asia Pacific Specialty Gas Market Revenue Share (%), by End-User Industry 2025 & 2033
- Figure 10: Asia Pacific Specialty Gas Market Volume Share (%), by End-User Industry 2025 & 2033
- Figure 11: Asia Pacific Specialty Gas Market Revenue (Million), by Country 2025 & 2033
- Figure 12: Asia Pacific Specialty Gas Market Volume (K Tons), by Country 2025 & 2033
- Figure 13: Asia Pacific Specialty Gas Market Revenue Share (%), by Country 2025 & 2033
- Figure 14: Asia Pacific Specialty Gas Market Volume Share (%), by Country 2025 & 2033
- Figure 15: North America Specialty Gas Market Revenue (Million), by Type 2025 & 2033
- Figure 16: North America Specialty Gas Market Volume (K Tons), by Type 2025 & 2033
- Figure 17: North America Specialty Gas Market Revenue Share (%), by Type 2025 & 2033
- Figure 18: North America Specialty Gas Market Volume Share (%), by Type 2025 & 2033
- Figure 19: North America Specialty Gas Market Revenue (Million), by End-User Industry 2025 & 2033
- Figure 20: North America Specialty Gas Market Volume (K Tons), by End-User Industry 2025 & 2033
- Figure 21: North America Specialty Gas Market Revenue Share (%), by End-User Industry 2025 & 2033
- Figure 22: North America Specialty Gas Market Volume Share (%), by End-User Industry 2025 & 2033
- Figure 23: North America Specialty Gas Market Revenue (Million), by Country 2025 & 2033
- Figure 24: North America Specialty Gas Market Volume (K Tons), by Country 2025 & 2033
- Figure 25: North America Specialty Gas Market Revenue Share (%), by Country 2025 & 2033
- Figure 26: North America Specialty Gas Market Volume Share (%), by Country 2025 & 2033
- Figure 27: Europe Specialty Gas Market Revenue (Million), by Type 2025 & 2033
- Figure 28: Europe Specialty Gas Market Volume (K Tons), by Type 2025 & 2033
- Figure 29: Europe Specialty Gas Market Revenue Share (%), by Type 2025 & 2033
- Figure 30: Europe Specialty Gas Market Volume Share (%), by Type 2025 & 2033
- Figure 31: Europe Specialty Gas Market Revenue (Million), by End-User Industry 2025 & 2033
- Figure 32: Europe Specialty Gas Market Volume (K Tons), by End-User Industry 2025 & 2033
- Figure 33: Europe Specialty Gas Market Revenue Share (%), by End-User Industry 2025 & 2033
- Figure 34: Europe Specialty Gas Market Volume Share (%), by End-User Industry 2025 & 2033
- Figure 35: Europe Specialty Gas Market Revenue (Million), by Country 2025 & 2033
- Figure 36: Europe Specialty Gas Market Volume (K Tons), by Country 2025 & 2033
- Figure 37: Europe Specialty Gas Market Revenue Share (%), by Country 2025 & 2033
- Figure 38: Europe Specialty Gas Market Volume Share (%), by Country 2025 & 2033
- Figure 39: South America Specialty Gas Market Revenue (Million), by Type 2025 & 2033
- Figure 40: South America Specialty Gas Market Volume (K Tons), by Type 2025 & 2033
- Figure 41: South America Specialty Gas Market Revenue Share (%), by Type 2025 & 2033
- Figure 42: South America Specialty Gas Market Volume Share (%), by Type 2025 & 2033
- Figure 43: South America Specialty Gas Market Revenue (Million), by End-User Industry 2025 & 2033
- Figure 44: South America Specialty Gas Market Volume (K Tons), by End-User Industry 2025 & 2033
- Figure 45: South America Specialty Gas Market Revenue Share (%), by End-User Industry 2025 & 2033
- Figure 46: South America Specialty Gas Market Volume Share (%), by End-User Industry 2025 & 2033
- Figure 47: South America Specialty Gas Market Revenue (Million), by Country 2025 & 2033
- Figure 48: South America Specialty Gas Market Volume (K Tons), by Country 2025 & 2033
- Figure 49: South America Specialty Gas Market Revenue Share (%), by Country 2025 & 2033
- Figure 50: South America Specialty Gas Market Volume Share (%), by Country 2025 & 2033
- Figure 51: Middle East and Africa Specialty Gas Market Revenue (Million), by Type 2025 & 2033
- Figure 52: Middle East and Africa Specialty Gas Market Volume (K Tons), by Type 2025 & 2033
- Figure 53: Middle East and Africa Specialty Gas Market Revenue Share (%), by Type 2025 & 2033
- Figure 54: Middle East and Africa Specialty Gas Market Volume Share (%), by Type 2025 & 2033
- Figure 55: Middle East and Africa Specialty Gas Market Revenue (Million), by End-User Industry 2025 & 2033
- Figure 56: Middle East and Africa Specialty Gas Market Volume (K Tons), by End-User Industry 2025 & 2033
- Figure 57: Middle East and Africa Specialty Gas Market Revenue Share (%), by End-User Industry 2025 & 2033
- Figure 58: Middle East and Africa Specialty Gas Market Volume Share (%), by End-User Industry 2025 & 2033
- Figure 59: Middle East and Africa Specialty Gas Market Revenue (Million), by Country 2025 & 2033
- Figure 60: Middle East and Africa Specialty Gas Market Volume (K Tons), by Country 2025 & 2033
- Figure 61: Middle East and Africa Specialty Gas Market Revenue Share (%), by Country 2025 & 2033
- Figure 62: Middle East and Africa Specialty Gas Market Volume Share (%), by Country 2025 & 2033
List of Tables
- Table 1: Global Specialty Gas Market Revenue Million Forecast, by Type 2020 & 2033
- Table 2: Global Specialty Gas Market Volume K Tons Forecast, by Type 2020 & 2033
- Table 3: Global Specialty Gas Market Revenue Million Forecast, by End-User Industry 2020 & 2033
- Table 4: Global Specialty Gas Market Volume K Tons Forecast, by End-User Industry 2020 & 2033
- Table 5: Global Specialty Gas Market Revenue Million Forecast, by Region 2020 & 2033
- Table 6: Global Specialty Gas Market Volume K Tons Forecast, by Region 2020 & 2033
- Table 7: Global Specialty Gas Market Revenue Million Forecast, by Type 2020 & 2033
- Table 8: Global Specialty Gas Market Volume K Tons Forecast, by Type 2020 & 2033
- Table 9: Global Specialty Gas Market Revenue Million Forecast, by End-User Industry 2020 & 2033
- Table 10: Global Specialty Gas Market Volume K Tons Forecast, by End-User Industry 2020 & 2033
- Table 11: Global Specialty Gas Market Revenue Million Forecast, by Country 2020 & 2033
- Table 12: Global Specialty Gas Market Volume K Tons Forecast, by Country 2020 & 2033
- Table 13: China Specialty Gas Market Revenue (Million) Forecast, by Application 2020 & 2033
- Table 14: China Specialty Gas Market Volume (K Tons) Forecast, by Application 2020 & 2033
- Table 15: India Specialty Gas Market Revenue (Million) Forecast, by Application 2020 & 2033
- Table 16: India Specialty Gas Market Volume (K Tons) Forecast, by Application 2020 & 2033
- Table 17: Japan Specialty Gas Market Revenue (Million) Forecast, by Application 2020 & 2033
- Table 18: Japan Specialty Gas Market Volume (K Tons) Forecast, by Application 2020 & 2033
- Table 19: South Korea Specialty Gas Market Revenue (Million) Forecast, by Application 2020 & 2033
- Table 20: South Korea Specialty Gas Market Volume (K Tons) Forecast, by Application 2020 & 2033
- Table 21: Rest of Asia Pacific Specialty Gas Market Revenue (Million) Forecast, by Application 2020 & 2033
- Table 22: Rest of Asia Pacific Specialty Gas Market Volume (K Tons) Forecast, by Application 2020 & 2033
- Table 23: Global Specialty Gas Market Revenue Million Forecast, by Type 2020 & 2033
- Table 24: Global Specialty Gas Market Volume K Tons Forecast, by Type 2020 & 2033
- Table 25: Global Specialty Gas Market Revenue Million Forecast, by End-User Industry 2020 & 2033
- Table 26: Global Specialty Gas Market Volume K Tons Forecast, by End-User Industry 2020 & 2033
- Table 27: Global Specialty Gas Market Revenue Million Forecast, by Country 2020 & 2033
- Table 28: Global Specialty Gas Market Volume K Tons Forecast, by Country 2020 & 2033
- Table 29: United States Specialty Gas Market Revenue (Million) Forecast, by Application 2020 & 2033
- Table 30: United States Specialty Gas Market Volume (K Tons) Forecast, by Application 2020 & 2033
- Table 31: Canada Specialty Gas Market Revenue (Million) Forecast, by Application 2020 & 2033
- Table 32: Canada Specialty Gas Market Volume (K Tons) Forecast, by Application 2020 & 2033
- Table 33: Mexico Specialty Gas Market Revenue (Million) Forecast, by Application 2020 & 2033
- Table 34: Mexico Specialty Gas Market Volume (K Tons) Forecast, by Application 2020 & 2033
- Table 35: Rest of North America Specialty Gas Market Revenue (Million) Forecast, by Application 2020 & 2033
- Table 36: Rest of North America Specialty Gas Market Volume (K Tons) Forecast, by Application 2020 & 2033
- Table 37: Global Specialty Gas Market Revenue Million Forecast, by Type 2020 & 2033
- Table 38: Global Specialty Gas Market Volume K Tons Forecast, by Type 2020 & 2033
- Table 39: Global Specialty Gas Market Revenue Million Forecast, by End-User Industry 2020 & 2033
- Table 40: Global Specialty Gas Market Volume K Tons Forecast, by End-User Industry 2020 & 2033
- Table 41: Global Specialty Gas Market Revenue Million Forecast, by Country 2020 & 2033
- Table 42: Global Specialty Gas Market Volume K Tons Forecast, by Country 2020 & 2033
- Table 43: Germany Specialty Gas Market Revenue (Million) Forecast, by Application 2020 & 2033
- Table 44: Germany Specialty Gas Market Volume (K Tons) Forecast, by Application 2020 & 2033
- Table 45: United Kingdom Specialty Gas Market Revenue (Million) Forecast, by Application 2020 & 2033
- Table 46: United Kingdom Specialty Gas Market Volume (K Tons) Forecast, by Application 2020 & 2033
- Table 47: Italy Specialty Gas Market Revenue (Million) Forecast, by Application 2020 & 2033
- Table 48: Italy Specialty Gas Market Volume (K Tons) Forecast, by Application 2020 & 2033
- Table 49: France Specialty Gas Market Revenue (Million) Forecast, by Application 2020 & 2033
- Table 50: France Specialty Gas Market Volume (K Tons) Forecast, by Application 2020 & 2033
- Table 51: Rest of Europe Specialty Gas Market Revenue (Million) Forecast, by Application 2020 & 2033
- Table 52: Rest of Europe Specialty Gas Market Volume (K Tons) Forecast, by Application 2020 & 2033
- Table 53: Global Specialty Gas Market Revenue Million Forecast, by Type 2020 & 2033
- Table 54: Global Specialty Gas Market Volume K Tons Forecast, by Type 2020 & 2033
- Table 55: Global Specialty Gas Market Revenue Million Forecast, by End-User Industry 2020 & 2033
- Table 56: Global Specialty Gas Market Volume K Tons Forecast, by End-User Industry 2020 & 2033
- Table 57: Global Specialty Gas Market Revenue Million Forecast, by Country 2020 & 2033
- Table 58: Global Specialty Gas Market Volume K Tons Forecast, by Country 2020 & 2033
- Table 59: Brazil Specialty Gas Market Revenue (Million) Forecast, by Application 2020 & 2033
- Table 60: Brazil Specialty Gas Market Volume (K Tons) Forecast, by Application 2020 & 2033
- Table 61: Aregentina Specialty Gas Market Revenue (Million) Forecast, by Application 2020 & 2033
- Table 62: Aregentina Specialty Gas Market Volume (K Tons) Forecast, by Application 2020 & 2033
- Table 63: Rest of South America Specialty Gas Market Revenue (Million) Forecast, by Application 2020 & 2033
- Table 64: Rest of South America Specialty Gas Market Volume (K Tons) Forecast, by Application 2020 & 2033
- Table 65: Global Specialty Gas Market Revenue Million Forecast, by Type 2020 & 2033
- Table 66: Global Specialty Gas Market Volume K Tons Forecast, by Type 2020 & 2033
- Table 67: Global Specialty Gas Market Revenue Million Forecast, by End-User Industry 2020 & 2033
- Table 68: Global Specialty Gas Market Volume K Tons Forecast, by End-User Industry 2020 & 2033
- Table 69: Global Specialty Gas Market Revenue Million Forecast, by Country 2020 & 2033
- Table 70: Global Specialty Gas Market Volume K Tons Forecast, by Country 2020 & 2033
- Table 71: Saudi Arabia Specialty Gas Market Revenue (Million) Forecast, by Application 2020 & 2033
- Table 72: Saudi Arabia Specialty Gas Market Volume (K Tons) Forecast, by Application 2020 & 2033
- Table 73: South Africa Specialty Gas Market Revenue (Million) Forecast, by Application 2020 & 2033
- Table 74: South Africa Specialty Gas Market Volume (K Tons) Forecast, by Application 2020 & 2033
- Table 75: Rest of Middle East and Africa Specialty Gas Market Revenue (Million) Forecast, by Application 2020 & 2033
- Table 76: Rest of Middle East and Africa Specialty Gas Market Volume (K Tons) Forecast, by Application 2020 & 2033
Frequently Asked Questions
1. What is the projected Compound Annual Growth Rate (CAGR) of the Specialty Gas Market?
The projected CAGR is approximately > 4.00%.
2. Which companies are prominent players in the Specialty Gas Market?
Key companies in the market include Air Products and Chemicals Inc, MESA Specialty Gases & Equipment, Mitsui Chemicals Inc, ILMO Products Company*List Not Exhaustive, Iwatani Corporation of America, Linde plc, Messer Group GmbH, Air Liquide, Norco Inc, YUEYANG KAIMEITE ELECTRONIC AND SPECLALTY RARE GASES CO, SHOWA DENKO K K, Coregas.
3. What are the main segments of the Specialty Gas Market?
The market segments include Type, End-User Industry.
4. Can you provide details about the market size?
The market size is estimated to be USD 12570 Million as of 2022.
5. What are some drivers contributing to market growth?
Wide Applications in the Electronics Industry; Increasing Demand from the Healthcare Sector.
6. What are the notable trends driving market growth?
Electronics Sector to Drive the Specialty Gas Market.
7. Are there any restraints impacting market growth?
Stringent Environmental Regulations and Restrictions on Specialty Gas Production and Quality Control; Other Restraints.
8. Can you provide examples of recent developments in the market?
February 2023: Linde announced a long-term arrangement with OCI to supply clean hydrogen and other industrial gases to the company's new world-scale blue ammonia factory in Beaumont, Texas. Linde will construct, own, and manage an on-site complex that will supply OCI's 1.1 million tons of blue ammonia production with clean hydrogen and nitrogen per year. Linde will provide clean hydrogen to OCI by sequestering more than 1.7 million tons of CO2 emissions yearly.
9. What pricing options are available for accessing the report?
Pricing options include single-user, multi-user, and enterprise licenses priced at USD 4750, USD 5250, and USD 8750 respectively.
10. Is the market size provided in terms of value or volume?
The market size is provided in terms of value, measured in Million and volume, measured in K Tons.
11. Are there any specific market keywords associated with the report?
Yes, the market keyword associated with the report is "Specialty Gas Market," which aids in identifying and referencing the specific market segment covered.
12. How do I determine which pricing option suits my needs best?
The pricing options vary based on user requirements and access needs. Individual users may opt for single-user licenses, while businesses requiring broader access may choose multi-user or enterprise licenses for cost-effective access to the report.
13. Are there any additional resources or data provided in the Specialty Gas Market report?
While the report offers comprehensive insights, it's advisable to review the specific contents or supplementary materials provided to ascertain if additional resources or data are available.
14. How can I stay updated on further developments or reports in the Specialty Gas Market?
To stay informed about further developments, trends, and reports in the Specialty Gas Market, consider subscribing to industry newsletters, following relevant companies and organizations, or regularly checking reputable industry news sources and publications.
Methodology
Step 1 - Identification of Relevant Samples Size from Population Database


Step 2 - Approaches for Defining Global Market Size (Value, Volume* & Price*)

Note*: In applicable scenarios
Step 3 - Data Sources
Primary Research
- Web Analytics
- Survey Reports
- Research Institute
- Latest Research Reports
- Opinion Leaders
Secondary Research
- Annual Reports
- White Paper
- Latest Press Release
- Industry Association
- Paid Database
- Investor Presentations

Step 4 - Data Triangulation
Involves using different sources of information in order to increase the validity of a study
These sources are likely to be stakeholders in a program - participants, other researchers, program staff, other community members, and so on.
Then we put all data in single framework & apply various statistical tools to find out the dynamic on the market.
During the analysis stage, feedback from the stakeholder groups would be compared to determine areas of agreement as well as areas of divergence