
Key Insights
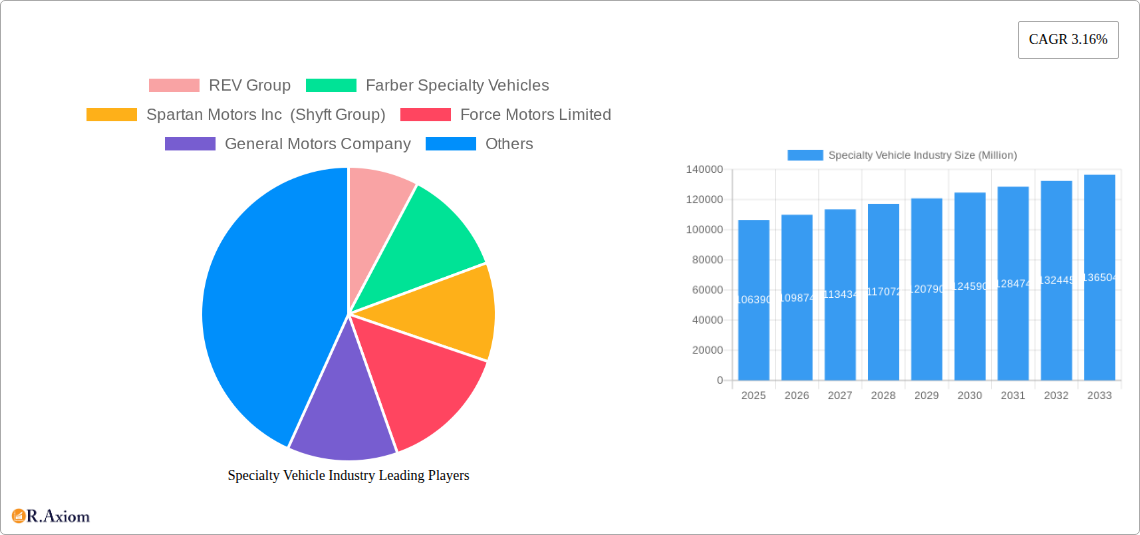
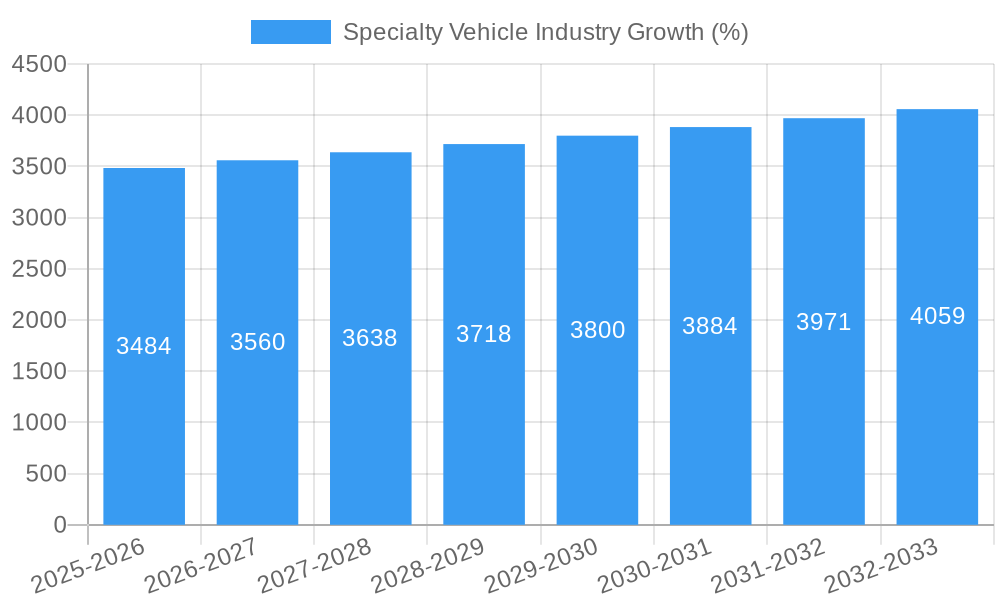
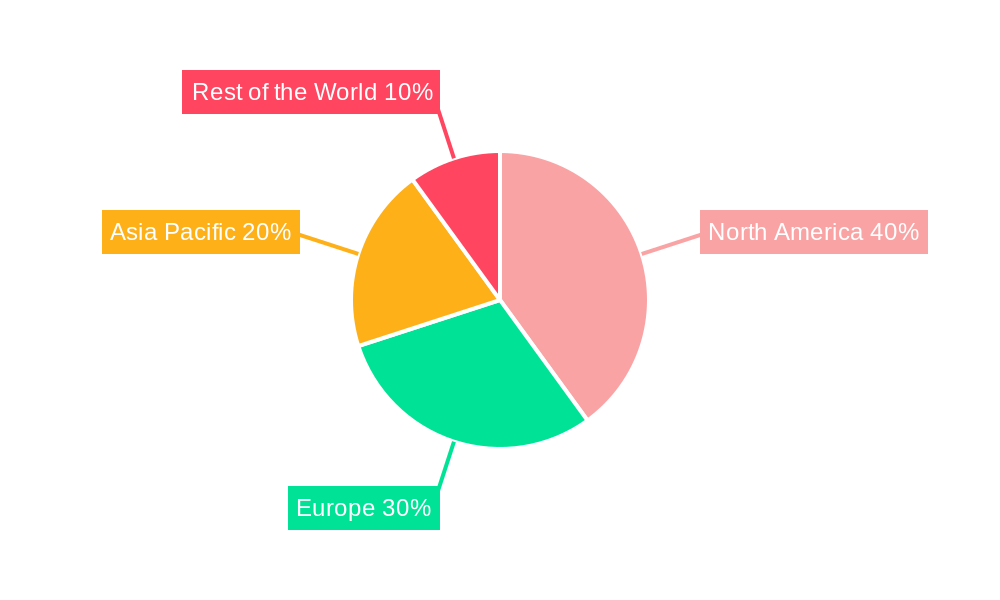
The global specialty vehicle market, valued at $106.39 billion in 2025, is poised for steady growth, projected to expand at a compound annual growth rate (CAGR) of 3.16% from 2025 to 2033. This growth is driven by several key factors. Increasing demand for emergency response vehicles, particularly ambulances and fire trucks, fueled by rising urbanization and a growing global population, is a significant contributor. Furthermore, the expanding logistics and transportation sectors are driving demand for specialized vehicles such as mobile fuel tankers. Technological advancements, including the incorporation of advanced safety features, telematics, and alternative fuel systems, are further stimulating market expansion. The market is segmented by type (ambulances, fire trucks, fuel tankers, and others) and application (law enforcement, medical, recreational, and other services). North America and Europe currently hold significant market shares, driven by robust infrastructure and higher disposable incomes. However, the Asia-Pacific region is expected to witness substantial growth over the forecast period due to rapid economic development and expanding infrastructure projects in countries like China and India.
Despite the positive outlook, the specialty vehicle market faces certain challenges. Fluctuations in raw material prices, particularly steel and aluminum, can impact manufacturing costs. Stringent emission regulations, pushing manufacturers towards developing eco-friendly vehicles, necessitate substantial investments in research and development. Furthermore, economic downturns can impact government spending on public safety vehicles, potentially dampening market growth in certain regions. However, the long-term outlook remains positive, driven by the sustained need for specialized vehicles across various sectors and ongoing technological innovation. Competition is intense, with established players such as REV Group, Spartan Motors, and Daimler AG vying for market share alongside emerging specialized manufacturers. Strategic partnerships, mergers, and acquisitions are likely to shape the market landscape in the coming years.
This comprehensive report provides a detailed analysis of the Specialty Vehicle Industry, offering invaluable insights for stakeholders seeking to navigate this dynamic market. The study covers the period 2019-2033, with a focus on the 2025-2033 forecast period. The report is meticulously researched and uses Million as the unit for all value mentions. It leverages high-traffic keywords to ensure maximum search visibility and engagement within the industry.
Specialty Vehicle Industry Market Concentration & Innovation
This section analyzes the competitive landscape of the specialty vehicle market, exploring market concentration, innovation drivers, regulatory frameworks, and market dynamics. The report delves into the impact of mergers and acquisitions (M&A) on market structure and assesses the role of technological advancements in shaping industry trends.
- Market Concentration: The global specialty vehicle market exhibits a moderately concentrated structure, with several key players holding significant market share. The top 5 players account for approximately xx% of the global market in 2025.
- Innovation Drivers: Stringent emission norms, demand for fuel-efficient vehicles, and advancements in safety technologies are major innovation drivers. The push towards electric and autonomous vehicles is reshaping the industry.
- Regulatory Frameworks: Government regulations concerning safety, emissions, and fuel efficiency significantly impact the market. Variations in regulations across different regions create unique challenges and opportunities.
- Product Substitutes: Limited direct substitutes exist for specialized vehicles like ambulances and fire trucks. However, alternative transportation solutions may influence certain segments.
- End-User Trends: The growing need for efficient and reliable specialty vehicles across various applications drives market expansion. Increased focus on safety and technological advancements influences purchasing decisions.
- M&A Activities: The specialty vehicle industry has witnessed notable M&A activity in recent years. Deal values have ranged from xx Million to xx Million, with strategic acquisitions aimed at expanding product portfolios and geographic reach.
Specialty Vehicle Industry Industry Trends & Insights
This section provides a thorough overview of the key trends influencing the specialty vehicle market. Growth drivers, technological disruptions, evolving consumer preferences, and competitive dynamics are analyzed using extensive data and insights. The report projects a Compound Annual Growth Rate (CAGR) of xx% for the forecast period, driven by increasing demand across various application segments. Market penetration rates will be explored in detail. Specific examples of technological disruption and changing consumer preferences will be analyzed. A detailed Competitive Landscape analysis will illustrate the competitive dynamics with a focus on competitive advantages and market strategies.
Dominant Markets & Segments in Specialty Vehicle Industry
This section identifies the leading regions, countries, and segments within the specialty vehicle market. It analyzes market dominance by segment (By Type and By Application Type) and pinpoints key growth drivers in those regions.
By Type:
- Ambulances: The ambulance segment holds a significant market share, fueled by rising healthcare expenditure and aging populations. Key drivers include government initiatives promoting healthcare infrastructure and technological advancements in ambulance technology.
- Fire Extinguishing Trucks: This segment is influenced by factors such as increasing urbanization, industrial development, and evolving fire safety standards.
- Mobile Fuel Carrying Tankers: Market growth is driven by the energy sector's expansion and the need for efficient fuel transportation.
- Other Types: This category encompasses specialized vehicles for various applications, each with unique market drivers and growth potential.
By Application Type:
- Law Enforcement and Public Safety: This segment is driven by government spending on public safety and the growing need for advanced law enforcement vehicles.
- Medical and Healthcare: The medical and healthcare segment exhibits high growth due to rising healthcare expenditure and the increasing demand for efficient emergency medical services.
- Recreational Vehicles: The recreational vehicle segment is driven by evolving leisure preferences and tourism growth.
- Other Services: This category includes various applications, each exhibiting unique growth trends and market dynamics.
Dominance Analysis: The North American region currently holds the largest market share, driven by robust healthcare infrastructure and high government expenditure on public safety. However, developing economies in Asia-Pacific are projected to experience significant growth in the forecast period.
Specialty Vehicle Industry Product Developments
The specialty vehicle market is characterized by continuous product innovation, encompassing advancements in safety features, fuel efficiency, and technological integration. Recent developments include the integration of telematics systems, improved chassis designs, and the introduction of electric and hybrid powertrains. These innovations enhance vehicle performance, operational efficiency, and environmental sustainability, aligning with the evolving needs of end-users. The adoption of these technologies influences the competitive landscape and market segmentation.
Report Scope & Segmentation Analysis
This report provides a comprehensive segmentation analysis of the specialty vehicle market, divided by Type (Ambulances, Fire Extinguishing Trucks, Mobile Fuel Carrying Tankers, Other Types) and Application Type (Law Enforcement and Public Safety, Medical and Healthcare, Recreational Vehicles, Other Services). Each segment’s growth projections, market sizes, and competitive dynamics are analyzed, offering a detailed understanding of market opportunities across various categories. For example, the ambulance segment is projected to grow at a CAGR of xx% due to factors such as aging populations and increasing demand for efficient emergency medical services.
Key Drivers of Specialty Vehicle Industry Growth
Several key factors fuel the growth of the specialty vehicle industry. Technological advancements, such as the adoption of electric and autonomous technologies, enhance vehicle performance and efficiency. Government regulations promoting safety and emission standards drive innovation and market expansion. Rising demand from end-users, driven by factors like urbanization, improved healthcare infrastructure, and increased investment in public safety, are major catalysts for growth.
Challenges in the Specialty Vehicle Industry Sector
The specialty vehicle industry faces several challenges, including stringent regulatory compliance requirements, fluctuating raw material prices impacting production costs, and intense competition from established and emerging players. Supply chain disruptions can also cause delays and impact production. These factors influence profitability and market dynamics. The quantifiable impacts of these challenges will be discussed in the full report.
Emerging Opportunities in Specialty Vehicle Industry
The specialty vehicle industry offers several promising opportunities. The growing adoption of electric and autonomous technologies presents new avenues for growth. Expanding into new markets, particularly in developing economies, presents significant potential. The increasing focus on sustainability and environmental concerns creates opportunities for eco-friendly vehicle development and adoption.
Leading Players in the Specialty Vehicle Industry Market
- REV Group
- Farber Specialty Vehicles
- Spartan Motors Inc (Shyft Group)
- Force Motors Limited
- General Motors Company
- Specialty Vehicles Inc
- Daimler AG
- Volvo Group
- Emergency One Group
- Matthews Specialty Vehicles Inc
- LDV Inc
- Oshkosh Corporation
Key Developments in Specialty Vehicle Industry Industry
- June 2022: Minsk Automobile Plant (MAZ) launched the MAZ minibus line, including the MAZ-365022, a light-duty commercial vehicle adaptable for ambulance use. This expansion widens the range of available vehicles and potentially increases competition.
- March 2021: Mercedes-Benz Vans announced the electrification of its ambulance vehicles based on the eSprinter, showcasing a move towards sustainable and environmentally friendly options in the healthcare sector. This signals a shift towards electric vehicle adoption within the specialty vehicle industry.
- March 2021: Falck signed a master agreement with MAN Truck & Bus for ambulance and patient-transport applications. This strategic partnership signifies increased collaboration within the sector.
Strategic Outlook for Specialty Vehicle Industry Market
The specialty vehicle industry is poised for sustained growth, driven by ongoing technological advancements, increasing demand across various applications, and the expanding global market. The shift towards electric and autonomous vehicles will reshape the landscape, creating opportunities for innovation and market expansion. Government initiatives promoting infrastructure development and sustainable transportation will further stimulate market growth. The report offers valuable strategic insights to help stakeholders capitalize on these opportunities.
Specialty Vehicle Industry Segmentation
-
1. Type
- 1.1. Ambulances
- 1.2. Fire Extinguishing Trucks
- 1.3. Mobile Fuel Carrying Tankers
- 1.4. Other Types
-
2. Application Type
- 2.1. Law Enforcement And Public Safety
- 2.2. Medical And Healthcare
- 2.3. Recreational Vehicles
- 2.4. Other Services
Specialty Vehicle Industry Segmentation By Geography
-
1. North America
- 1.1. United States
- 1.2. Canada
- 1.3. Rest of North America
-
2. Europe
- 2.1. Germany
- 2.2. United Kingdom
- 2.3. France
- 2.4. Rest of Europe
-
3. Asia Pacific
- 3.1. China
- 3.2. India
- 3.3. Japan
- 3.4. South Korea
- 3.5. Rest of Asia Pacific
-
4. Rest of the World
- 4.1. South America
- 4.2. Middle East and Africa
Specialty Vehicle Industry REPORT HIGHLIGHTS
| Aspects | Details |
|---|---|
| Study Period | 2019-2033 |
| Base Year | 2024 |
| Estimated Year | 2025 |
| Forecast Period | 2025-2033 |
| Historical Period | 2019-2024 |
| Growth Rate | CAGR of 3.16% from 2019-2033 |
| Segmentation |
|
Table of Contents
- 1. Introduction
- 1.1. Research Scope
- 1.2. Market Segmentation
- 1.3. Research Methodology
- 1.4. Definitions and Assumptions
- 2. Executive Summary
- 2.1. Introduction
- 3. Market Dynamics
- 3.1. Introduction
- 3.2. Market Drivers
- 3.2.1. Rise in demand for Advanced Comfort Systems In Vehicles
- 3.3. Market Restrains
- 3.3.1. High Cost Assoicated with Advanced Features
- 3.4. Market Trends
- 3.4.1. Increase in Spending on Law Enforcement and Healthcare Facilities
- 4. Market Factor Analysis
- 4.1. Porters Five Forces
- 4.2. Supply/Value Chain
- 4.3. PESTEL analysis
- 4.4. Market Entropy
- 4.5. Patent/Trademark Analysis
- 5. Global Specialty Vehicle Industry Analysis, Insights and Forecast, 2019-2031
- 5.1. Market Analysis, Insights and Forecast - by Type
- 5.1.1. Ambulances
- 5.1.2. Fire Extinguishing Trucks
- 5.1.3. Mobile Fuel Carrying Tankers
- 5.1.4. Other Types
- 5.2. Market Analysis, Insights and Forecast - by Application Type
- 5.2.1. Law Enforcement And Public Safety
- 5.2.2. Medical And Healthcare
- 5.2.3. Recreational Vehicles
- 5.2.4. Other Services
- 5.3. Market Analysis, Insights and Forecast - by Region
- 5.3.1. North America
- 5.3.2. Europe
- 5.3.3. Asia Pacific
- 5.3.4. Rest of the World
- 5.1. Market Analysis, Insights and Forecast - by Type
- 6. North America Specialty Vehicle Industry Analysis, Insights and Forecast, 2019-2031
- 6.1. Market Analysis, Insights and Forecast - by Type
- 6.1.1. Ambulances
- 6.1.2. Fire Extinguishing Trucks
- 6.1.3. Mobile Fuel Carrying Tankers
- 6.1.4. Other Types
- 6.2. Market Analysis, Insights and Forecast - by Application Type
- 6.2.1. Law Enforcement And Public Safety
- 6.2.2. Medical And Healthcare
- 6.2.3. Recreational Vehicles
- 6.2.4. Other Services
- 6.1. Market Analysis, Insights and Forecast - by Type
- 7. Europe Specialty Vehicle Industry Analysis, Insights and Forecast, 2019-2031
- 7.1. Market Analysis, Insights and Forecast - by Type
- 7.1.1. Ambulances
- 7.1.2. Fire Extinguishing Trucks
- 7.1.3. Mobile Fuel Carrying Tankers
- 7.1.4. Other Types
- 7.2. Market Analysis, Insights and Forecast - by Application Type
- 7.2.1. Law Enforcement And Public Safety
- 7.2.2. Medical And Healthcare
- 7.2.3. Recreational Vehicles
- 7.2.4. Other Services
- 7.1. Market Analysis, Insights and Forecast - by Type
- 8. Asia Pacific Specialty Vehicle Industry Analysis, Insights and Forecast, 2019-2031
- 8.1. Market Analysis, Insights and Forecast - by Type
- 8.1.1. Ambulances
- 8.1.2. Fire Extinguishing Trucks
- 8.1.3. Mobile Fuel Carrying Tankers
- 8.1.4. Other Types
- 8.2. Market Analysis, Insights and Forecast - by Application Type
- 8.2.1. Law Enforcement And Public Safety
- 8.2.2. Medical And Healthcare
- 8.2.3. Recreational Vehicles
- 8.2.4. Other Services
- 8.1. Market Analysis, Insights and Forecast - by Type
- 9. Rest of the World Specialty Vehicle Industry Analysis, Insights and Forecast, 2019-2031
- 9.1. Market Analysis, Insights and Forecast - by Type
- 9.1.1. Ambulances
- 9.1.2. Fire Extinguishing Trucks
- 9.1.3. Mobile Fuel Carrying Tankers
- 9.1.4. Other Types
- 9.2. Market Analysis, Insights and Forecast - by Application Type
- 9.2.1. Law Enforcement And Public Safety
- 9.2.2. Medical And Healthcare
- 9.2.3. Recreational Vehicles
- 9.2.4. Other Services
- 9.1. Market Analysis, Insights and Forecast - by Type
- 10. North America Specialty Vehicle Industry Analysis, Insights and Forecast, 2019-2031
- 10.1. Market Analysis, Insights and Forecast - By Country/Sub-region
- 10.1.1 United States
- 10.1.2 Canada
- 10.1.3 Rest of North America
- 11. Europe Specialty Vehicle Industry Analysis, Insights and Forecast, 2019-2031
- 11.1. Market Analysis, Insights and Forecast - By Country/Sub-region
- 11.1.1 Germany
- 11.1.2 United Kingdom
- 11.1.3 France
- 11.1.4 Rest of Europe
- 12. Asia Pacific Specialty Vehicle Industry Analysis, Insights and Forecast, 2019-2031
- 12.1. Market Analysis, Insights and Forecast - By Country/Sub-region
- 12.1.1 China
- 12.1.2 India
- 12.1.3 Japan
- 12.1.4 South Korea
- 12.1.5 Rest of Asia Pacific
- 13. Rest of the World Specialty Vehicle Industry Analysis, Insights and Forecast, 2019-2031
- 13.1. Market Analysis, Insights and Forecast - By Country/Sub-region
- 13.1.1 South America
- 13.1.2 Middle East and Africa
- 14. Competitive Analysis
- 14.1. Global Market Share Analysis 2024
- 14.2. Company Profiles
- 14.2.1 REV Group
- 14.2.1.1. Overview
- 14.2.1.2. Products
- 14.2.1.3. SWOT Analysis
- 14.2.1.4. Recent Developments
- 14.2.1.5. Financials (Based on Availability)
- 14.2.2 Farber Specialty Vehicles
- 14.2.2.1. Overview
- 14.2.2.2. Products
- 14.2.2.3. SWOT Analysis
- 14.2.2.4. Recent Developments
- 14.2.2.5. Financials (Based on Availability)
- 14.2.3 Spartan Motors Inc (Shyft Group)
- 14.2.3.1. Overview
- 14.2.3.2. Products
- 14.2.3.3. SWOT Analysis
- 14.2.3.4. Recent Developments
- 14.2.3.5. Financials (Based on Availability)
- 14.2.4 Force Motors Limited
- 14.2.4.1. Overview
- 14.2.4.2. Products
- 14.2.4.3. SWOT Analysis
- 14.2.4.4. Recent Developments
- 14.2.4.5. Financials (Based on Availability)
- 14.2.5 General Motors Company
- 14.2.5.1. Overview
- 14.2.5.2. Products
- 14.2.5.3. SWOT Analysis
- 14.2.5.4. Recent Developments
- 14.2.5.5. Financials (Based on Availability)
- 14.2.6 Specialty Vehicles Inc
- 14.2.6.1. Overview
- 14.2.6.2. Products
- 14.2.6.3. SWOT Analysis
- 14.2.6.4. Recent Developments
- 14.2.6.5. Financials (Based on Availability)
- 14.2.7 Daimler AG
- 14.2.7.1. Overview
- 14.2.7.2. Products
- 14.2.7.3. SWOT Analysis
- 14.2.7.4. Recent Developments
- 14.2.7.5. Financials (Based on Availability)
- 14.2.8 Volvo Group
- 14.2.8.1. Overview
- 14.2.8.2. Products
- 14.2.8.3. SWOT Analysis
- 14.2.8.4. Recent Developments
- 14.2.8.5. Financials (Based on Availability)
- 14.2.9 Emergency One Group
- 14.2.9.1. Overview
- 14.2.9.2. Products
- 14.2.9.3. SWOT Analysis
- 14.2.9.4. Recent Developments
- 14.2.9.5. Financials (Based on Availability)
- 14.2.10 Matthews Specialty Vehicles Inc
- 14.2.10.1. Overview
- 14.2.10.2. Products
- 14.2.10.3. SWOT Analysis
- 14.2.10.4. Recent Developments
- 14.2.10.5. Financials (Based on Availability)
- 14.2.11 LDV Inc
- 14.2.11.1. Overview
- 14.2.11.2. Products
- 14.2.11.3. SWOT Analysis
- 14.2.11.4. Recent Developments
- 14.2.11.5. Financials (Based on Availability)
- 14.2.12 Oshkosh Corporatio
- 14.2.12.1. Overview
- 14.2.12.2. Products
- 14.2.12.3. SWOT Analysis
- 14.2.12.4. Recent Developments
- 14.2.12.5. Financials (Based on Availability)
- 14.2.1 REV Group
List of Figures
- Figure 1: Global Specialty Vehicle Industry Revenue Breakdown (Million, %) by Region 2024 & 2032
- Figure 2: North America Specialty Vehicle Industry Revenue (Million), by Country 2024 & 2032
- Figure 3: North America Specialty Vehicle Industry Revenue Share (%), by Country 2024 & 2032
- Figure 4: Europe Specialty Vehicle Industry Revenue (Million), by Country 2024 & 2032
- Figure 5: Europe Specialty Vehicle Industry Revenue Share (%), by Country 2024 & 2032
- Figure 6: Asia Pacific Specialty Vehicle Industry Revenue (Million), by Country 2024 & 2032
- Figure 7: Asia Pacific Specialty Vehicle Industry Revenue Share (%), by Country 2024 & 2032
- Figure 8: Rest of the World Specialty Vehicle Industry Revenue (Million), by Country 2024 & 2032
- Figure 9: Rest of the World Specialty Vehicle Industry Revenue Share (%), by Country 2024 & 2032
- Figure 10: North America Specialty Vehicle Industry Revenue (Million), by Type 2024 & 2032
- Figure 11: North America Specialty Vehicle Industry Revenue Share (%), by Type 2024 & 2032
- Figure 12: North America Specialty Vehicle Industry Revenue (Million), by Application Type 2024 & 2032
- Figure 13: North America Specialty Vehicle Industry Revenue Share (%), by Application Type 2024 & 2032
- Figure 14: North America Specialty Vehicle Industry Revenue (Million), by Country 2024 & 2032
- Figure 15: North America Specialty Vehicle Industry Revenue Share (%), by Country 2024 & 2032
- Figure 16: Europe Specialty Vehicle Industry Revenue (Million), by Type 2024 & 2032
- Figure 17: Europe Specialty Vehicle Industry Revenue Share (%), by Type 2024 & 2032
- Figure 18: Europe Specialty Vehicle Industry Revenue (Million), by Application Type 2024 & 2032
- Figure 19: Europe Specialty Vehicle Industry Revenue Share (%), by Application Type 2024 & 2032
- Figure 20: Europe Specialty Vehicle Industry Revenue (Million), by Country 2024 & 2032
- Figure 21: Europe Specialty Vehicle Industry Revenue Share (%), by Country 2024 & 2032
- Figure 22: Asia Pacific Specialty Vehicle Industry Revenue (Million), by Type 2024 & 2032
- Figure 23: Asia Pacific Specialty Vehicle Industry Revenue Share (%), by Type 2024 & 2032
- Figure 24: Asia Pacific Specialty Vehicle Industry Revenue (Million), by Application Type 2024 & 2032
- Figure 25: Asia Pacific Specialty Vehicle Industry Revenue Share (%), by Application Type 2024 & 2032
- Figure 26: Asia Pacific Specialty Vehicle Industry Revenue (Million), by Country 2024 & 2032
- Figure 27: Asia Pacific Specialty Vehicle Industry Revenue Share (%), by Country 2024 & 2032
- Figure 28: Rest of the World Specialty Vehicle Industry Revenue (Million), by Type 2024 & 2032
- Figure 29: Rest of the World Specialty Vehicle Industry Revenue Share (%), by Type 2024 & 2032
- Figure 30: Rest of the World Specialty Vehicle Industry Revenue (Million), by Application Type 2024 & 2032
- Figure 31: Rest of the World Specialty Vehicle Industry Revenue Share (%), by Application Type 2024 & 2032
- Figure 32: Rest of the World Specialty Vehicle Industry Revenue (Million), by Country 2024 & 2032
- Figure 33: Rest of the World Specialty Vehicle Industry Revenue Share (%), by Country 2024 & 2032
List of Tables
- Table 1: Global Specialty Vehicle Industry Revenue Million Forecast, by Region 2019 & 2032
- Table 2: Global Specialty Vehicle Industry Revenue Million Forecast, by Type 2019 & 2032
- Table 3: Global Specialty Vehicle Industry Revenue Million Forecast, by Application Type 2019 & 2032
- Table 4: Global Specialty Vehicle Industry Revenue Million Forecast, by Region 2019 & 2032
- Table 5: Global Specialty Vehicle Industry Revenue Million Forecast, by Country 2019 & 2032
- Table 6: United States Specialty Vehicle Industry Revenue (Million) Forecast, by Application 2019 & 2032
- Table 7: Canada Specialty Vehicle Industry Revenue (Million) Forecast, by Application 2019 & 2032
- Table 8: Rest of North America Specialty Vehicle Industry Revenue (Million) Forecast, by Application 2019 & 2032
- Table 9: Global Specialty Vehicle Industry Revenue Million Forecast, by Country 2019 & 2032
- Table 10: Germany Specialty Vehicle Industry Revenue (Million) Forecast, by Application 2019 & 2032
- Table 11: United Kingdom Specialty Vehicle Industry Revenue (Million) Forecast, by Application 2019 & 2032
- Table 12: France Specialty Vehicle Industry Revenue (Million) Forecast, by Application 2019 & 2032
- Table 13: Rest of Europe Specialty Vehicle Industry Revenue (Million) Forecast, by Application 2019 & 2032
- Table 14: Global Specialty Vehicle Industry Revenue Million Forecast, by Country 2019 & 2032
- Table 15: China Specialty Vehicle Industry Revenue (Million) Forecast, by Application 2019 & 2032
- Table 16: India Specialty Vehicle Industry Revenue (Million) Forecast, by Application 2019 & 2032
- Table 17: Japan Specialty Vehicle Industry Revenue (Million) Forecast, by Application 2019 & 2032
- Table 18: South Korea Specialty Vehicle Industry Revenue (Million) Forecast, by Application 2019 & 2032
- Table 19: Rest of Asia Pacific Specialty Vehicle Industry Revenue (Million) Forecast, by Application 2019 & 2032
- Table 20: Global Specialty Vehicle Industry Revenue Million Forecast, by Country 2019 & 2032
- Table 21: South America Specialty Vehicle Industry Revenue (Million) Forecast, by Application 2019 & 2032
- Table 22: Middle East and Africa Specialty Vehicle Industry Revenue (Million) Forecast, by Application 2019 & 2032
- Table 23: Global Specialty Vehicle Industry Revenue Million Forecast, by Type 2019 & 2032
- Table 24: Global Specialty Vehicle Industry Revenue Million Forecast, by Application Type 2019 & 2032
- Table 25: Global Specialty Vehicle Industry Revenue Million Forecast, by Country 2019 & 2032
- Table 26: United States Specialty Vehicle Industry Revenue (Million) Forecast, by Application 2019 & 2032
- Table 27: Canada Specialty Vehicle Industry Revenue (Million) Forecast, by Application 2019 & 2032
- Table 28: Rest of North America Specialty Vehicle Industry Revenue (Million) Forecast, by Application 2019 & 2032
- Table 29: Global Specialty Vehicle Industry Revenue Million Forecast, by Type 2019 & 2032
- Table 30: Global Specialty Vehicle Industry Revenue Million Forecast, by Application Type 2019 & 2032
- Table 31: Global Specialty Vehicle Industry Revenue Million Forecast, by Country 2019 & 2032
- Table 32: Germany Specialty Vehicle Industry Revenue (Million) Forecast, by Application 2019 & 2032
- Table 33: United Kingdom Specialty Vehicle Industry Revenue (Million) Forecast, by Application 2019 & 2032
- Table 34: France Specialty Vehicle Industry Revenue (Million) Forecast, by Application 2019 & 2032
- Table 35: Rest of Europe Specialty Vehicle Industry Revenue (Million) Forecast, by Application 2019 & 2032
- Table 36: Global Specialty Vehicle Industry Revenue Million Forecast, by Type 2019 & 2032
- Table 37: Global Specialty Vehicle Industry Revenue Million Forecast, by Application Type 2019 & 2032
- Table 38: Global Specialty Vehicle Industry Revenue Million Forecast, by Country 2019 & 2032
- Table 39: China Specialty Vehicle Industry Revenue (Million) Forecast, by Application 2019 & 2032
- Table 40: India Specialty Vehicle Industry Revenue (Million) Forecast, by Application 2019 & 2032
- Table 41: Japan Specialty Vehicle Industry Revenue (Million) Forecast, by Application 2019 & 2032
- Table 42: South Korea Specialty Vehicle Industry Revenue (Million) Forecast, by Application 2019 & 2032
- Table 43: Rest of Asia Pacific Specialty Vehicle Industry Revenue (Million) Forecast, by Application 2019 & 2032
- Table 44: Global Specialty Vehicle Industry Revenue Million Forecast, by Type 2019 & 2032
- Table 45: Global Specialty Vehicle Industry Revenue Million Forecast, by Application Type 2019 & 2032
- Table 46: Global Specialty Vehicle Industry Revenue Million Forecast, by Country 2019 & 2032
- Table 47: South America Specialty Vehicle Industry Revenue (Million) Forecast, by Application 2019 & 2032
- Table 48: Middle East and Africa Specialty Vehicle Industry Revenue (Million) Forecast, by Application 2019 & 2032
Frequently Asked Questions
1. What is the projected Compound Annual Growth Rate (CAGR) of the Specialty Vehicle Industry?
The projected CAGR is approximately 3.16%.
2. Which companies are prominent players in the Specialty Vehicle Industry?
Key companies in the market include REV Group, Farber Specialty Vehicles, Spartan Motors Inc (Shyft Group), Force Motors Limited, General Motors Company, Specialty Vehicles Inc, Daimler AG, Volvo Group, Emergency One Group, Matthews Specialty Vehicles Inc, LDV Inc, Oshkosh Corporatio.
3. What are the main segments of the Specialty Vehicle Industry?
The market segments include Type, Application Type.
4. Can you provide details about the market size?
The market size is estimated to be USD 106.39 Million as of 2022.
5. What are some drivers contributing to market growth?
Rise in demand for Advanced Comfort Systems In Vehicles.
6. What are the notable trends driving market growth?
Increase in Spending on Law Enforcement and Healthcare Facilities.
7. Are there any restraints impacting market growth?
High Cost Assoicated with Advanced Features.
8. Can you provide examples of recent developments in the market?
Jun 2022: Minsk Automobile Plant (MAZ) announced the launch of the MAZ minibus line. New products MAZ-281040 and MAZ-365022 were introduced at the event. MAZ-365022 is a light-duty commercial vehicle. This vehicle can be used to transport anything from a manufactured goods van to an ambulance.
9. What pricing options are available for accessing the report?
Pricing options include single-user, multi-user, and enterprise licenses priced at USD 4750, USD 5250, and USD 8750 respectively.
10. Is the market size provided in terms of value or volume?
The market size is provided in terms of value, measured in Million.
11. Are there any specific market keywords associated with the report?
Yes, the market keyword associated with the report is "Specialty Vehicle Industry," which aids in identifying and referencing the specific market segment covered.
12. How do I determine which pricing option suits my needs best?
The pricing options vary based on user requirements and access needs. Individual users may opt for single-user licenses, while businesses requiring broader access may choose multi-user or enterprise licenses for cost-effective access to the report.
13. Are there any additional resources or data provided in the Specialty Vehicle Industry report?
While the report offers comprehensive insights, it's advisable to review the specific contents or supplementary materials provided to ascertain if additional resources or data are available.
14. How can I stay updated on further developments or reports in the Specialty Vehicle Industry?
To stay informed about further developments, trends, and reports in the Specialty Vehicle Industry, consider subscribing to industry newsletters, following relevant companies and organizations, or regularly checking reputable industry news sources and publications.
Methodology
Step 1 - Identification of Relevant Samples Size from Population Database


Step 2 - Approaches for Defining Global Market Size (Value, Volume* & Price*)

Note*: In applicable scenarios
Step 3 - Data Sources
Primary Research
- Web Analytics
- Survey Reports
- Research Institute
- Latest Research Reports
- Opinion Leaders
Secondary Research
- Annual Reports
- White Paper
- Latest Press Release
- Industry Association
- Paid Database
- Investor Presentations

Step 4 - Data Triangulation
Involves using different sources of information in order to increase the validity of a study
These sources are likely to be stakeholders in a program - participants, other researchers, program staff, other community members, and so on.
Then we put all data in single framework & apply various statistical tools to find out the dynamic on the market.
During the analysis stage, feedback from the stakeholder groups would be compared to determine areas of agreement as well as areas of divergence


