

Key Insights
The global sports protective equipment market, valued at 325 million in 2025, is projected to grow at a compound annual growth rate (CAGR) of 1.2% from 2025 to 2033. This growth is driven by increased sports participation across traditional, extreme, and fitness activities, alongside a heightened awareness of injury prevention and long-term health. Technological advancements in comfort and effectiveness further enhance market appeal, supported by the expanding reach of e-commerce platforms. Potential challenges include economic volatility and material cost fluctuations. Segmentation by equipment type (ball sports, fitness, extreme sports, others) and distribution channel (offline, online) presents strategic opportunities for targeted market penetration. The competitive landscape features established global brands like Adidas, Nike, and Under Armour, alongside specialized niche players.
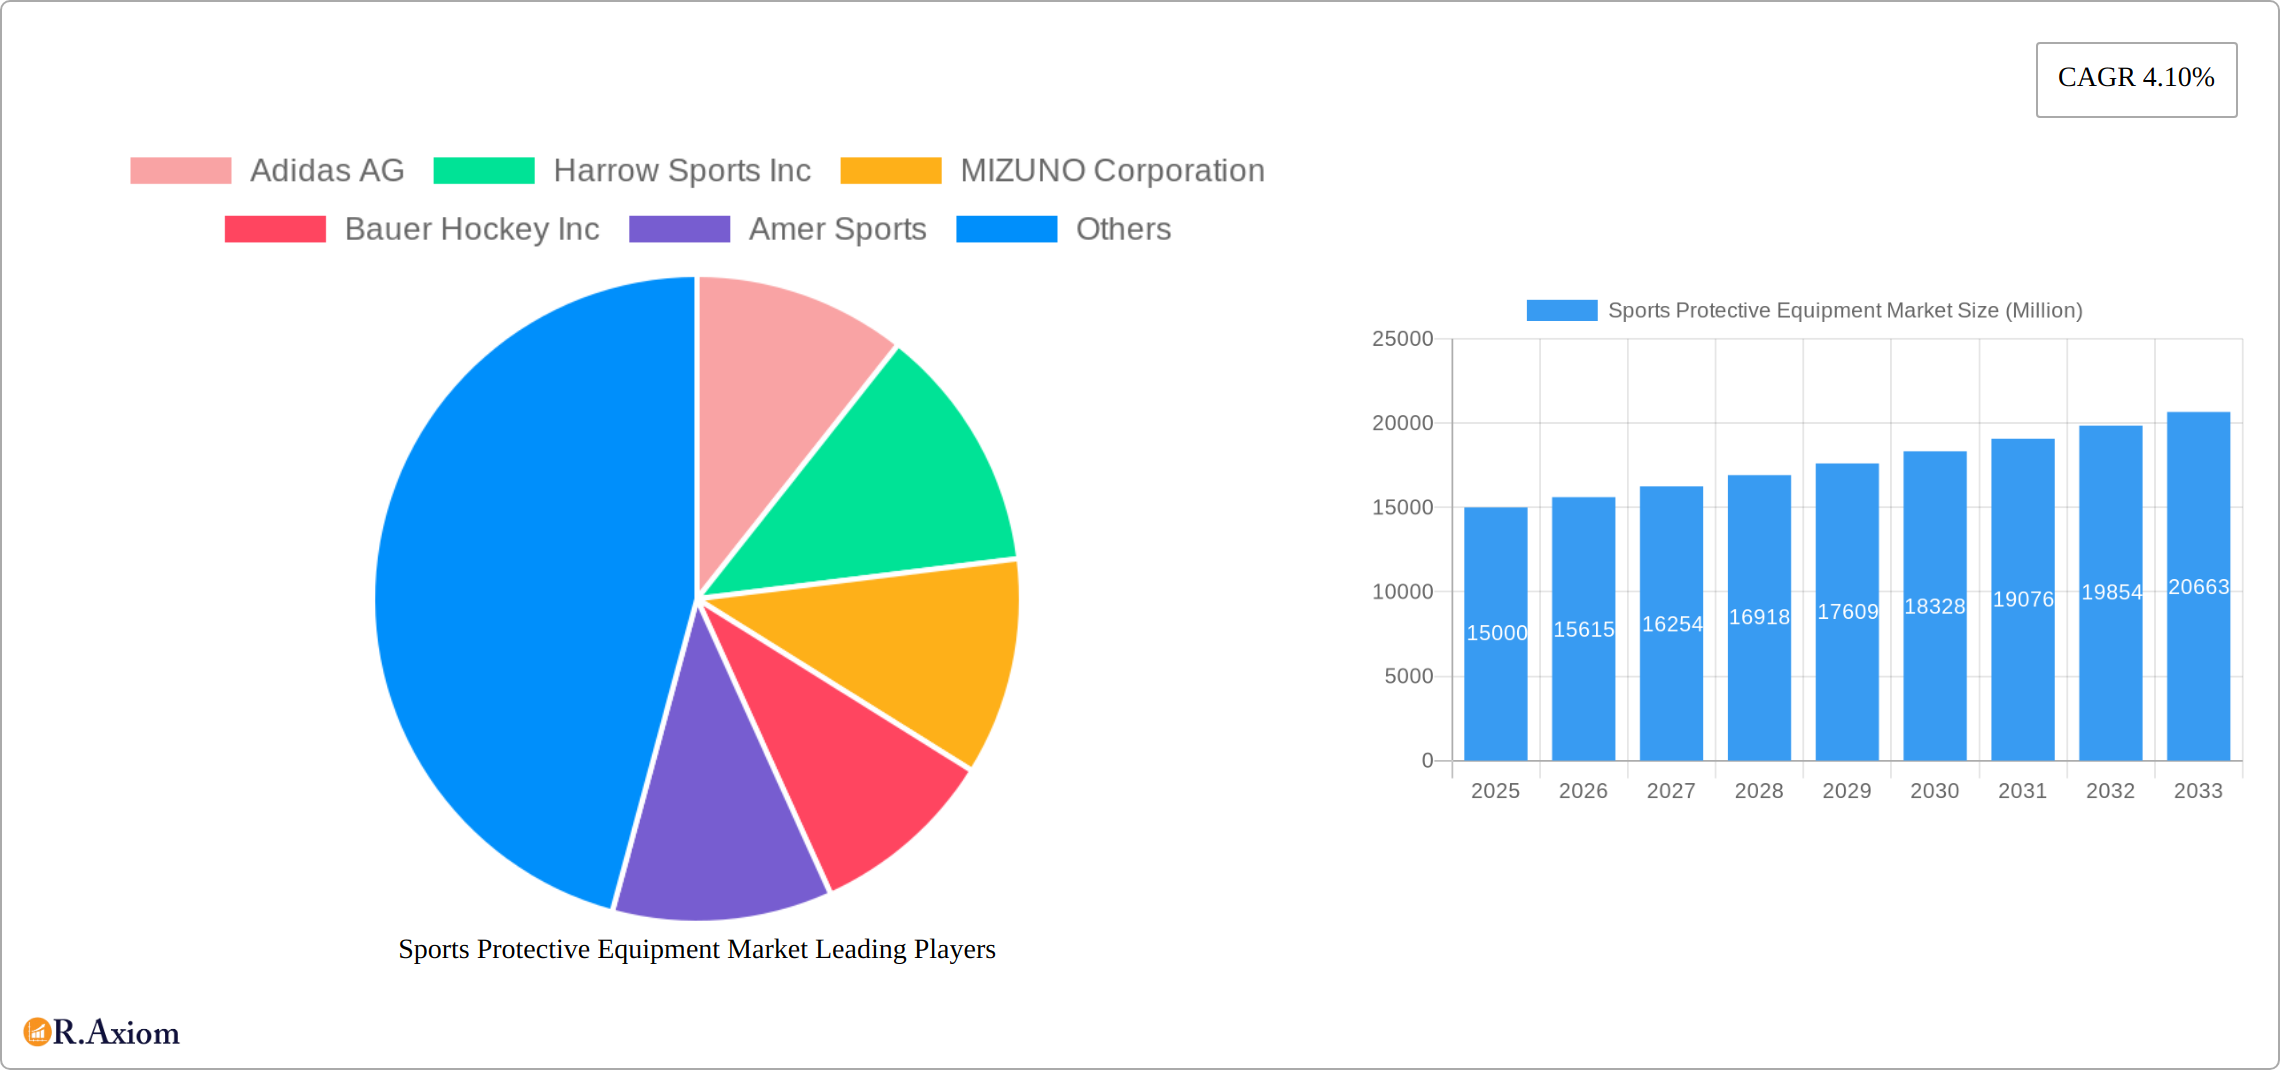
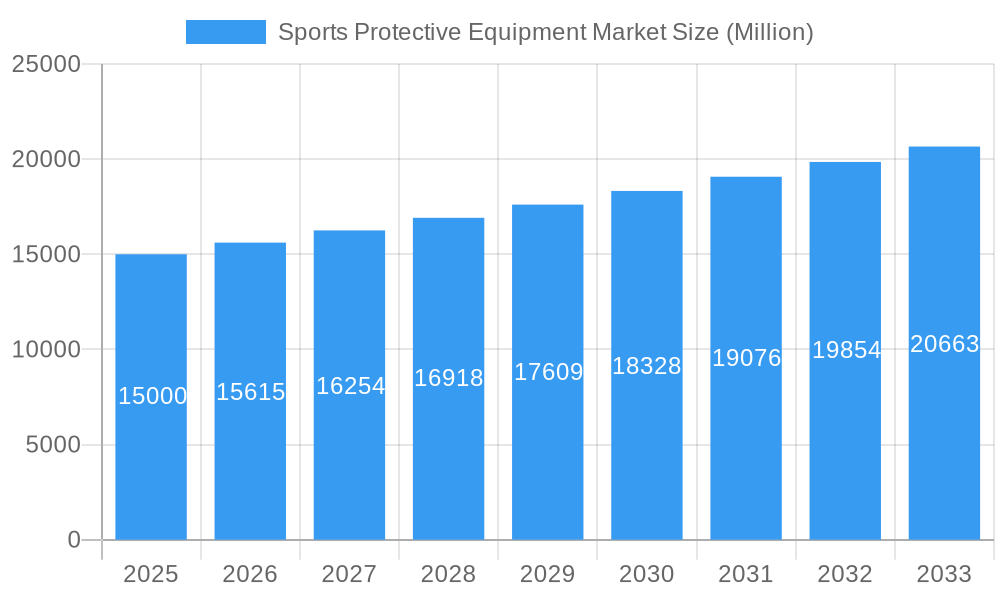
Sports Protective Equipment Market Market Size (In Million)
North America and Europe lead the market due to established sports cultures and disposable income. The Asia-Pacific region shows significant growth potential driven by rising sports participation and increasing consumer spending in economies like China and India. South America, the Middle East, and Africa present emerging opportunities, influenced by economic conditions and infrastructure. Future market dynamics will be shaped by evolving consumer preferences, technological innovation, and effective marketing in emerging markets and sports trends. The forecast period will emphasize product innovation, sustainability, and customization to meet individual athlete needs.
Sports Protective Equipment Market Company Market Share
Sports Protective Equipment Market: A Comprehensive Report (2019-2033)
This detailed report provides a comprehensive analysis of the global Sports Protective Equipment market, offering valuable insights into market dynamics, key players, and future growth potential. The study period covers 2019-2033, with 2025 as the base year and estimated year, and a forecast period of 2025-2033. The historical period analyzed is 2019-2024. This report is crucial for industry stakeholders, investors, and businesses seeking to understand and capitalize on opportunities within this growing market.
Sports Protective Equipment Market Concentration & Innovation
This section analyzes the competitive landscape of the Sports Protective Equipment market, exploring market concentration, innovation drivers, regulatory frameworks, product substitutes, end-user trends, and mergers & acquisitions (M&A) activities. The market exhibits a moderately concentrated structure, with key players holding significant market share. For example, Adidas AG, Nike Inc., and Under Armour collectively account for an estimated xx% of the global market share in 2025. Innovation is a key driver, with companies continuously developing advanced materials and technologies to enhance product performance and safety. Regulatory frameworks, particularly concerning product safety and environmental standards, play a crucial role. The market witnesses considerable M&A activity, with deal values totaling an estimated xx Million in the period 2019-2024. These activities are primarily driven by the need to expand product portfolios, access new markets, and enhance technological capabilities.
- Market Concentration: Moderately concentrated, with top players holding xx% market share (2025).
- Innovation Drivers: Advanced materials, technological advancements, improved safety features.
- Regulatory Frameworks: Emphasis on product safety and environmental compliance.
- Product Substitutes: Limited direct substitutes, but competition exists from alternative materials and designs.
- End-User Trends: Growing participation in various sports and fitness activities.
- M&A Activity: Estimated xx Million in deal values (2019-2024), driven by expansion and innovation.
Sports Protective Equipment Market Industry Trends & Insights
The Sports Protective Equipment market is experiencing robust growth, fueled by a confluence of factors. The global surge in participation across diverse sports and fitness activities significantly drives demand for protective gear. This heightened demand is further amplified by technological advancements, encompassing the utilization of cutting-edge materials such as carbon fiber and innovative designs that enhance both product performance and user comfort. A shift in consumer preferences, prioritizing safety and performance features, profoundly influences market trends. The competitive landscape is fiercely contested, with established industry leaders and emerging companies engaging in a dynamic interplay of continuous product innovation and optimized pricing strategies. Market projections indicate a Compound Annual Growth Rate (CAGR) of xx% during the forecast period (2025-2033), with consistent market penetration across various geographical regions and product segments. Specific examples of technological disruptions include the development of lightweight yet exceptionally protective materials and the integration of smart sensors enabling real-time performance monitoring and data analysis, offering valuable insights for athletes and coaches alike.
Dominant Markets & Segments in Sports Protective Equipment Market
The North American region currently holds the dominant position in the global Sports Protective Equipment market, driven by factors such as high sports participation rates and strong consumer spending power. Within the market segmentation, Ball Sports Protective Equipment and Fitness Sports Protective Equipment represent the largest segments by type, reflecting the popularity of these activities. Online retail stores are gaining significant traction as a distribution channel, benefiting from increased e-commerce adoption and improved online shopping experiences.
- Leading Region: North America (driven by high sports participation and consumer spending).
- Dominant Segments (By Type): Ball Sports Protective Equipment and Fitness Sports Protective Equipment.
- Dominant Segments (By Distribution Channel): Online Retail Stores are witnessing strong growth, while Offline Retail Stores maintain a significant presence.
- Key Drivers (North America): High disposable income, strong sporting culture, robust e-commerce infrastructure.
Sports Protective Equipment Market Product Developments
Recent years have witnessed a remarkable acceleration in product innovation within the sports protective equipment sector. The market is being reshaped by the introduction of lightweight yet exceptionally protective materials, refined designs that enhance comfort and improve freedom of movement, and the seamless integration of smart technologies such as sensors for real-time data analysis. These advancements directly address the evolving requirements of athletes and fitness enthusiasts seeking enhanced performance, unwavering safety, and unparalleled convenience. Product development strategies increasingly focus on specific sports and activities, providing tailored protection and specialized features to meet the unique demands of each discipline.
Report Scope & Segmentation Analysis
This report comprehensively analyzes the Sports Protective Equipment market across various segments.
By Type:
- Ball Sports Protective Equipment: This segment includes helmets, pads, and other protective gear for sports like baseball, basketball, and soccer. It is projected to grow at a CAGR of xx% during the forecast period, driven by the increasing popularity of these sports globally.
- Fitness Sports Protective Equipment: This encompasses equipment for activities like yoga, weightlifting, and cycling. Its growth is linked to the rising fitness consciousness and adoption of various exercise regimes. Projected CAGR: xx%.
- Extreme Sports Protective Equipment: This includes specialized gear for activities like skateboarding, snowboarding, and rock climbing. The growth of this segment reflects a rise in participation in extreme sports. Projected CAGR: xx%.
- Others: This category encompasses other types of protective equipment and is expected to grow at a CAGR of xx%.
By Distribution Channel:
- Offline Retail Stores: Traditional retail channels continue to play a significant role, although their share is being challenged by online channels. Growth is projected at a CAGR of xx%.
- Online Retail Stores: The online segment is expanding rapidly due to the convenience and accessibility offered. Projected CAGR: xx%.
Key Drivers of Sports Protective Equipment Market Growth
The growth of the Sports Protective Equipment market is propelled by several key factors. Increased participation in sports and fitness activities globally fuels demand for protective gear. Technological advancements lead to innovative designs and materials enhancing safety and performance. Rising disposable incomes, particularly in emerging economies, are boosting consumer spending on sports and fitness products. Government initiatives promoting sports and fitness further contribute to market expansion.
Challenges in the Sports Protective Equipment Market Sector
Despite the market's growth trajectory, the Sports Protective Equipment sector faces several key challenges. The increasing stringency of regulatory requirements concerning product safety and environmental sustainability standards can lead to elevated production costs. Supply chain disruptions pose a significant threat, potentially impacting product availability and leading to price volatility. The highly competitive landscape, characterized by intense rivalry among established players and emerging competitors, exerts pricing pressure and necessitates continuous innovation to maintain a competitive edge. Furthermore, fluctuations in raw material prices can significantly affect profitability margins, demanding robust supply chain management and cost optimization strategies.
Emerging Opportunities in Sports Protective Equipment Market
Several emerging opportunities exist in the Sports Protective Equipment market. The rising popularity of e-sports and virtual reality fitness creates new avenues for specialized protective equipment. The integration of smart technologies, such as sensors and data analytics, offers scope for advanced product development and personalized fitness solutions. Expansion into untapped markets, especially in developing economies, presents significant growth potential.
Leading Players in the Sports Protective Equipment Market Market
- Adidas AG
- Harrow Sports Inc
- MIZUNO Corporation
- Bauer Hockey Inc
- Amer Sports
- Schutt Sports Inc
- Puma SE
- Nike Inc
- Under Armour
Key Developments in Sports Protective Equipment Market Industry
- Jan 2023: Adidas AG launched a new line of sustainable protective equipment.
- May 2022: Nike Inc. acquired a smaller protective equipment manufacturer, expanding its product portfolio.
- Oct 2021: Under Armour introduced smart sensors in its protective gear for data tracking.
- (Further developments will be detailed in the full report)
Strategic Outlook for Sports Protective Equipment Market Market
The future of the Sports Protective Equipment market presents a compelling outlook. Sustained growth in sports participation, coupled with relentless technological innovation and escalating consumer spending, is poised to drive significant market expansion. Companies prioritizing sustainability initiatives and embracing data-driven personalization strategies are likely to gain a distinct competitive advantage. Strategic partnerships and acquisitions will play a pivotal role in shaping the competitive landscape. The market presents substantial opportunities for both established industry leaders and emerging companies to capitalize on the burgeoning demand for high-performance, safe, and technologically advanced protective equipment. This demand is further fueled by the growing awareness of injury prevention and the desire for enhanced athletic performance.
Sports Protective Equipment Market Segmentation
-
1. Type
- 1.1. Ball Sports Protective Equipment
- 1.2. Fitness Sports Protective Equipment
- 1.3. Extreme Sports Protective Equipment
- 1.4. Others
-
2. Distribution Channel
- 2.1. Offline Retail Stores
- 2.2. Online Retail Stores
Sports Protective Equipment Market Segmentation By Geography
-
1. North America
- 1.1. United States
- 1.2. Canada
- 1.3. Mexico
- 1.4. Rest of North America
-
2. Europe
- 2.1. Spain
- 2.2. United Kingdom
- 2.3. Germany
- 2.4. France
- 2.5. Italy
- 2.6. Russia
- 2.7. Rest of Europe
-
3. Asia Pacific
- 3.1. China
- 3.2. Japan
- 3.3. India
- 3.4. Australia
- 3.5. Rest of Asia Pacific
-
4. South America
- 4.1. Brazil
- 4.2. Argentina
- 4.3. Rest of South America
-
5. Middle East and Africa
- 5.1. South Africa
- 5.2. United Arab Emirates
- 5.3. Rest of Middle East and Africa
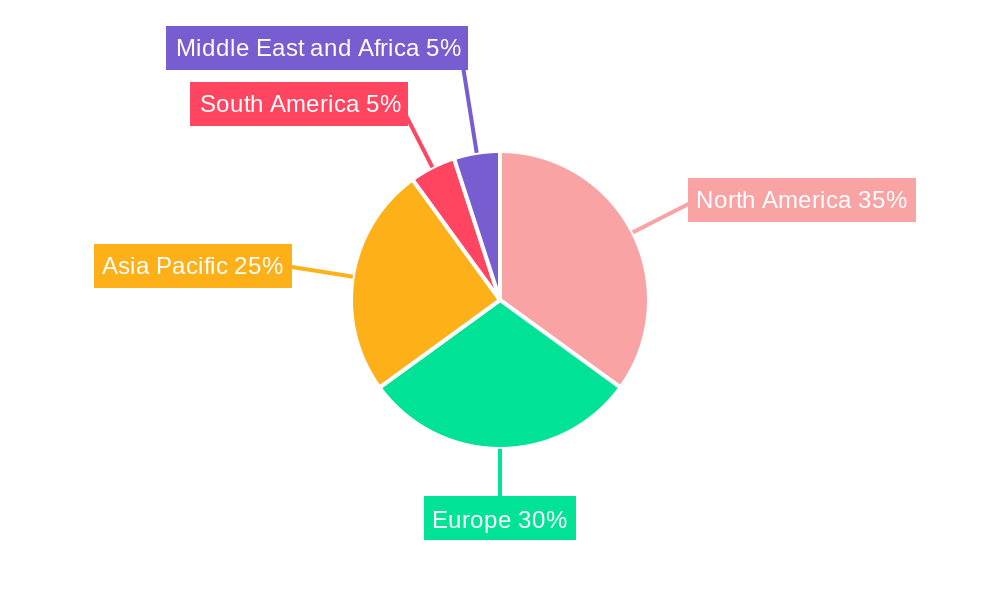
Sports Protective Equipment Market Regional Market Share
Geographic Coverage of Sports Protective Equipment Market
Sports Protective Equipment Market REPORT HIGHLIGHTS
| Aspects | Details |
|---|---|
| Study Period | 2020-2034 |
| Base Year | 2025 |
| Estimated Year | 2026 |
| Forecast Period | 2026-2034 |
| Historical Period | 2020-2025 |
| Growth Rate | CAGR of 1.2% from 2020-2034 |
| Segmentation |
|
Table of Contents
- 1. Introduction
- 1.1. Research Scope
- 1.2. Market Segmentation
- 1.3. Research Objective
- 1.4. Definitions and Assumptions
- 2. Executive Summary
- 2.1. Market Snapshot
- 3. Market Dynamics
- 3.1. Market Drivers
- 3.2. Market Restrains
- 3.3. Market Trends
- 3.4. Market Opportunities
- 4. Market Factor Analysis
- 4.1. Porters Five Forces
- 4.1.1. Bargaining Power of Suppliers
- 4.1.2. Bargaining Power of Buyers
- 4.1.3. Threat of New Entrants
- 4.1.4. Threat of Substitutes
- 4.1.5. Competitive Rivalry
- 4.2. PESTEL analysis
- 4.3. BCG Analysis
- 4.3.1. Stars (High Growth, High Market Share)
- 4.3.2. Cash Cows (Low Growth, High Market Share)
- 4.3.3. Question Mark (High Growth, Low Market Share)
- 4.3.4. Dogs (Low Growth, Low Market Share)
- 4.4. Ansoff Matrix Analysis
- 4.5. Supply Chain Analysis
- 4.6. Regulatory Landscape
- 4.7. Current Market Potential and Opportunity Assessment (TAM–SAM–SOM Framework)
- 4.8. RAX Analyst Note
- 4.1. Porters Five Forces
- 5. Market Analysis, Insights and Forecast 2021-2033
- 5.1. Market Analysis, Insights and Forecast - by Type
- 5.1.1. Ball Sports Protective Equipment
- 5.1.2. Fitness Sports Protective Equipment
- 5.1.3. Extreme Sports Protective Equipment
- 5.1.4. Others
- 5.2. Market Analysis, Insights and Forecast - by Distribution Channel
- 5.2.1. Offline Retail Stores
- 5.2.2. Online Retail Stores
- 5.3. Market Analysis, Insights and Forecast - by Region
- 5.3.1. North America
- 5.3.2. Europe
- 5.3.3. Asia Pacific
- 5.3.4. South America
- 5.3.5. Middle East and Africa
- 5.1. Market Analysis, Insights and Forecast - by Type
- 6. Global Sports Protective Equipment Market Analysis, Insights and Forecast, 2021-2033
- 6.1. Market Analysis, Insights and Forecast - by Type
- 6.1.1. Ball Sports Protective Equipment
- 6.1.2. Fitness Sports Protective Equipment
- 6.1.3. Extreme Sports Protective Equipment
- 6.1.4. Others
- 6.2. Market Analysis, Insights and Forecast - by Distribution Channel
- 6.2.1. Offline Retail Stores
- 6.2.2. Online Retail Stores
- 6.1. Market Analysis, Insights and Forecast - by Type
- 7. North America Sports Protective Equipment Market Analysis, Insights and Forecast, 2020-2032
- 7.1. Market Analysis, Insights and Forecast - by Type
- 7.1.1. Ball Sports Protective Equipment
- 7.1.2. Fitness Sports Protective Equipment
- 7.1.3. Extreme Sports Protective Equipment
- 7.1.4. Others
- 7.2. Market Analysis, Insights and Forecast - by Distribution Channel
- 7.2.1. Offline Retail Stores
- 7.2.2. Online Retail Stores
- 7.1. Market Analysis, Insights and Forecast - by Type
- 8. Europe Sports Protective Equipment Market Analysis, Insights and Forecast, 2020-2032
- 8.1. Market Analysis, Insights and Forecast - by Type
- 8.1.1. Ball Sports Protective Equipment
- 8.1.2. Fitness Sports Protective Equipment
- 8.1.3. Extreme Sports Protective Equipment
- 8.1.4. Others
- 8.2. Market Analysis, Insights and Forecast - by Distribution Channel
- 8.2.1. Offline Retail Stores
- 8.2.2. Online Retail Stores
- 8.1. Market Analysis, Insights and Forecast - by Type
- 9. Asia Pacific Sports Protective Equipment Market Analysis, Insights and Forecast, 2020-2032
- 9.1. Market Analysis, Insights and Forecast - by Type
- 9.1.1. Ball Sports Protective Equipment
- 9.1.2. Fitness Sports Protective Equipment
- 9.1.3. Extreme Sports Protective Equipment
- 9.1.4. Others
- 9.2. Market Analysis, Insights and Forecast - by Distribution Channel
- 9.2.1. Offline Retail Stores
- 9.2.2. Online Retail Stores
- 9.1. Market Analysis, Insights and Forecast - by Type
- 10. South America Sports Protective Equipment Market Analysis, Insights and Forecast, 2020-2032
- 10.1. Market Analysis, Insights and Forecast - by Type
- 10.1.1. Ball Sports Protective Equipment
- 10.1.2. Fitness Sports Protective Equipment
- 10.1.3. Extreme Sports Protective Equipment
- 10.1.4. Others
- 10.2. Market Analysis, Insights and Forecast - by Distribution Channel
- 10.2.1. Offline Retail Stores
- 10.2.2. Online Retail Stores
- 10.1. Market Analysis, Insights and Forecast - by Type
- 11. Middle East and Africa Sports Protective Equipment Market Analysis, Insights and Forecast, 2020-2032
- 11.1. Market Analysis, Insights and Forecast - by Type
- 11.1.1. Ball Sports Protective Equipment
- 11.1.2. Fitness Sports Protective Equipment
- 11.1.3. Extreme Sports Protective Equipment
- 11.1.4. Others
- 11.2. Market Analysis, Insights and Forecast - by Distribution Channel
- 11.2.1. Offline Retail Stores
- 11.2.2. Online Retail Stores
- 11.1. Market Analysis, Insights and Forecast - by Type
- 12. Competitive Analysis
- 12.1. Company Profiles
- 12.1.1 Adidas AG
- 12.1.1.1. Company Overview
- 12.1.1.2. Products
- 12.1.1.3. Company Financials
- 12.1.1.4. SWOT Analysis
- 12.1.2 Harrow Sports Inc
- 12.1.2.1. Company Overview
- 12.1.2.2. Products
- 12.1.2.3. Company Financials
- 12.1.2.4. SWOT Analysis
- 12.1.3 MIZUNO Corporation
- 12.1.3.1. Company Overview
- 12.1.3.2. Products
- 12.1.3.3. Company Financials
- 12.1.3.4. SWOT Analysis
- 12.1.4 Bauer Hockey Inc
- 12.1.4.1. Company Overview
- 12.1.4.2. Products
- 12.1.4.3. Company Financials
- 12.1.4.4. SWOT Analysis
- 12.1.5 Amer Sports
- 12.1.5.1. Company Overview
- 12.1.5.2. Products
- 12.1.5.3. Company Financials
- 12.1.5.4. SWOT Analysis
- 12.1.6 Schutt Sports Inc *List Not Exhaustive
- 12.1.6.1. Company Overview
- 12.1.6.2. Products
- 12.1.6.3. Company Financials
- 12.1.6.4. SWOT Analysis
- 12.1.7 Puma SE
- 12.1.7.1. Company Overview
- 12.1.7.2. Products
- 12.1.7.3. Company Financials
- 12.1.7.4. SWOT Analysis
- 12.1.8 Nike Inc
- 12.1.8.1. Company Overview
- 12.1.8.2. Products
- 12.1.8.3. Company Financials
- 12.1.8.4. SWOT Analysis
- 12.1.9 Under Armour
- 12.1.9.1. Company Overview
- 12.1.9.2. Products
- 12.1.9.3. Company Financials
- 12.1.9.4. SWOT Analysis
- 12.1.1 Adidas AG
- 12.2. Market Entropy
- 12.2.1 Company's Key Areas Served
- 12.2.2 Recent Developments
- 12.3. Company Market Share Analysis 2025
- 12.3.1 Top 5 Companies Market Share Analysis
- 12.3.2 Top 3 Companies Market Share Analysis
- 12.4. List of Potential Customers
- 13. Research Methodology
List of Figures
- Figure 1: Global Sports Protective Equipment Market Revenue Breakdown (million, %) by Region 2025 & 2033
- Figure 2: Global Sports Protective Equipment Market Volume Breakdown (K Units , %) by Region 2025 & 2033
- Figure 3: North America Sports Protective Equipment Market Revenue (million), by Type 2025 & 2033
- Figure 4: North America Sports Protective Equipment Market Volume (K Units ), by Type 2025 & 2033
- Figure 5: North America Sports Protective Equipment Market Revenue Share (%), by Type 2025 & 2033
- Figure 6: North America Sports Protective Equipment Market Volume Share (%), by Type 2025 & 2033
- Figure 7: North America Sports Protective Equipment Market Revenue (million), by Distribution Channel 2025 & 2033
- Figure 8: North America Sports Protective Equipment Market Volume (K Units ), by Distribution Channel 2025 & 2033
- Figure 9: North America Sports Protective Equipment Market Revenue Share (%), by Distribution Channel 2025 & 2033
- Figure 10: North America Sports Protective Equipment Market Volume Share (%), by Distribution Channel 2025 & 2033
- Figure 11: North America Sports Protective Equipment Market Revenue (million), by Country 2025 & 2033
- Figure 12: North America Sports Protective Equipment Market Volume (K Units ), by Country 2025 & 2033
- Figure 13: North America Sports Protective Equipment Market Revenue Share (%), by Country 2025 & 2033
- Figure 14: North America Sports Protective Equipment Market Volume Share (%), by Country 2025 & 2033
- Figure 15: Europe Sports Protective Equipment Market Revenue (million), by Type 2025 & 2033
- Figure 16: Europe Sports Protective Equipment Market Volume (K Units ), by Type 2025 & 2033
- Figure 17: Europe Sports Protective Equipment Market Revenue Share (%), by Type 2025 & 2033
- Figure 18: Europe Sports Protective Equipment Market Volume Share (%), by Type 2025 & 2033
- Figure 19: Europe Sports Protective Equipment Market Revenue (million), by Distribution Channel 2025 & 2033
- Figure 20: Europe Sports Protective Equipment Market Volume (K Units ), by Distribution Channel 2025 & 2033
- Figure 21: Europe Sports Protective Equipment Market Revenue Share (%), by Distribution Channel 2025 & 2033
- Figure 22: Europe Sports Protective Equipment Market Volume Share (%), by Distribution Channel 2025 & 2033
- Figure 23: Europe Sports Protective Equipment Market Revenue (million), by Country 2025 & 2033
- Figure 24: Europe Sports Protective Equipment Market Volume (K Units ), by Country 2025 & 2033
- Figure 25: Europe Sports Protective Equipment Market Revenue Share (%), by Country 2025 & 2033
- Figure 26: Europe Sports Protective Equipment Market Volume Share (%), by Country 2025 & 2033
- Figure 27: Asia Pacific Sports Protective Equipment Market Revenue (million), by Type 2025 & 2033
- Figure 28: Asia Pacific Sports Protective Equipment Market Volume (K Units ), by Type 2025 & 2033
- Figure 29: Asia Pacific Sports Protective Equipment Market Revenue Share (%), by Type 2025 & 2033
- Figure 30: Asia Pacific Sports Protective Equipment Market Volume Share (%), by Type 2025 & 2033
- Figure 31: Asia Pacific Sports Protective Equipment Market Revenue (million), by Distribution Channel 2025 & 2033
- Figure 32: Asia Pacific Sports Protective Equipment Market Volume (K Units ), by Distribution Channel 2025 & 2033
- Figure 33: Asia Pacific Sports Protective Equipment Market Revenue Share (%), by Distribution Channel 2025 & 2033
- Figure 34: Asia Pacific Sports Protective Equipment Market Volume Share (%), by Distribution Channel 2025 & 2033
- Figure 35: Asia Pacific Sports Protective Equipment Market Revenue (million), by Country 2025 & 2033
- Figure 36: Asia Pacific Sports Protective Equipment Market Volume (K Units ), by Country 2025 & 2033
- Figure 37: Asia Pacific Sports Protective Equipment Market Revenue Share (%), by Country 2025 & 2033
- Figure 38: Asia Pacific Sports Protective Equipment Market Volume Share (%), by Country 2025 & 2033
- Figure 39: South America Sports Protective Equipment Market Revenue (million), by Type 2025 & 2033
- Figure 40: South America Sports Protective Equipment Market Volume (K Units ), by Type 2025 & 2033
- Figure 41: South America Sports Protective Equipment Market Revenue Share (%), by Type 2025 & 2033
- Figure 42: South America Sports Protective Equipment Market Volume Share (%), by Type 2025 & 2033
- Figure 43: South America Sports Protective Equipment Market Revenue (million), by Distribution Channel 2025 & 2033
- Figure 44: South America Sports Protective Equipment Market Volume (K Units ), by Distribution Channel 2025 & 2033
- Figure 45: South America Sports Protective Equipment Market Revenue Share (%), by Distribution Channel 2025 & 2033
- Figure 46: South America Sports Protective Equipment Market Volume Share (%), by Distribution Channel 2025 & 2033
- Figure 47: South America Sports Protective Equipment Market Revenue (million), by Country 2025 & 2033
- Figure 48: South America Sports Protective Equipment Market Volume (K Units ), by Country 2025 & 2033
- Figure 49: South America Sports Protective Equipment Market Revenue Share (%), by Country 2025 & 2033
- Figure 50: South America Sports Protective Equipment Market Volume Share (%), by Country 2025 & 2033
- Figure 51: Middle East and Africa Sports Protective Equipment Market Revenue (million), by Type 2025 & 2033
- Figure 52: Middle East and Africa Sports Protective Equipment Market Volume (K Units ), by Type 2025 & 2033
- Figure 53: Middle East and Africa Sports Protective Equipment Market Revenue Share (%), by Type 2025 & 2033
- Figure 54: Middle East and Africa Sports Protective Equipment Market Volume Share (%), by Type 2025 & 2033
- Figure 55: Middle East and Africa Sports Protective Equipment Market Revenue (million), by Distribution Channel 2025 & 2033
- Figure 56: Middle East and Africa Sports Protective Equipment Market Volume (K Units ), by Distribution Channel 2025 & 2033
- Figure 57: Middle East and Africa Sports Protective Equipment Market Revenue Share (%), by Distribution Channel 2025 & 2033
- Figure 58: Middle East and Africa Sports Protective Equipment Market Volume Share (%), by Distribution Channel 2025 & 2033
- Figure 59: Middle East and Africa Sports Protective Equipment Market Revenue (million), by Country 2025 & 2033
- Figure 60: Middle East and Africa Sports Protective Equipment Market Volume (K Units ), by Country 2025 & 2033
- Figure 61: Middle East and Africa Sports Protective Equipment Market Revenue Share (%), by Country 2025 & 2033
- Figure 62: Middle East and Africa Sports Protective Equipment Market Volume Share (%), by Country 2025 & 2033
List of Tables
- Table 1: Global Sports Protective Equipment Market Revenue million Forecast, by Type 2020 & 2033
- Table 2: Global Sports Protective Equipment Market Volume K Units Forecast, by Type 2020 & 2033
- Table 3: Global Sports Protective Equipment Market Revenue million Forecast, by Distribution Channel 2020 & 2033
- Table 4: Global Sports Protective Equipment Market Volume K Units Forecast, by Distribution Channel 2020 & 2033
- Table 5: Global Sports Protective Equipment Market Revenue million Forecast, by Region 2020 & 2033
- Table 6: Global Sports Protective Equipment Market Volume K Units Forecast, by Region 2020 & 2033
- Table 7: Global Sports Protective Equipment Market Revenue million Forecast, by Type 2020 & 2033
- Table 8: Global Sports Protective Equipment Market Volume K Units Forecast, by Type 2020 & 2033
- Table 9: Global Sports Protective Equipment Market Revenue million Forecast, by Distribution Channel 2020 & 2033
- Table 10: Global Sports Protective Equipment Market Volume K Units Forecast, by Distribution Channel 2020 & 2033
- Table 11: Global Sports Protective Equipment Market Revenue million Forecast, by Country 2020 & 2033
- Table 12: Global Sports Protective Equipment Market Volume K Units Forecast, by Country 2020 & 2033
- Table 13: United States Sports Protective Equipment Market Revenue (million) Forecast, by Application 2020 & 2033
- Table 14: United States Sports Protective Equipment Market Volume (K Units ) Forecast, by Application 2020 & 2033
- Table 15: Canada Sports Protective Equipment Market Revenue (million) Forecast, by Application 2020 & 2033
- Table 16: Canada Sports Protective Equipment Market Volume (K Units ) Forecast, by Application 2020 & 2033
- Table 17: Mexico Sports Protective Equipment Market Revenue (million) Forecast, by Application 2020 & 2033
- Table 18: Mexico Sports Protective Equipment Market Volume (K Units ) Forecast, by Application 2020 & 2033
- Table 19: Rest of North America Sports Protective Equipment Market Revenue (million) Forecast, by Application 2020 & 2033
- Table 20: Rest of North America Sports Protective Equipment Market Volume (K Units ) Forecast, by Application 2020 & 2033
- Table 21: Global Sports Protective Equipment Market Revenue million Forecast, by Type 2020 & 2033
- Table 22: Global Sports Protective Equipment Market Volume K Units Forecast, by Type 2020 & 2033
- Table 23: Global Sports Protective Equipment Market Revenue million Forecast, by Distribution Channel 2020 & 2033
- Table 24: Global Sports Protective Equipment Market Volume K Units Forecast, by Distribution Channel 2020 & 2033
- Table 25: Global Sports Protective Equipment Market Revenue million Forecast, by Country 2020 & 2033
- Table 26: Global Sports Protective Equipment Market Volume K Units Forecast, by Country 2020 & 2033
- Table 27: Spain Sports Protective Equipment Market Revenue (million) Forecast, by Application 2020 & 2033
- Table 28: Spain Sports Protective Equipment Market Volume (K Units ) Forecast, by Application 2020 & 2033
- Table 29: United Kingdom Sports Protective Equipment Market Revenue (million) Forecast, by Application 2020 & 2033
- Table 30: United Kingdom Sports Protective Equipment Market Volume (K Units ) Forecast, by Application 2020 & 2033
- Table 31: Germany Sports Protective Equipment Market Revenue (million) Forecast, by Application 2020 & 2033
- Table 32: Germany Sports Protective Equipment Market Volume (K Units ) Forecast, by Application 2020 & 2033
- Table 33: France Sports Protective Equipment Market Revenue (million) Forecast, by Application 2020 & 2033
- Table 34: France Sports Protective Equipment Market Volume (K Units ) Forecast, by Application 2020 & 2033
- Table 35: Italy Sports Protective Equipment Market Revenue (million) Forecast, by Application 2020 & 2033
- Table 36: Italy Sports Protective Equipment Market Volume (K Units ) Forecast, by Application 2020 & 2033
- Table 37: Russia Sports Protective Equipment Market Revenue (million) Forecast, by Application 2020 & 2033
- Table 38: Russia Sports Protective Equipment Market Volume (K Units ) Forecast, by Application 2020 & 2033
- Table 39: Rest of Europe Sports Protective Equipment Market Revenue (million) Forecast, by Application 2020 & 2033
- Table 40: Rest of Europe Sports Protective Equipment Market Volume (K Units ) Forecast, by Application 2020 & 2033
- Table 41: Global Sports Protective Equipment Market Revenue million Forecast, by Type 2020 & 2033
- Table 42: Global Sports Protective Equipment Market Volume K Units Forecast, by Type 2020 & 2033
- Table 43: Global Sports Protective Equipment Market Revenue million Forecast, by Distribution Channel 2020 & 2033
- Table 44: Global Sports Protective Equipment Market Volume K Units Forecast, by Distribution Channel 2020 & 2033
- Table 45: Global Sports Protective Equipment Market Revenue million Forecast, by Country 2020 & 2033
- Table 46: Global Sports Protective Equipment Market Volume K Units Forecast, by Country 2020 & 2033
- Table 47: China Sports Protective Equipment Market Revenue (million) Forecast, by Application 2020 & 2033
- Table 48: China Sports Protective Equipment Market Volume (K Units ) Forecast, by Application 2020 & 2033
- Table 49: Japan Sports Protective Equipment Market Revenue (million) Forecast, by Application 2020 & 2033
- Table 50: Japan Sports Protective Equipment Market Volume (K Units ) Forecast, by Application 2020 & 2033
- Table 51: India Sports Protective Equipment Market Revenue (million) Forecast, by Application 2020 & 2033
- Table 52: India Sports Protective Equipment Market Volume (K Units ) Forecast, by Application 2020 & 2033
- Table 53: Australia Sports Protective Equipment Market Revenue (million) Forecast, by Application 2020 & 2033
- Table 54: Australia Sports Protective Equipment Market Volume (K Units ) Forecast, by Application 2020 & 2033
- Table 55: Rest of Asia Pacific Sports Protective Equipment Market Revenue (million) Forecast, by Application 2020 & 2033
- Table 56: Rest of Asia Pacific Sports Protective Equipment Market Volume (K Units ) Forecast, by Application 2020 & 2033
- Table 57: Global Sports Protective Equipment Market Revenue million Forecast, by Type 2020 & 2033
- Table 58: Global Sports Protective Equipment Market Volume K Units Forecast, by Type 2020 & 2033
- Table 59: Global Sports Protective Equipment Market Revenue million Forecast, by Distribution Channel 2020 & 2033
- Table 60: Global Sports Protective Equipment Market Volume K Units Forecast, by Distribution Channel 2020 & 2033
- Table 61: Global Sports Protective Equipment Market Revenue million Forecast, by Country 2020 & 2033
- Table 62: Global Sports Protective Equipment Market Volume K Units Forecast, by Country 2020 & 2033
- Table 63: Brazil Sports Protective Equipment Market Revenue (million) Forecast, by Application 2020 & 2033
- Table 64: Brazil Sports Protective Equipment Market Volume (K Units ) Forecast, by Application 2020 & 2033
- Table 65: Argentina Sports Protective Equipment Market Revenue (million) Forecast, by Application 2020 & 2033
- Table 66: Argentina Sports Protective Equipment Market Volume (K Units ) Forecast, by Application 2020 & 2033
- Table 67: Rest of South America Sports Protective Equipment Market Revenue (million) Forecast, by Application 2020 & 2033
- Table 68: Rest of South America Sports Protective Equipment Market Volume (K Units ) Forecast, by Application 2020 & 2033
- Table 69: Global Sports Protective Equipment Market Revenue million Forecast, by Type 2020 & 2033
- Table 70: Global Sports Protective Equipment Market Volume K Units Forecast, by Type 2020 & 2033
- Table 71: Global Sports Protective Equipment Market Revenue million Forecast, by Distribution Channel 2020 & 2033
- Table 72: Global Sports Protective Equipment Market Volume K Units Forecast, by Distribution Channel 2020 & 2033
- Table 73: Global Sports Protective Equipment Market Revenue million Forecast, by Country 2020 & 2033
- Table 74: Global Sports Protective Equipment Market Volume K Units Forecast, by Country 2020 & 2033
- Table 75: South Africa Sports Protective Equipment Market Revenue (million) Forecast, by Application 2020 & 2033
- Table 76: South Africa Sports Protective Equipment Market Volume (K Units ) Forecast, by Application 2020 & 2033
- Table 77: United Arab Emirates Sports Protective Equipment Market Revenue (million) Forecast, by Application 2020 & 2033
- Table 78: United Arab Emirates Sports Protective Equipment Market Volume (K Units ) Forecast, by Application 2020 & 2033
- Table 79: Rest of Middle East and Africa Sports Protective Equipment Market Revenue (million) Forecast, by Application 2020 & 2033
- Table 80: Rest of Middle East and Africa Sports Protective Equipment Market Volume (K Units ) Forecast, by Application 2020 & 2033
Frequently Asked Questions
1. What is the projected Compound Annual Growth Rate (CAGR) of the Sports Protective Equipment Market?
The projected CAGR is approximately 1.2%.
2. Which companies are prominent players in the Sports Protective Equipment Market?
Key companies in the market include Adidas AG, Harrow Sports Inc, MIZUNO Corporation, Bauer Hockey Inc, Amer Sports, Schutt Sports Inc *List Not Exhaustive, Puma SE, Nike Inc, Under Armour.
3. What are the main segments of the Sports Protective Equipment Market?
The market segments include Type, Distribution Channel.
4. Can you provide details about the market size?
The market size is estimated to be USD 325 million as of 2022.
5. What are some drivers contributing to market growth?
Aggressive Marketing and Strategic Investments by Key Players; Growing Prevalence of Smokeless Tobacco Supported By Growth in Production of Tobacco.
6. What are the notable trends driving market growth?
Increased Sports Participation Rate Owing to Favorable Government Initiatives.
7. Are there any restraints impacting market growth?
Stringent Government Regulations Leading to Ban on Smokeless Tobacco.
8. Can you provide examples of recent developments in the market?
N/A
9. What pricing options are available for accessing the report?
Pricing options include single-user, multi-user, and enterprise licenses priced at USD 4750, USD 5250, and USD 8750 respectively.
10. Is the market size provided in terms of value or volume?
The market size is provided in terms of value, measured in million and volume, measured in K Units .
11. Are there any specific market keywords associated with the report?
Yes, the market keyword associated with the report is "Sports Protective Equipment Market," which aids in identifying and referencing the specific market segment covered.
12. How do I determine which pricing option suits my needs best?
The pricing options vary based on user requirements and access needs. Individual users may opt for single-user licenses, while businesses requiring broader access may choose multi-user or enterprise licenses for cost-effective access to the report.
13. Are there any additional resources or data provided in the Sports Protective Equipment Market report?
While the report offers comprehensive insights, it's advisable to review the specific contents or supplementary materials provided to ascertain if additional resources or data are available.
14. How can I stay updated on further developments or reports in the Sports Protective Equipment Market?
To stay informed about further developments, trends, and reports in the Sports Protective Equipment Market, consider subscribing to industry newsletters, following relevant companies and organizations, or regularly checking reputable industry news sources and publications.
Methodology
Step 1 - Identification of Relevant Samples Size from Population Database


Step 2 - Approaches for Defining Global Market Size (Value, Volume* & Price*)

Note*: In applicable scenarios
Step 3 - Data Sources
Primary Research
- Web Analytics
- Survey Reports
- Research Institute
- Latest Research Reports
- Opinion Leaders
Secondary Research
- Annual Reports
- White Paper
- Latest Press Release
- Industry Association
- Paid Database
- Investor Presentations

Step 4 - Data Triangulation
Involves using different sources of information in order to increase the validity of a study
These sources are likely to be stakeholders in a program - participants, other researchers, program staff, other community members, and so on.
Then we put all data in single framework & apply various statistical tools to find out the dynamic on the market.
During the analysis stage, feedback from the stakeholder groups would be compared to determine areas of agreement as well as areas of divergence