

Key Insights
The global steel straps market is experiencing robust growth, driven by the increasing demand across diverse sectors like packaging, construction, and transportation. The market's expansion is fueled by several key factors: the rising preference for steel straps due to their superior strength and durability compared to alternative materials like plastic straps; the growth of e-commerce and the consequent surge in packaged goods requiring secure fastening; and the expanding construction and manufacturing industries globally. While the exact market size and CAGR are unavailable, a reasonable estimation based on industry reports suggests a market valued at approximately $5 billion in 2025, exhibiting a steady compound annual growth rate (CAGR) of around 4-5% during the forecast period of 2025-2033. This growth is further bolstered by ongoing advancements in steel strap manufacturing, leading to lighter, stronger, and more cost-effective products. However, fluctuations in raw material prices, particularly steel, and environmental concerns regarding steel production and disposal pose significant challenges to sustained market growth.
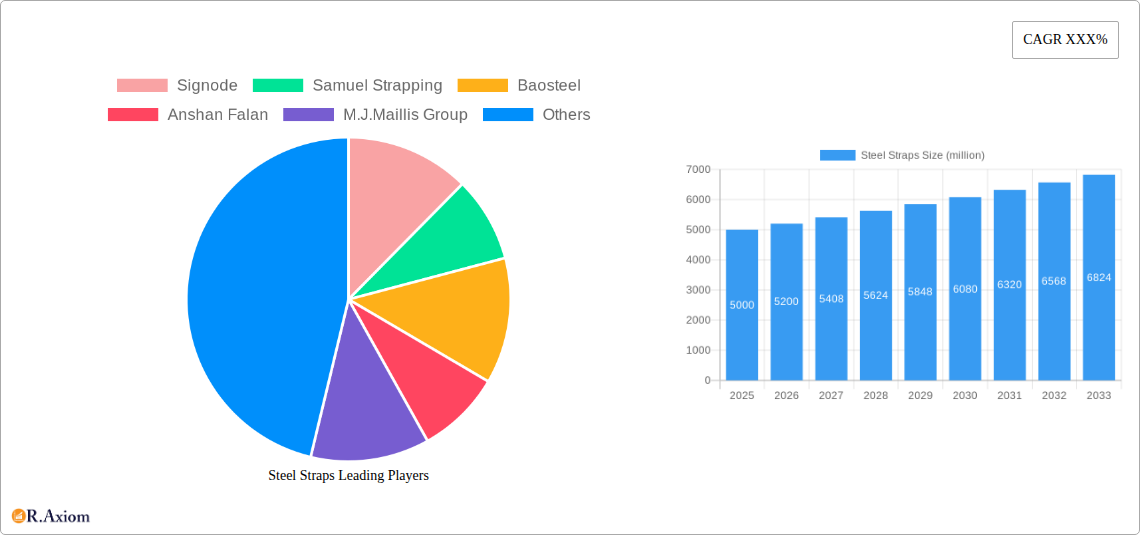
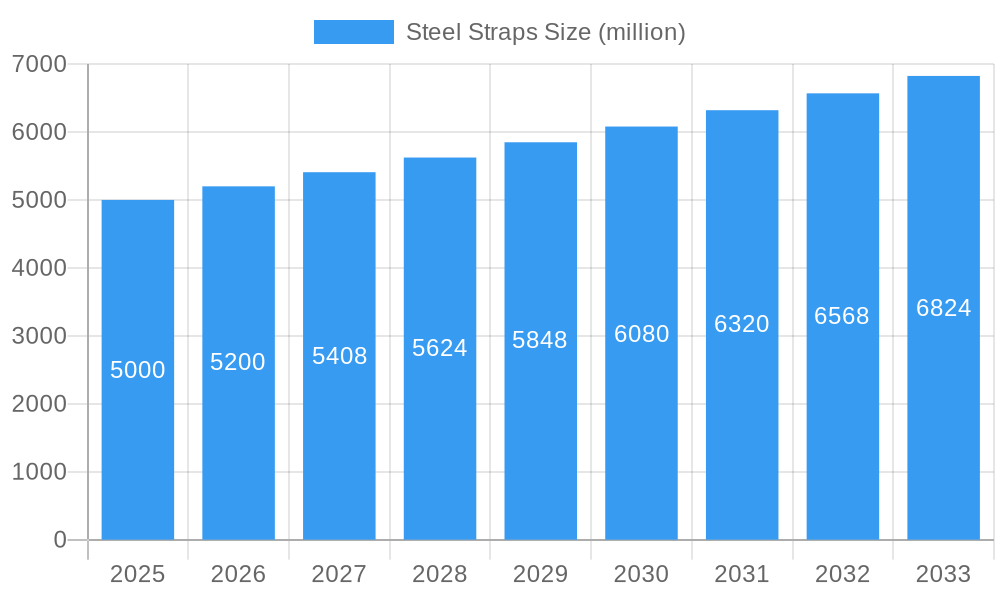
Steel Straps Market Size (In Billion)
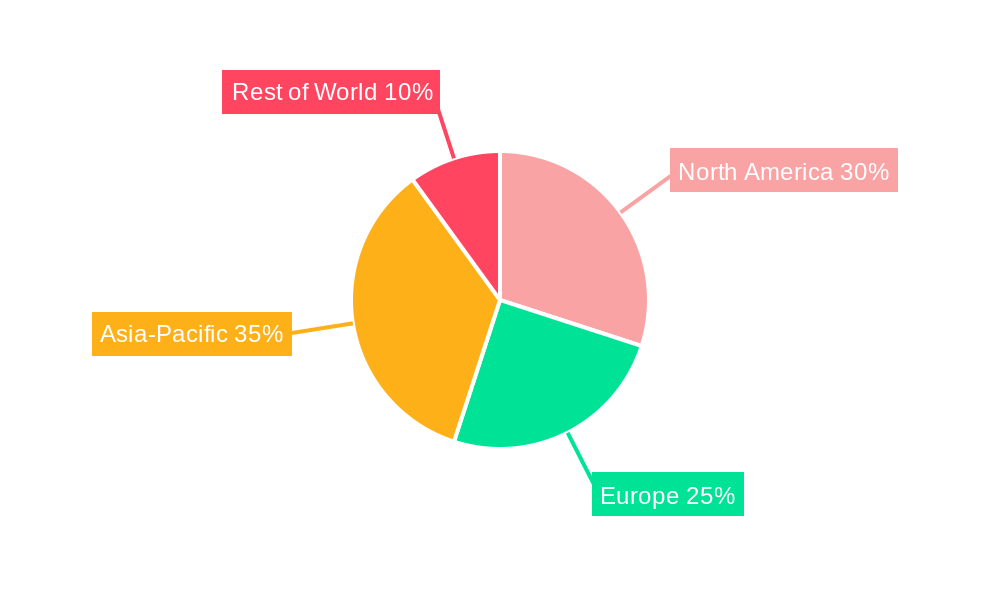
Segmentation analysis reveals strong performance across diverse geographical regions, with North America and Europe dominating the market currently due to established industrial bases and high consumption rates. Asia-Pacific is poised for significant growth, driven by rapid industrialization and urbanization in developing economies within this region. Leading players like Signode, Samuel Strapping, and Baosteel are leveraging their established manufacturing capabilities and distribution networks to solidify their market presence. The competitive landscape is characterized by both large multinational corporations and smaller, regional players focused on niche applications or geographic markets. Strategic alliances, technological innovations, and mergers and acquisitions are expected to further shape the market dynamics in the coming years. The focus on sustainability and the development of eco-friendly steel strap production methods will be crucial for future market expansion.
Steel Straps Company Market Share
Steel Straps Market Report: 2019-2033 - A Comprehensive Analysis
This comprehensive report provides a detailed analysis of the global steel straps market from 2019 to 2033, offering invaluable insights for industry stakeholders, investors, and businesses involved in the manufacturing, distribution, and application of steel strapping solutions. The report covers market size, segmentation, growth drivers, challenges, and future opportunities, incorporating data from the historical period (2019-2024), the base year (2025), and the forecast period (2025-2033). The report leverages millions of data points to provide a robust and reliable analysis.
Steel Straps Market Concentration & Innovation
This section analyzes the competitive landscape of the steel straps market, examining market concentration, innovation drivers, regulatory frameworks, product substitutes, end-user trends, and mergers & acquisitions (M&A) activities. The market is moderately concentrated, with the top 5 players holding approximately xx% market share in 2025. Signode, Samuel Strapping, and Baosteel are key players, exhibiting strong market presence. Innovation is driven by advancements in material science, automation in production processes, and the development of eco-friendly, recyclable alternatives. Regulatory frameworks regarding material safety and environmental compliance significantly impact market dynamics. The substitution of steel straps with other fastening materials, like plastic straps, presents a competitive challenge. However, steel straps continue to dominate due to their superior strength and cost-effectiveness in numerous applications. M&A activity in the sector has been moderate, with deal values totaling approximately $xx million in the past five years. This activity reflects consolidation among industry players and a pursuit of broader market reach.
- Market Share: Top 5 players - xx% (2025 Estimate)
- M&A Deal Value (2019-2024): Approximately $xx million
- Key Innovation Drivers: Advancements in material science, automation, eco-friendly alternatives.
- Major Regulatory Frameworks: (List relevant regulations, e.g., related to material safety and environmental compliance)
Steel Straps Industry Trends & Insights
The global steel straps market is experiencing steady growth, driven by the increasing demand from various end-use industries like packaging, construction, and transportation. The market is projected to reach $xx million by 2033, registering a Compound Annual Growth Rate (CAGR) of xx% during the forecast period. Technological advancements, such as automated strapping systems and improved material quality, are boosting efficiency and expanding applications. Consumer preference for sustainable and eco-friendly packaging is also shaping the market. However, fluctuating raw material prices and intense competition among manufacturers are key challenges. Market penetration in emerging economies remains significant as infrastructural projects and industrialization continue. This is further supported by the increasing adoption of advanced packaging solutions.
- Projected Market Size (2033): $xx million
- CAGR (2025-2033): xx%
- Key Growth Drivers: Increased demand from end-use sectors, technological advancements, eco-friendly trends.
- Major Challenges: Raw material price fluctuations, intense competition.
Dominant Markets & Segments in Steel Straps
The Asia-Pacific region currently dominates the global steel straps market, driven by rapid industrialization, particularly in countries like China and India. North America and Europe represent significant, albeit less rapidly growing, markets. Within segments, the packaging industry accounts for the largest share of steel strap consumption, largely due to its extensive application in securing and protecting goods during transportation and storage.
- Dominant Region: Asia-Pacific
- Key Drivers for Asia-Pacific Dominance: Rapid industrialization, expanding infrastructure development, booming e-commerce.
- Dominant Segment: Packaging
- Key Drivers for Packaging Segment Dominance: Robust demand from logistics, manufacturing, and retail sectors.
Steel Straps Product Developments
Recent innovations in steel straps include the development of high-tensile strength materials, improved coatings for corrosion resistance, and specialized designs for specific applications. These advancements enhance product durability, improve efficiency, and cater to the diverse needs of various industries. The trend is toward lighter-weight, yet equally strong straps, minimizing material waste and enhancing sustainability. These developments offer competitive advantages, allowing manufacturers to capture niche markets and attract environmentally conscious customers.
Report Scope & Segmentation Analysis
This report segments the steel straps market by material type (e.g., carbon steel, stainless steel), by width, by thickness, by application (packaging, construction, automotive, etc.), by end-use industry (food and beverage, manufacturing, logistics), and by region (North America, Europe, Asia-Pacific, etc.). Each segment’s growth projections, market size estimates, and competitive dynamics are detailed within the report. Detailed projections regarding market size and growth rate are provided for each segment through 2033.
Key Drivers of Steel Straps Growth
The growth of the steel straps market is propelled by several key factors, including the rising demand from various end-use sectors like packaging and construction, technological advancements leading to increased efficiency and product performance, and favorable government policies promoting industrial growth in developing economies. Furthermore, the increased focus on supply chain optimization and efficient logistics is driving demand for steel straps as a secure and reliable packaging solution.
Challenges in the Steel Straps Sector
The steel straps industry faces challenges such as fluctuations in raw material prices, which directly impact production costs and profitability. Intense competition among numerous manufacturers also puts pressure on pricing strategies. Environmental concerns related to steel production and disposal necessitate the development of more sustainable alternatives and recycling programs, posing both a cost and a logistical challenge.
Emerging Opportunities in Steel Straps
Emerging opportunities exist in developing sustainable and eco-friendly steel strap alternatives, focusing on recycling and reducing environmental impact. Expansion into emerging markets with growing industrial sectors and increasing demand for packaging solutions also presents significant potential. The integration of smart technologies, like sensors embedded in the straps for monitoring product condition during transit, is a promising area for innovation and market expansion.
Leading Players in the Steel Straps Market
- Signode
- Samuel Strapping
- Baosteel
- Anshan Falan
- M.J.Maillis Group
- Yongxin
- Specta
- Bhushan Steel
- Tianjin Hongmei
- Wiscom
- Kohan Kogyo Co., Ltd
- Midfield Industries
- Yodogawa Steel Works
- Polychem
- Walzen Strips (P) Ltd
- Ensho Steel Strapping
- Titan Umreifungstechnik
- Linder
- Cyklop
Key Developments in Steel Straps Industry
- 2022 Q3: Signode launched a new automated strapping system.
- 2021 Q4: Samuel Strapping acquired a smaller competitor, expanding its market share.
- 2020 Q1: Baosteel invested heavily in R&D for sustainable steel strap production.
- 2019 Q2: New environmental regulations were introduced impacting material usage and recycling practices. (Further details would be included in the full report)
Strategic Outlook for Steel Straps Market
The future of the steel straps market looks promising, driven by sustained growth across various end-use industries, particularly in developing economies. Innovation focused on sustainability, automation, and improved performance will play a crucial role in shaping the competitive landscape. Companies that successfully adapt to evolving regulatory frameworks and consumer preferences, while investing in research and development, are poised for significant growth in this dynamic market.
Steel Straps Segmentation
-
1. Application
- 1.1. Metal Industry
- 1.2. Glass Industry
- 1.3. Building Industry
- 1.4. Others
-
2. Type
- 2.1. Blue-Tempered Strapping
- 2.2. Paint-Coated Strapping
- 2.3. Galvanized Strapping
- 2.4. Others
Steel Straps Segmentation By Geography
-
1. North America
- 1.1. United States
- 1.2. Canada
- 1.3. Mexico
-
2. South America
- 2.1. Brazil
- 2.2. Argentina
- 2.3. Rest of South America
-
3. Europe
- 3.1. United Kingdom
- 3.2. Germany
- 3.3. France
- 3.4. Italy
- 3.5. Spain
- 3.6. Russia
- 3.7. Benelux
- 3.8. Nordics
- 3.9. Rest of Europe
-
4. Middle East & Africa
- 4.1. Turkey
- 4.2. Israel
- 4.3. GCC
- 4.4. North Africa
- 4.5. South Africa
- 4.6. Rest of Middle East & Africa
-
5. Asia Pacific
- 5.1. China
- 5.2. India
- 5.3. Japan
- 5.4. South Korea
- 5.5. ASEAN
- 5.6. Oceania
- 5.7. Rest of Asia Pacific
Steel Straps Regional Market Share
Geographic Coverage of Steel Straps
Steel Straps REPORT HIGHLIGHTS
| Aspects | Details |
|---|---|
| Study Period | 2020-2034 |
| Base Year | 2025 |
| Estimated Year | 2026 |
| Forecast Period | 2026-2034 |
| Historical Period | 2020-2025 |
| Growth Rate | CAGR of 4% from 2020-2034 |
| Segmentation |
|
Table of Contents
- 1. Introduction
- 1.1. Research Scope
- 1.2. Market Segmentation
- 1.3. Research Objective
- 1.4. Definitions and Assumptions
- 2. Executive Summary
- 2.1. Market Snapshot
- 3. Market Dynamics
- 3.1. Market Drivers
- 3.2. Market Restrains
- 3.3. Market Trends
- 3.4. Market Opportunities
- 4. Market Factor Analysis
- 4.1. Porters Five Forces
- 4.1.1. Bargaining Power of Suppliers
- 4.1.2. Bargaining Power of Buyers
- 4.1.3. Threat of New Entrants
- 4.1.4. Threat of Substitutes
- 4.1.5. Competitive Rivalry
- 4.2. PESTEL analysis
- 4.3. BCG Analysis
- 4.3.1. Stars (High Growth, High Market Share)
- 4.3.2. Cash Cows (Low Growth, High Market Share)
- 4.3.3. Question Mark (High Growth, Low Market Share)
- 4.3.4. Dogs (Low Growth, Low Market Share)
- 4.4. Ansoff Matrix Analysis
- 4.5. Supply Chain Analysis
- 4.6. Regulatory Landscape
- 4.7. Current Market Potential and Opportunity Assessment (TAM–SAM–SOM Framework)
- 4.8. RAX Analyst Note
- 4.1. Porters Five Forces
- 5. Market Analysis, Insights and Forecast 2021-2033
- 5.1. Market Analysis, Insights and Forecast - by Application
- 5.1.1. Metal Industry
- 5.1.2. Glass Industry
- 5.1.3. Building Industry
- 5.1.4. Others
- 5.2. Market Analysis, Insights and Forecast - by Type
- 5.2.1. Blue-Tempered Strapping
- 5.2.2. Paint-Coated Strapping
- 5.2.3. Galvanized Strapping
- 5.2.4. Others
- 5.3. Market Analysis, Insights and Forecast - by Region
- 5.3.1. North America
- 5.3.2. South America
- 5.3.3. Europe
- 5.3.4. Middle East & Africa
- 5.3.5. Asia Pacific
- 5.1. Market Analysis, Insights and Forecast - by Application
- 6. Global Steel Straps Analysis, Insights and Forecast, 2021-2033
- 6.1. Market Analysis, Insights and Forecast - by Application
- 6.1.1. Metal Industry
- 6.1.2. Glass Industry
- 6.1.3. Building Industry
- 6.1.4. Others
- 6.2. Market Analysis, Insights and Forecast - by Type
- 6.2.1. Blue-Tempered Strapping
- 6.2.2. Paint-Coated Strapping
- 6.2.3. Galvanized Strapping
- 6.2.4. Others
- 6.1. Market Analysis, Insights and Forecast - by Application
- 7. North America Steel Straps Analysis, Insights and Forecast, 2020-2032
- 7.1. Market Analysis, Insights and Forecast - by Application
- 7.1.1. Metal Industry
- 7.1.2. Glass Industry
- 7.1.3. Building Industry
- 7.1.4. Others
- 7.2. Market Analysis, Insights and Forecast - by Type
- 7.2.1. Blue-Tempered Strapping
- 7.2.2. Paint-Coated Strapping
- 7.2.3. Galvanized Strapping
- 7.2.4. Others
- 7.1. Market Analysis, Insights and Forecast - by Application
- 8. South America Steel Straps Analysis, Insights and Forecast, 2020-2032
- 8.1. Market Analysis, Insights and Forecast - by Application
- 8.1.1. Metal Industry
- 8.1.2. Glass Industry
- 8.1.3. Building Industry
- 8.1.4. Others
- 8.2. Market Analysis, Insights and Forecast - by Type
- 8.2.1. Blue-Tempered Strapping
- 8.2.2. Paint-Coated Strapping
- 8.2.3. Galvanized Strapping
- 8.2.4. Others
- 8.1. Market Analysis, Insights and Forecast - by Application
- 9. Europe Steel Straps Analysis, Insights and Forecast, 2020-2032
- 9.1. Market Analysis, Insights and Forecast - by Application
- 9.1.1. Metal Industry
- 9.1.2. Glass Industry
- 9.1.3. Building Industry
- 9.1.4. Others
- 9.2. Market Analysis, Insights and Forecast - by Type
- 9.2.1. Blue-Tempered Strapping
- 9.2.2. Paint-Coated Strapping
- 9.2.3. Galvanized Strapping
- 9.2.4. Others
- 9.1. Market Analysis, Insights and Forecast - by Application
- 10. Middle East & Africa Steel Straps Analysis, Insights and Forecast, 2020-2032
- 10.1. Market Analysis, Insights and Forecast - by Application
- 10.1.1. Metal Industry
- 10.1.2. Glass Industry
- 10.1.3. Building Industry
- 10.1.4. Others
- 10.2. Market Analysis, Insights and Forecast - by Type
- 10.2.1. Blue-Tempered Strapping
- 10.2.2. Paint-Coated Strapping
- 10.2.3. Galvanized Strapping
- 10.2.4. Others
- 10.1. Market Analysis, Insights and Forecast - by Application
- 11. Asia Pacific Steel Straps Analysis, Insights and Forecast, 2020-2032
- 11.1. Market Analysis, Insights and Forecast - by Application
- 11.1.1. Metal Industry
- 11.1.2. Glass Industry
- 11.1.3. Building Industry
- 11.1.4. Others
- 11.2. Market Analysis, Insights and Forecast - by Type
- 11.2.1. Blue-Tempered Strapping
- 11.2.2. Paint-Coated Strapping
- 11.2.3. Galvanized Strapping
- 11.2.4. Others
- 11.1. Market Analysis, Insights and Forecast - by Application
- 12. Competitive Analysis
- 12.1. Company Profiles
- 12.1.1 Signode
- 12.1.1.1. Company Overview
- 12.1.1.2. Products
- 12.1.1.3. Company Financials
- 12.1.1.4. SWOT Analysis
- 12.1.2 Samuel Strapping
- 12.1.2.1. Company Overview
- 12.1.2.2. Products
- 12.1.2.3. Company Financials
- 12.1.2.4. SWOT Analysis
- 12.1.3 Baosteel
- 12.1.3.1. Company Overview
- 12.1.3.2. Products
- 12.1.3.3. Company Financials
- 12.1.3.4. SWOT Analysis
- 12.1.4 Anshan Falan
- 12.1.4.1. Company Overview
- 12.1.4.2. Products
- 12.1.4.3. Company Financials
- 12.1.4.4. SWOT Analysis
- 12.1.5 M.J.Maillis Group
- 12.1.5.1. Company Overview
- 12.1.5.2. Products
- 12.1.5.3. Company Financials
- 12.1.5.4. SWOT Analysis
- 12.1.6 Yongxin
- 12.1.6.1. Company Overview
- 12.1.6.2. Products
- 12.1.6.3. Company Financials
- 12.1.6.4. SWOT Analysis
- 12.1.7 Specta
- 12.1.7.1. Company Overview
- 12.1.7.2. Products
- 12.1.7.3. Company Financials
- 12.1.7.4. SWOT Analysis
- 12.1.8 Bhushan Steel
- 12.1.8.1. Company Overview
- 12.1.8.2. Products
- 12.1.8.3. Company Financials
- 12.1.8.4. SWOT Analysis
- 12.1.9 Tianjin Hongmei
- 12.1.9.1. Company Overview
- 12.1.9.2. Products
- 12.1.9.3. Company Financials
- 12.1.9.4. SWOT Analysis
- 12.1.10 Wiscom
- 12.1.10.1. Company Overview
- 12.1.10.2. Products
- 12.1.10.3. Company Financials
- 12.1.10.4. SWOT Analysis
- 12.1.11 Kohan Kogyo Co. Ltd
- 12.1.11.1. Company Overview
- 12.1.11.2. Products
- 12.1.11.3. Company Financials
- 12.1.11.4. SWOT Analysis
- 12.1.12 Midfield Industries
- 12.1.12.1. Company Overview
- 12.1.12.2. Products
- 12.1.12.3. Company Financials
- 12.1.12.4. SWOT Analysis
- 12.1.13 Yodogawa Steel Works
- 12.1.13.1. Company Overview
- 12.1.13.2. Products
- 12.1.13.3. Company Financials
- 12.1.13.4. SWOT Analysis
- 12.1.14 Polychem
- 12.1.14.1. Company Overview
- 12.1.14.2. Products
- 12.1.14.3. Company Financials
- 12.1.14.4. SWOT Analysis
- 12.1.15 Walzen Strips (P) Ltd
- 12.1.15.1. Company Overview
- 12.1.15.2. Products
- 12.1.15.3. Company Financials
- 12.1.15.4. SWOT Analysis
- 12.1.16 Ensho Steel Strapping
- 12.1.16.1. Company Overview
- 12.1.16.2. Products
- 12.1.16.3. Company Financials
- 12.1.16.4. SWOT Analysis
- 12.1.17 Titan Umreifungstechnik
- 12.1.17.1. Company Overview
- 12.1.17.2. Products
- 12.1.17.3. Company Financials
- 12.1.17.4. SWOT Analysis
- 12.1.18 Linder
- 12.1.18.1. Company Overview
- 12.1.18.2. Products
- 12.1.18.3. Company Financials
- 12.1.18.4. SWOT Analysis
- 12.1.19 Cyklop
- 12.1.19.1. Company Overview
- 12.1.19.2. Products
- 12.1.19.3. Company Financials
- 12.1.19.4. SWOT Analysis
- 12.1.1 Signode
- 12.2. Market Entropy
- 12.2.1 Company's Key Areas Served
- 12.2.2 Recent Developments
- 12.3. Company Market Share Analysis 2025
- 12.3.1 Top 5 Companies Market Share Analysis
- 12.3.2 Top 3 Companies Market Share Analysis
- 12.4. List of Potential Customers
- 13. Research Methodology
List of Figures
- Figure 1: Global Steel Straps Revenue Breakdown (undefined, %) by Region 2025 & 2033
- Figure 2: Global Steel Straps Volume Breakdown (K, %) by Region 2025 & 2033
- Figure 3: North America Steel Straps Revenue (undefined), by Application 2025 & 2033
- Figure 4: North America Steel Straps Volume (K), by Application 2025 & 2033
- Figure 5: North America Steel Straps Revenue Share (%), by Application 2025 & 2033
- Figure 6: North America Steel Straps Volume Share (%), by Application 2025 & 2033
- Figure 7: North America Steel Straps Revenue (undefined), by Type 2025 & 2033
- Figure 8: North America Steel Straps Volume (K), by Type 2025 & 2033
- Figure 9: North America Steel Straps Revenue Share (%), by Type 2025 & 2033
- Figure 10: North America Steel Straps Volume Share (%), by Type 2025 & 2033
- Figure 11: North America Steel Straps Revenue (undefined), by Country 2025 & 2033
- Figure 12: North America Steel Straps Volume (K), by Country 2025 & 2033
- Figure 13: North America Steel Straps Revenue Share (%), by Country 2025 & 2033
- Figure 14: North America Steel Straps Volume Share (%), by Country 2025 & 2033
- Figure 15: South America Steel Straps Revenue (undefined), by Application 2025 & 2033
- Figure 16: South America Steel Straps Volume (K), by Application 2025 & 2033
- Figure 17: South America Steel Straps Revenue Share (%), by Application 2025 & 2033
- Figure 18: South America Steel Straps Volume Share (%), by Application 2025 & 2033
- Figure 19: South America Steel Straps Revenue (undefined), by Type 2025 & 2033
- Figure 20: South America Steel Straps Volume (K), by Type 2025 & 2033
- Figure 21: South America Steel Straps Revenue Share (%), by Type 2025 & 2033
- Figure 22: South America Steel Straps Volume Share (%), by Type 2025 & 2033
- Figure 23: South America Steel Straps Revenue (undefined), by Country 2025 & 2033
- Figure 24: South America Steel Straps Volume (K), by Country 2025 & 2033
- Figure 25: South America Steel Straps Revenue Share (%), by Country 2025 & 2033
- Figure 26: South America Steel Straps Volume Share (%), by Country 2025 & 2033
- Figure 27: Europe Steel Straps Revenue (undefined), by Application 2025 & 2033
- Figure 28: Europe Steel Straps Volume (K), by Application 2025 & 2033
- Figure 29: Europe Steel Straps Revenue Share (%), by Application 2025 & 2033
- Figure 30: Europe Steel Straps Volume Share (%), by Application 2025 & 2033
- Figure 31: Europe Steel Straps Revenue (undefined), by Type 2025 & 2033
- Figure 32: Europe Steel Straps Volume (K), by Type 2025 & 2033
- Figure 33: Europe Steel Straps Revenue Share (%), by Type 2025 & 2033
- Figure 34: Europe Steel Straps Volume Share (%), by Type 2025 & 2033
- Figure 35: Europe Steel Straps Revenue (undefined), by Country 2025 & 2033
- Figure 36: Europe Steel Straps Volume (K), by Country 2025 & 2033
- Figure 37: Europe Steel Straps Revenue Share (%), by Country 2025 & 2033
- Figure 38: Europe Steel Straps Volume Share (%), by Country 2025 & 2033
- Figure 39: Middle East & Africa Steel Straps Revenue (undefined), by Application 2025 & 2033
- Figure 40: Middle East & Africa Steel Straps Volume (K), by Application 2025 & 2033
- Figure 41: Middle East & Africa Steel Straps Revenue Share (%), by Application 2025 & 2033
- Figure 42: Middle East & Africa Steel Straps Volume Share (%), by Application 2025 & 2033
- Figure 43: Middle East & Africa Steel Straps Revenue (undefined), by Type 2025 & 2033
- Figure 44: Middle East & Africa Steel Straps Volume (K), by Type 2025 & 2033
- Figure 45: Middle East & Africa Steel Straps Revenue Share (%), by Type 2025 & 2033
- Figure 46: Middle East & Africa Steel Straps Volume Share (%), by Type 2025 & 2033
- Figure 47: Middle East & Africa Steel Straps Revenue (undefined), by Country 2025 & 2033
- Figure 48: Middle East & Africa Steel Straps Volume (K), by Country 2025 & 2033
- Figure 49: Middle East & Africa Steel Straps Revenue Share (%), by Country 2025 & 2033
- Figure 50: Middle East & Africa Steel Straps Volume Share (%), by Country 2025 & 2033
- Figure 51: Asia Pacific Steel Straps Revenue (undefined), by Application 2025 & 2033
- Figure 52: Asia Pacific Steel Straps Volume (K), by Application 2025 & 2033
- Figure 53: Asia Pacific Steel Straps Revenue Share (%), by Application 2025 & 2033
- Figure 54: Asia Pacific Steel Straps Volume Share (%), by Application 2025 & 2033
- Figure 55: Asia Pacific Steel Straps Revenue (undefined), by Type 2025 & 2033
- Figure 56: Asia Pacific Steel Straps Volume (K), by Type 2025 & 2033
- Figure 57: Asia Pacific Steel Straps Revenue Share (%), by Type 2025 & 2033
- Figure 58: Asia Pacific Steel Straps Volume Share (%), by Type 2025 & 2033
- Figure 59: Asia Pacific Steel Straps Revenue (undefined), by Country 2025 & 2033
- Figure 60: Asia Pacific Steel Straps Volume (K), by Country 2025 & 2033
- Figure 61: Asia Pacific Steel Straps Revenue Share (%), by Country 2025 & 2033
- Figure 62: Asia Pacific Steel Straps Volume Share (%), by Country 2025 & 2033
List of Tables
- Table 1: Global Steel Straps Revenue undefined Forecast, by Application 2020 & 2033
- Table 2: Global Steel Straps Volume K Forecast, by Application 2020 & 2033
- Table 3: Global Steel Straps Revenue undefined Forecast, by Type 2020 & 2033
- Table 4: Global Steel Straps Volume K Forecast, by Type 2020 & 2033
- Table 5: Global Steel Straps Revenue undefined Forecast, by Region 2020 & 2033
- Table 6: Global Steel Straps Volume K Forecast, by Region 2020 & 2033
- Table 7: Global Steel Straps Revenue undefined Forecast, by Application 2020 & 2033
- Table 8: Global Steel Straps Volume K Forecast, by Application 2020 & 2033
- Table 9: Global Steel Straps Revenue undefined Forecast, by Type 2020 & 2033
- Table 10: Global Steel Straps Volume K Forecast, by Type 2020 & 2033
- Table 11: Global Steel Straps Revenue undefined Forecast, by Country 2020 & 2033
- Table 12: Global Steel Straps Volume K Forecast, by Country 2020 & 2033
- Table 13: United States Steel Straps Revenue (undefined) Forecast, by Application 2020 & 2033
- Table 14: United States Steel Straps Volume (K) Forecast, by Application 2020 & 2033
- Table 15: Canada Steel Straps Revenue (undefined) Forecast, by Application 2020 & 2033
- Table 16: Canada Steel Straps Volume (K) Forecast, by Application 2020 & 2033
- Table 17: Mexico Steel Straps Revenue (undefined) Forecast, by Application 2020 & 2033
- Table 18: Mexico Steel Straps Volume (K) Forecast, by Application 2020 & 2033
- Table 19: Global Steel Straps Revenue undefined Forecast, by Application 2020 & 2033
- Table 20: Global Steel Straps Volume K Forecast, by Application 2020 & 2033
- Table 21: Global Steel Straps Revenue undefined Forecast, by Type 2020 & 2033
- Table 22: Global Steel Straps Volume K Forecast, by Type 2020 & 2033
- Table 23: Global Steel Straps Revenue undefined Forecast, by Country 2020 & 2033
- Table 24: Global Steel Straps Volume K Forecast, by Country 2020 & 2033
- Table 25: Brazil Steel Straps Revenue (undefined) Forecast, by Application 2020 & 2033
- Table 26: Brazil Steel Straps Volume (K) Forecast, by Application 2020 & 2033
- Table 27: Argentina Steel Straps Revenue (undefined) Forecast, by Application 2020 & 2033
- Table 28: Argentina Steel Straps Volume (K) Forecast, by Application 2020 & 2033
- Table 29: Rest of South America Steel Straps Revenue (undefined) Forecast, by Application 2020 & 2033
- Table 30: Rest of South America Steel Straps Volume (K) Forecast, by Application 2020 & 2033
- Table 31: Global Steel Straps Revenue undefined Forecast, by Application 2020 & 2033
- Table 32: Global Steel Straps Volume K Forecast, by Application 2020 & 2033
- Table 33: Global Steel Straps Revenue undefined Forecast, by Type 2020 & 2033
- Table 34: Global Steel Straps Volume K Forecast, by Type 2020 & 2033
- Table 35: Global Steel Straps Revenue undefined Forecast, by Country 2020 & 2033
- Table 36: Global Steel Straps Volume K Forecast, by Country 2020 & 2033
- Table 37: United Kingdom Steel Straps Revenue (undefined) Forecast, by Application 2020 & 2033
- Table 38: United Kingdom Steel Straps Volume (K) Forecast, by Application 2020 & 2033
- Table 39: Germany Steel Straps Revenue (undefined) Forecast, by Application 2020 & 2033
- Table 40: Germany Steel Straps Volume (K) Forecast, by Application 2020 & 2033
- Table 41: France Steel Straps Revenue (undefined) Forecast, by Application 2020 & 2033
- Table 42: France Steel Straps Volume (K) Forecast, by Application 2020 & 2033
- Table 43: Italy Steel Straps Revenue (undefined) Forecast, by Application 2020 & 2033
- Table 44: Italy Steel Straps Volume (K) Forecast, by Application 2020 & 2033
- Table 45: Spain Steel Straps Revenue (undefined) Forecast, by Application 2020 & 2033
- Table 46: Spain Steel Straps Volume (K) Forecast, by Application 2020 & 2033
- Table 47: Russia Steel Straps Revenue (undefined) Forecast, by Application 2020 & 2033
- Table 48: Russia Steel Straps Volume (K) Forecast, by Application 2020 & 2033
- Table 49: Benelux Steel Straps Revenue (undefined) Forecast, by Application 2020 & 2033
- Table 50: Benelux Steel Straps Volume (K) Forecast, by Application 2020 & 2033
- Table 51: Nordics Steel Straps Revenue (undefined) Forecast, by Application 2020 & 2033
- Table 52: Nordics Steel Straps Volume (K) Forecast, by Application 2020 & 2033
- Table 53: Rest of Europe Steel Straps Revenue (undefined) Forecast, by Application 2020 & 2033
- Table 54: Rest of Europe Steel Straps Volume (K) Forecast, by Application 2020 & 2033
- Table 55: Global Steel Straps Revenue undefined Forecast, by Application 2020 & 2033
- Table 56: Global Steel Straps Volume K Forecast, by Application 2020 & 2033
- Table 57: Global Steel Straps Revenue undefined Forecast, by Type 2020 & 2033
- Table 58: Global Steel Straps Volume K Forecast, by Type 2020 & 2033
- Table 59: Global Steel Straps Revenue undefined Forecast, by Country 2020 & 2033
- Table 60: Global Steel Straps Volume K Forecast, by Country 2020 & 2033
- Table 61: Turkey Steel Straps Revenue (undefined) Forecast, by Application 2020 & 2033
- Table 62: Turkey Steel Straps Volume (K) Forecast, by Application 2020 & 2033
- Table 63: Israel Steel Straps Revenue (undefined) Forecast, by Application 2020 & 2033
- Table 64: Israel Steel Straps Volume (K) Forecast, by Application 2020 & 2033
- Table 65: GCC Steel Straps Revenue (undefined) Forecast, by Application 2020 & 2033
- Table 66: GCC Steel Straps Volume (K) Forecast, by Application 2020 & 2033
- Table 67: North Africa Steel Straps Revenue (undefined) Forecast, by Application 2020 & 2033
- Table 68: North Africa Steel Straps Volume (K) Forecast, by Application 2020 & 2033
- Table 69: South Africa Steel Straps Revenue (undefined) Forecast, by Application 2020 & 2033
- Table 70: South Africa Steel Straps Volume (K) Forecast, by Application 2020 & 2033
- Table 71: Rest of Middle East & Africa Steel Straps Revenue (undefined) Forecast, by Application 2020 & 2033
- Table 72: Rest of Middle East & Africa Steel Straps Volume (K) Forecast, by Application 2020 & 2033
- Table 73: Global Steel Straps Revenue undefined Forecast, by Application 2020 & 2033
- Table 74: Global Steel Straps Volume K Forecast, by Application 2020 & 2033
- Table 75: Global Steel Straps Revenue undefined Forecast, by Type 2020 & 2033
- Table 76: Global Steel Straps Volume K Forecast, by Type 2020 & 2033
- Table 77: Global Steel Straps Revenue undefined Forecast, by Country 2020 & 2033
- Table 78: Global Steel Straps Volume K Forecast, by Country 2020 & 2033
- Table 79: China Steel Straps Revenue (undefined) Forecast, by Application 2020 & 2033
- Table 80: China Steel Straps Volume (K) Forecast, by Application 2020 & 2033
- Table 81: India Steel Straps Revenue (undefined) Forecast, by Application 2020 & 2033
- Table 82: India Steel Straps Volume (K) Forecast, by Application 2020 & 2033
- Table 83: Japan Steel Straps Revenue (undefined) Forecast, by Application 2020 & 2033
- Table 84: Japan Steel Straps Volume (K) Forecast, by Application 2020 & 2033
- Table 85: South Korea Steel Straps Revenue (undefined) Forecast, by Application 2020 & 2033
- Table 86: South Korea Steel Straps Volume (K) Forecast, by Application 2020 & 2033
- Table 87: ASEAN Steel Straps Revenue (undefined) Forecast, by Application 2020 & 2033
- Table 88: ASEAN Steel Straps Volume (K) Forecast, by Application 2020 & 2033
- Table 89: Oceania Steel Straps Revenue (undefined) Forecast, by Application 2020 & 2033
- Table 90: Oceania Steel Straps Volume (K) Forecast, by Application 2020 & 2033
- Table 91: Rest of Asia Pacific Steel Straps Revenue (undefined) Forecast, by Application 2020 & 2033
- Table 92: Rest of Asia Pacific Steel Straps Volume (K) Forecast, by Application 2020 & 2033
Frequently Asked Questions
1. What is the projected Compound Annual Growth Rate (CAGR) of the Steel Straps?
The projected CAGR is approximately 4%.
2. Which companies are prominent players in the Steel Straps?
Key companies in the market include Signode, Samuel Strapping, Baosteel, Anshan Falan, M.J.Maillis Group, Yongxin, Specta, Bhushan Steel, Tianjin Hongmei, Wiscom, Kohan Kogyo Co., Ltd, Midfield Industries, Yodogawa Steel Works, Polychem, Walzen Strips (P) Ltd, Ensho Steel Strapping, Titan Umreifungstechnik, Linder, Cyklop.
3. What are the main segments of the Steel Straps?
The market segments include Application, Type.
4. Can you provide details about the market size?
The market size is estimated to be USD XXX N/A as of 2022.
5. What are some drivers contributing to market growth?
N/A
6. What are the notable trends driving market growth?
N/A
7. Are there any restraints impacting market growth?
N/A
8. Can you provide examples of recent developments in the market?
N/A
9. What pricing options are available for accessing the report?
Pricing options include single-user, multi-user, and enterprise licenses priced at USD 3950.00, USD 5925.00, and USD 7900.00 respectively.
10. Is the market size provided in terms of value or volume?
The market size is provided in terms of value, measured in N/A and volume, measured in K.
11. Are there any specific market keywords associated with the report?
Yes, the market keyword associated with the report is "Steel Straps," which aids in identifying and referencing the specific market segment covered.
12. How do I determine which pricing option suits my needs best?
The pricing options vary based on user requirements and access needs. Individual users may opt for single-user licenses, while businesses requiring broader access may choose multi-user or enterprise licenses for cost-effective access to the report.
13. Are there any additional resources or data provided in the Steel Straps report?
While the report offers comprehensive insights, it's advisable to review the specific contents or supplementary materials provided to ascertain if additional resources or data are available.
14. How can I stay updated on further developments or reports in the Steel Straps?
To stay informed about further developments, trends, and reports in the Steel Straps, consider subscribing to industry newsletters, following relevant companies and organizations, or regularly checking reputable industry news sources and publications.
Methodology
Step 1 - Identification of Relevant Samples Size from Population Database


Step 2 - Approaches for Defining Global Market Size (Value, Volume* & Price*)

Note*: In applicable scenarios
Step 3 - Data Sources
Primary Research
- Web Analytics
- Survey Reports
- Research Institute
- Latest Research Reports
- Opinion Leaders
Secondary Research
- Annual Reports
- White Paper
- Latest Press Release
- Industry Association
- Paid Database
- Investor Presentations

Step 4 - Data Triangulation
Involves using different sources of information in order to increase the validity of a study
These sources are likely to be stakeholders in a program - participants, other researchers, program staff, other community members, and so on.
Then we put all data in single framework & apply various statistical tools to find out the dynamic on the market.
During the analysis stage, feedback from the stakeholder groups would be compared to determine areas of agreement as well as areas of divergence