
Key Insights
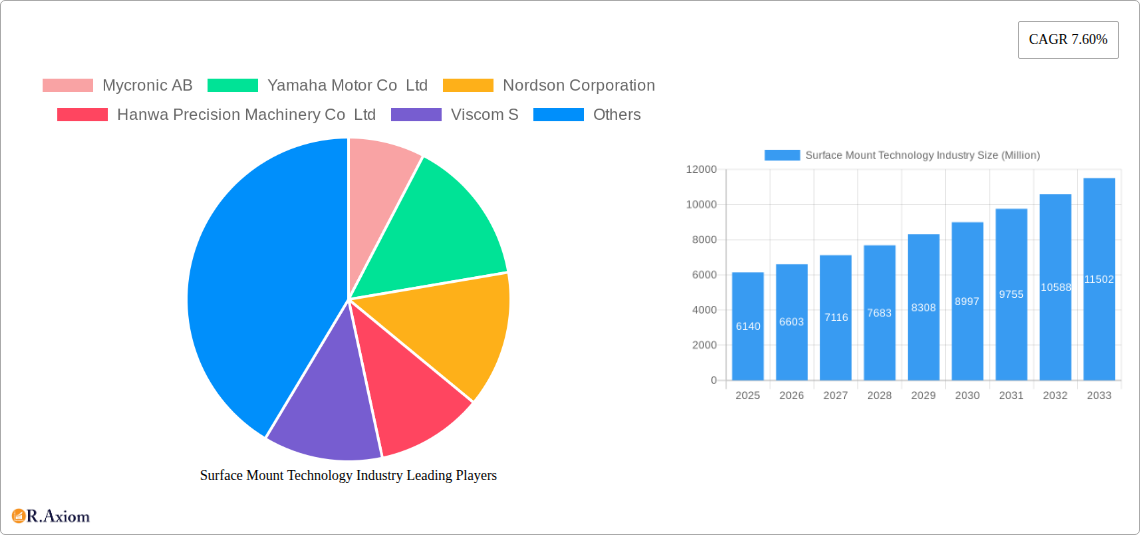
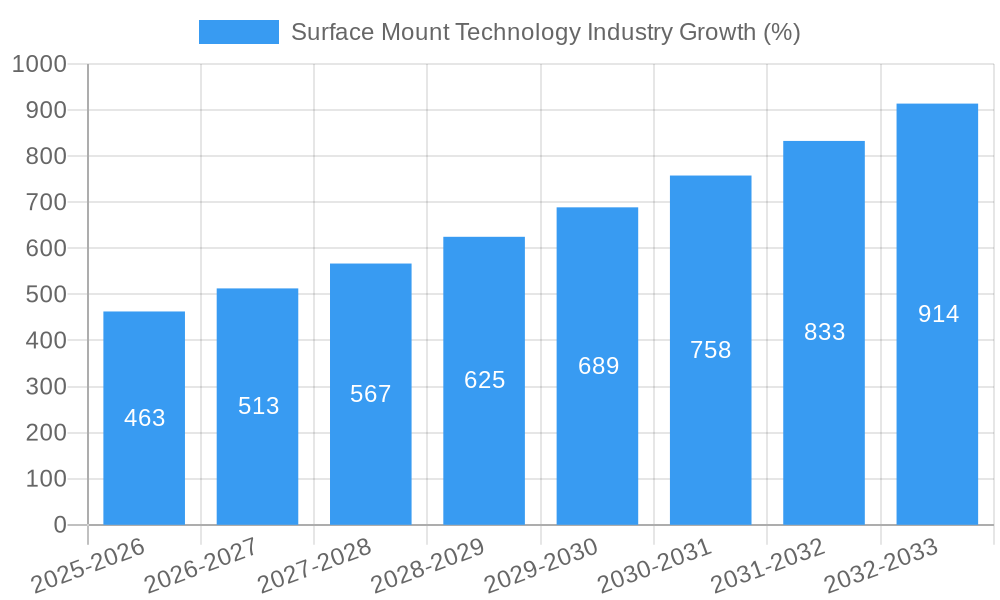
The Surface Mount Technology (SMT) industry, valued at $6.14 billion in 2025, is experiencing robust growth, projected to expand at a Compound Annual Growth Rate (CAGR) of 7.60% from 2025 to 2033. This growth is fueled by several key factors. The increasing demand for miniaturized and high-performance electronic devices in consumer electronics, particularly smartphones and wearables, is a significant driver. The automotive industry's shift towards electric vehicles and advanced driver-assistance systems (ADAS) is also boosting demand for SMT components, given their crucial role in complex electronic control units (ECUs). Furthermore, the expansion of the industrial automation sector and the growing adoption of IoT devices are contributing to the overall market expansion. Technological advancements, such as the development of higher-precision placement machines and advanced materials, are further enhancing efficiency and enabling the production of more sophisticated electronics. While potential supply chain disruptions and fluctuations in raw material prices pose challenges, the overall market outlook remains positive, indicating a substantial growth trajectory in the coming years.
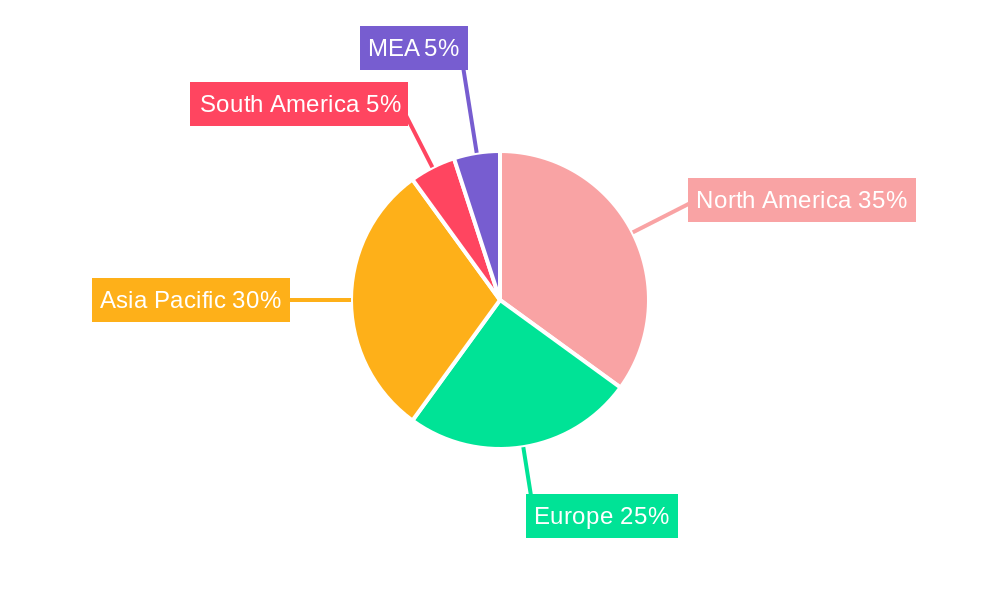
Significant regional variations exist within the SMT market. North America and Asia-Pacific currently hold the largest market shares, driven by strong manufacturing bases and high technological adoption rates. However, emerging economies in regions like Southeast Asia are witnessing rapid growth due to increasing investments in electronics manufacturing and expanding consumer electronics markets. The competitive landscape is characterized by both established players like Mycronic AB, Panasonic Corporation, and Nordson Corporation, and emerging technology providers. The ongoing competition is pushing innovation and driving improvements in SMT component quality, placement accuracy, and overall production efficiency. Continuous research and development efforts focused on improving placement speed, precision, and adaptability to diverse component types are expected to solidify the industry's long-term growth prospects. The market segmentation by component type (passive and active) and end-user industry offers valuable insights for strategic decision-making, identifying potential areas for investment and growth within the SMT ecosystem.
Surface Mount Technology (SMT) Industry Market Report: 2019-2033
This comprehensive report provides an in-depth analysis of the Surface Mount Technology (SMT) industry, covering market size, segmentation, growth drivers, challenges, and key players. The study period spans from 2019 to 2033, with a base year of 2025 and a forecast period of 2025-2033. This report is crucial for industry stakeholders, investors, and strategic decision-makers seeking actionable insights into this dynamic market. The report projects a market value exceeding XX Million by 2033, driven by technological advancements and increasing demand across diverse end-user industries.
Surface Mount Technology Industry Market Concentration & Innovation
The SMT industry exhibits a moderately concentrated market structure, with several major players commanding significant market share. Companies like Mycronic AB, Yamaha Motor Co Ltd, and Nordson Corporation are prominent examples. However, the presence of numerous smaller, specialized firms contributes to a competitive landscape. Innovation is a key driver, with continuous advancements in pick-and-place technology, automated optical inspection (AOI), and material science leading to enhanced efficiency and miniaturization. Regulatory frameworks, particularly concerning environmental compliance and workplace safety, play a significant role. Product substitutes, while limited, exist in niche applications, and understanding end-user trends—particularly in consumer electronics and automotive—is crucial for success.
- Market Share: Mycronic AB holds an estimated xx% market share in 2025, while Yamaha Motor Co Ltd holds approximately xx%.
- M&A Activity: The historical period (2019-2024) witnessed xx Million in M&A deal values, with a predicted increase to xx Million during the forecast period (2025-2033), reflecting consolidation and expansion strategies within the industry.
Surface Mount Technology Industry Industry Trends & Insights
The SMT industry is experiencing robust growth, driven primarily by the escalating demand for electronic devices across various sectors. The Compound Annual Growth Rate (CAGR) is projected to be xx% during the forecast period. Technological disruptions, such as the adoption of AI and machine learning in automated processes, are fundamentally reshaping manufacturing practices. Consumer preferences for smaller, more powerful, and feature-rich electronic products continue to fuel demand. Competitive dynamics are intense, with companies focusing on innovation, cost reduction, and superior customer service to gain a competitive edge. Market penetration in emerging economies is also expected to significantly contribute to overall growth.
Dominant Markets & Segments in Surface Mount Technology Industry
The Asia-Pacific region is currently the dominant market for SMT, driven by a substantial manufacturing base, particularly in China and South Korea. Within the component segment, active components represent a larger market share compared to passive components, reflecting the increasing complexity of electronic devices. The consumer electronics end-user industry remains the largest segment, but significant growth is anticipated in the automotive and industrial electronics sectors due to the increasing integration of electronics in vehicles and industrial automation.
- Key Drivers for Asia-Pacific Dominance:
- Strong economic growth
- Extensive manufacturing infrastructure
- Favorable government policies supporting electronics manufacturing
- Consumer Electronics Segment Dominance:
- High demand for smartphones, laptops, and other consumer electronics
- Increasing production volumes
- Continuous product innovation
Surface Mount Technology Industry Product Developments
Recent product innovations focus on improving precision, speed, and flexibility in SMT processes. Advancements in pick-and-place technology, AOI systems, and reflow ovens are enhancing production efficiency and reducing defects. These developments are critical for manufacturers seeking to meet the demands for higher quality, faster turnaround times, and cost-effective production. Market fit is driven by the ongoing miniaturization of electronic components and the need for higher density circuit boards.
Report Scope & Segmentation Analysis
This report segments the SMT market by component (passive components, including resistors and capacitors; active components, including integrated circuits) and by end-user industry (consumer electronics, automotive, industrial electronics, aerospace and defense, healthcare, and other end-user industries). Each segment's growth projections, market size, and competitive dynamics are analyzed in detail, providing granular insights into market opportunities and challenges. For example, the automotive segment is projected to experience significant growth driven by the increasing demand for advanced driver-assistance systems (ADAS).
Key Drivers of Surface Mount Technology Industry Growth
The growth of the SMT industry is driven by several factors. Technological advancements are a primary catalyst, with continuous innovation in automation, precision, and speed significantly impacting efficiency and production capacity. Strong economic growth in key regions fuels demand for electronic devices. Favorable government policies and investments in infrastructure also contribute to the overall growth trajectory.
Challenges in the Surface Mount Technology Industry Sector
The SMT industry faces challenges including supply chain disruptions, volatile raw material prices, and intense competition. These factors can significantly impact production costs and profitability. Regulatory compliance and environmental concerns add further complexity. Furthermore, the skill gap in the workforce also poses a challenge to industry expansion. These challenges are estimated to have a negative impact of xx% on the market's growth in 2025.
Emerging Opportunities in Surface Mount Technology Industry
Emerging opportunities are found in the growing demand for miniaturized electronics, applications in emerging technologies such as IoT and 5G, and increasing adoption of Industry 4.0 technologies within the SMT manufacturing process. The focus on sustainability and environmentally friendly manufacturing processes also presents new business opportunities. Further, expanding into emerging markets provides growth potential.
Leading Players in the Surface Mount Technology Industry Market
- Mycronic AB
- Yamaha Motor Co Ltd
- Nordson Corporation
- Hanwa Precision Machinery Co Ltd
- Viscom S
- Juki Corporation
- Zhejiang Neoden Technology Co Ltd
- Fuji Corporation
- Europlacer Limited
- ASMPT
- Panasonic Corporation
Key Developments in Surface Mount Technology Industry Industry
- June 2024: Beifu Electronic Technology Co. Ltd. integrates Europlacer's Atom pick-and-place technology, significantly boosting production efficiency and reducing turnaround times.
- April 2024: TVS Electronics expands into the EMS sector, planning to significantly increase its SMT line capacity by 2028.
Strategic Outlook for Surface Mount Technology Industry Market
The SMT industry is poised for continued growth driven by technological advancements, increasing demand from various sectors, and expansion into new markets. The focus on automation, miniaturization, and sustainable manufacturing practices will shape the future of the industry. The market will continue to evolve with increased adoption of advanced technologies and strategic alliances, leading to further market consolidation and innovation.
Surface Mount Technology Industry Segmentation
-
1. Component
-
1.1. Passive Components
- 1.1.1. Resistors
- 1.1.2. Capacitors
-
1.2. Active Components
- 1.2.1. Transistors
- 1.2.2. Integrated Circuits
-
1.1. Passive Components
-
2. End-user Industry
- 2.1. Consumer Electronics
- 2.2. Automotive
- 2.3. Industrial Electronics
- 2.4. Aerospace and Defense
- 2.5. Healthcare
- 2.6. Other End-user Industries
Surface Mount Technology Industry Segmentation By Geography
- 1. North America
- 2. Europe
- 3. Asia
- 4. Australia and New Zealand
- 5. Latin America
- 6. Middle East and Africa
Surface Mount Technology Industry REPORT HIGHLIGHTS
| Aspects | Details |
|---|---|
| Study Period | 2019-2033 |
| Base Year | 2024 |
| Estimated Year | 2025 |
| Forecast Period | 2025-2033 |
| Historical Period | 2019-2024 |
| Growth Rate | CAGR of 7.60% from 2019-2033 |
| Segmentation |
|
Table of Contents
- 1. Introduction
- 1.1. Research Scope
- 1.2. Market Segmentation
- 1.3. Research Methodology
- 1.4. Definitions and Assumptions
- 2. Executive Summary
- 2.1. Introduction
- 3. Market Dynamics
- 3.1. Introduction
- 3.2. Market Drivers
- 3.2.1. Increase in Defense Budgets Across Geographies
- 3.3. Market Restrains
- 3.3.1. Highly Consolidated Market
- 3.4. Market Trends
- 3.4.1. Consumer Electronics End-user Industry Segment is Expected to Hold Significant Market Share
- 4. Market Factor Analysis
- 4.1. Porters Five Forces
- 4.2. Supply/Value Chain
- 4.3. PESTEL analysis
- 4.4. Market Entropy
- 4.5. Patent/Trademark Analysis
- 5. Global Surface Mount Technology Industry Analysis, Insights and Forecast, 2019-2031
- 5.1. Market Analysis, Insights and Forecast - by Component
- 5.1.1. Passive Components
- 5.1.1.1. Resistors
- 5.1.1.2. Capacitors
- 5.1.2. Active Components
- 5.1.2.1. Transistors
- 5.1.2.2. Integrated Circuits
- 5.1.1. Passive Components
- 5.2. Market Analysis, Insights and Forecast - by End-user Industry
- 5.2.1. Consumer Electronics
- 5.2.2. Automotive
- 5.2.3. Industrial Electronics
- 5.2.4. Aerospace and Defense
- 5.2.5. Healthcare
- 5.2.6. Other End-user Industries
- 5.3. Market Analysis, Insights and Forecast - by Region
- 5.3.1. North America
- 5.3.2. Europe
- 5.3.3. Asia
- 5.3.4. Australia and New Zealand
- 5.3.5. Latin America
- 5.3.6. Middle East and Africa
- 5.1. Market Analysis, Insights and Forecast - by Component
- 6. North America Surface Mount Technology Industry Analysis, Insights and Forecast, 2019-2031
- 6.1. Market Analysis, Insights and Forecast - by Component
- 6.1.1. Passive Components
- 6.1.1.1. Resistors
- 6.1.1.2. Capacitors
- 6.1.2. Active Components
- 6.1.2.1. Transistors
- 6.1.2.2. Integrated Circuits
- 6.1.1. Passive Components
- 6.2. Market Analysis, Insights and Forecast - by End-user Industry
- 6.2.1. Consumer Electronics
- 6.2.2. Automotive
- 6.2.3. Industrial Electronics
- 6.2.4. Aerospace and Defense
- 6.2.5. Healthcare
- 6.2.6. Other End-user Industries
- 6.1. Market Analysis, Insights and Forecast - by Component
- 7. Europe Surface Mount Technology Industry Analysis, Insights and Forecast, 2019-2031
- 7.1. Market Analysis, Insights and Forecast - by Component
- 7.1.1. Passive Components
- 7.1.1.1. Resistors
- 7.1.1.2. Capacitors
- 7.1.2. Active Components
- 7.1.2.1. Transistors
- 7.1.2.2. Integrated Circuits
- 7.1.1. Passive Components
- 7.2. Market Analysis, Insights and Forecast - by End-user Industry
- 7.2.1. Consumer Electronics
- 7.2.2. Automotive
- 7.2.3. Industrial Electronics
- 7.2.4. Aerospace and Defense
- 7.2.5. Healthcare
- 7.2.6. Other End-user Industries
- 7.1. Market Analysis, Insights and Forecast - by Component
- 8. Asia Surface Mount Technology Industry Analysis, Insights and Forecast, 2019-2031
- 8.1. Market Analysis, Insights and Forecast - by Component
- 8.1.1. Passive Components
- 8.1.1.1. Resistors
- 8.1.1.2. Capacitors
- 8.1.2. Active Components
- 8.1.2.1. Transistors
- 8.1.2.2. Integrated Circuits
- 8.1.1. Passive Components
- 8.2. Market Analysis, Insights and Forecast - by End-user Industry
- 8.2.1. Consumer Electronics
- 8.2.2. Automotive
- 8.2.3. Industrial Electronics
- 8.2.4. Aerospace and Defense
- 8.2.5. Healthcare
- 8.2.6. Other End-user Industries
- 8.1. Market Analysis, Insights and Forecast - by Component
- 9. Australia and New Zealand Surface Mount Technology Industry Analysis, Insights and Forecast, 2019-2031
- 9.1. Market Analysis, Insights and Forecast - by Component
- 9.1.1. Passive Components
- 9.1.1.1. Resistors
- 9.1.1.2. Capacitors
- 9.1.2. Active Components
- 9.1.2.1. Transistors
- 9.1.2.2. Integrated Circuits
- 9.1.1. Passive Components
- 9.2. Market Analysis, Insights and Forecast - by End-user Industry
- 9.2.1. Consumer Electronics
- 9.2.2. Automotive
- 9.2.3. Industrial Electronics
- 9.2.4. Aerospace and Defense
- 9.2.5. Healthcare
- 9.2.6. Other End-user Industries
- 9.1. Market Analysis, Insights and Forecast - by Component
- 10. Latin America Surface Mount Technology Industry Analysis, Insights and Forecast, 2019-2031
- 10.1. Market Analysis, Insights and Forecast - by Component
- 10.1.1. Passive Components
- 10.1.1.1. Resistors
- 10.1.1.2. Capacitors
- 10.1.2. Active Components
- 10.1.2.1. Transistors
- 10.1.2.2. Integrated Circuits
- 10.1.1. Passive Components
- 10.2. Market Analysis, Insights and Forecast - by End-user Industry
- 10.2.1. Consumer Electronics
- 10.2.2. Automotive
- 10.2.3. Industrial Electronics
- 10.2.4. Aerospace and Defense
- 10.2.5. Healthcare
- 10.2.6. Other End-user Industries
- 10.1. Market Analysis, Insights and Forecast - by Component
- 11. Middle East and Africa Surface Mount Technology Industry Analysis, Insights and Forecast, 2019-2031
- 11.1. Market Analysis, Insights and Forecast - by Component
- 11.1.1. Passive Components
- 11.1.1.1. Resistors
- 11.1.1.2. Capacitors
- 11.1.2. Active Components
- 11.1.2.1. Transistors
- 11.1.2.2. Integrated Circuits
- 11.1.1. Passive Components
- 11.2. Market Analysis, Insights and Forecast - by End-user Industry
- 11.2.1. Consumer Electronics
- 11.2.2. Automotive
- 11.2.3. Industrial Electronics
- 11.2.4. Aerospace and Defense
- 11.2.5. Healthcare
- 11.2.6. Other End-user Industries
- 11.1. Market Analysis, Insights and Forecast - by Component
- 12. North America Surface Mount Technology Industry Analysis, Insights and Forecast, 2019-2031
- 12.1. Market Analysis, Insights and Forecast - By Country/Sub-region
- 12.1.1 United States
- 12.1.2 Canada
- 12.1.3 Mexico
- 13. Europe Surface Mount Technology Industry Analysis, Insights and Forecast, 2019-2031
- 13.1. Market Analysis, Insights and Forecast - By Country/Sub-region
- 13.1.1 Germany
- 13.1.2 United Kingdom
- 13.1.3 France
- 13.1.4 Spain
- 13.1.5 Italy
- 13.1.6 Spain
- 13.1.7 Belgium
- 13.1.8 Netherland
- 13.1.9 Nordics
- 13.1.10 Rest of Europe
- 14. Asia Pacific Surface Mount Technology Industry Analysis, Insights and Forecast, 2019-2031
- 14.1. Market Analysis, Insights and Forecast - By Country/Sub-region
- 14.1.1 China
- 14.1.2 Japan
- 14.1.3 India
- 14.1.4 South Korea
- 14.1.5 Southeast Asia
- 14.1.6 Australia
- 14.1.7 Indonesia
- 14.1.8 Phillipes
- 14.1.9 Singapore
- 14.1.10 Thailandc
- 14.1.11 Rest of Asia Pacific
- 15. South America Surface Mount Technology Industry Analysis, Insights and Forecast, 2019-2031
- 15.1. Market Analysis, Insights and Forecast - By Country/Sub-region
- 15.1.1 Brazil
- 15.1.2 Argentina
- 15.1.3 Peru
- 15.1.4 Chile
- 15.1.5 Colombia
- 15.1.6 Ecuador
- 15.1.7 Venezuela
- 15.1.8 Rest of South America
- 16. North America Surface Mount Technology Industry Analysis, Insights and Forecast, 2019-2031
- 16.1. Market Analysis, Insights and Forecast - By Country/Sub-region
- 16.1.1 United States
- 16.1.2 Canada
- 16.1.3 Mexico
- 17. MEA Surface Mount Technology Industry Analysis, Insights and Forecast, 2019-2031
- 17.1. Market Analysis, Insights and Forecast - By Country/Sub-region
- 17.1.1 United Arab Emirates
- 17.1.2 Saudi Arabia
- 17.1.3 South Africa
- 17.1.4 Rest of Middle East and Africa
- 18. Competitive Analysis
- 18.1. Global Market Share Analysis 2024
- 18.2. Company Profiles
- 18.2.1 Mycronic AB
- 18.2.1.1. Overview
- 18.2.1.2. Products
- 18.2.1.3. SWOT Analysis
- 18.2.1.4. Recent Developments
- 18.2.1.5. Financials (Based on Availability)
- 18.2.2 Yamaha Motor Co Ltd
- 18.2.2.1. Overview
- 18.2.2.2. Products
- 18.2.2.3. SWOT Analysis
- 18.2.2.4. Recent Developments
- 18.2.2.5. Financials (Based on Availability)
- 18.2.3 Nordson Corporation
- 18.2.3.1. Overview
- 18.2.3.2. Products
- 18.2.3.3. SWOT Analysis
- 18.2.3.4. Recent Developments
- 18.2.3.5. Financials (Based on Availability)
- 18.2.4 Hanwa Precision Machinery Co Ltd
- 18.2.4.1. Overview
- 18.2.4.2. Products
- 18.2.4.3. SWOT Analysis
- 18.2.4.4. Recent Developments
- 18.2.4.5. Financials (Based on Availability)
- 18.2.5 Viscom S
- 18.2.5.1. Overview
- 18.2.5.2. Products
- 18.2.5.3. SWOT Analysis
- 18.2.5.4. Recent Developments
- 18.2.5.5. Financials (Based on Availability)
- 18.2.6 Juki Corporation
- 18.2.6.1. Overview
- 18.2.6.2. Products
- 18.2.6.3. SWOT Analysis
- 18.2.6.4. Recent Developments
- 18.2.6.5. Financials (Based on Availability)
- 18.2.7 Zhejiang Neoden Technology Co Ltd
- 18.2.7.1. Overview
- 18.2.7.2. Products
- 18.2.7.3. SWOT Analysis
- 18.2.7.4. Recent Developments
- 18.2.7.5. Financials (Based on Availability)
- 18.2.8 Fuji Corporation
- 18.2.8.1. Overview
- 18.2.8.2. Products
- 18.2.8.3. SWOT Analysis
- 18.2.8.4. Recent Developments
- 18.2.8.5. Financials (Based on Availability)
- 18.2.9 Europlacer Limited
- 18.2.9.1. Overview
- 18.2.9.2. Products
- 18.2.9.3. SWOT Analysis
- 18.2.9.4. Recent Developments
- 18.2.9.5. Financials (Based on Availability)
- 18.2.10 ASMPT
- 18.2.10.1. Overview
- 18.2.10.2. Products
- 18.2.10.3. SWOT Analysis
- 18.2.10.4. Recent Developments
- 18.2.10.5. Financials (Based on Availability)
- 18.2.11 Panasonic Corporation
- 18.2.11.1. Overview
- 18.2.11.2. Products
- 18.2.11.3. SWOT Analysis
- 18.2.11.4. Recent Developments
- 18.2.11.5. Financials (Based on Availability)
- 18.2.1 Mycronic AB
List of Figures
- Figure 1: Global Surface Mount Technology Industry Revenue Breakdown (Million, %) by Region 2024 & 2032
- Figure 2: North America Surface Mount Technology Industry Revenue (Million), by Country 2024 & 2032
- Figure 3: North America Surface Mount Technology Industry Revenue Share (%), by Country 2024 & 2032
- Figure 4: Europe Surface Mount Technology Industry Revenue (Million), by Country 2024 & 2032
- Figure 5: Europe Surface Mount Technology Industry Revenue Share (%), by Country 2024 & 2032
- Figure 6: Asia Pacific Surface Mount Technology Industry Revenue (Million), by Country 2024 & 2032
- Figure 7: Asia Pacific Surface Mount Technology Industry Revenue Share (%), by Country 2024 & 2032
- Figure 8: South America Surface Mount Technology Industry Revenue (Million), by Country 2024 & 2032
- Figure 9: South America Surface Mount Technology Industry Revenue Share (%), by Country 2024 & 2032
- Figure 10: North America Surface Mount Technology Industry Revenue (Million), by Country 2024 & 2032
- Figure 11: North America Surface Mount Technology Industry Revenue Share (%), by Country 2024 & 2032
- Figure 12: MEA Surface Mount Technology Industry Revenue (Million), by Country 2024 & 2032
- Figure 13: MEA Surface Mount Technology Industry Revenue Share (%), by Country 2024 & 2032
- Figure 14: North America Surface Mount Technology Industry Revenue (Million), by Component 2024 & 2032
- Figure 15: North America Surface Mount Technology Industry Revenue Share (%), by Component 2024 & 2032
- Figure 16: North America Surface Mount Technology Industry Revenue (Million), by End-user Industry 2024 & 2032
- Figure 17: North America Surface Mount Technology Industry Revenue Share (%), by End-user Industry 2024 & 2032
- Figure 18: North America Surface Mount Technology Industry Revenue (Million), by Country 2024 & 2032
- Figure 19: North America Surface Mount Technology Industry Revenue Share (%), by Country 2024 & 2032
- Figure 20: Europe Surface Mount Technology Industry Revenue (Million), by Component 2024 & 2032
- Figure 21: Europe Surface Mount Technology Industry Revenue Share (%), by Component 2024 & 2032
- Figure 22: Europe Surface Mount Technology Industry Revenue (Million), by End-user Industry 2024 & 2032
- Figure 23: Europe Surface Mount Technology Industry Revenue Share (%), by End-user Industry 2024 & 2032
- Figure 24: Europe Surface Mount Technology Industry Revenue (Million), by Country 2024 & 2032
- Figure 25: Europe Surface Mount Technology Industry Revenue Share (%), by Country 2024 & 2032
- Figure 26: Asia Surface Mount Technology Industry Revenue (Million), by Component 2024 & 2032
- Figure 27: Asia Surface Mount Technology Industry Revenue Share (%), by Component 2024 & 2032
- Figure 28: Asia Surface Mount Technology Industry Revenue (Million), by End-user Industry 2024 & 2032
- Figure 29: Asia Surface Mount Technology Industry Revenue Share (%), by End-user Industry 2024 & 2032
- Figure 30: Asia Surface Mount Technology Industry Revenue (Million), by Country 2024 & 2032
- Figure 31: Asia Surface Mount Technology Industry Revenue Share (%), by Country 2024 & 2032
- Figure 32: Australia and New Zealand Surface Mount Technology Industry Revenue (Million), by Component 2024 & 2032
- Figure 33: Australia and New Zealand Surface Mount Technology Industry Revenue Share (%), by Component 2024 & 2032
- Figure 34: Australia and New Zealand Surface Mount Technology Industry Revenue (Million), by End-user Industry 2024 & 2032
- Figure 35: Australia and New Zealand Surface Mount Technology Industry Revenue Share (%), by End-user Industry 2024 & 2032
- Figure 36: Australia and New Zealand Surface Mount Technology Industry Revenue (Million), by Country 2024 & 2032
- Figure 37: Australia and New Zealand Surface Mount Technology Industry Revenue Share (%), by Country 2024 & 2032
- Figure 38: Latin America Surface Mount Technology Industry Revenue (Million), by Component 2024 & 2032
- Figure 39: Latin America Surface Mount Technology Industry Revenue Share (%), by Component 2024 & 2032
- Figure 40: Latin America Surface Mount Technology Industry Revenue (Million), by End-user Industry 2024 & 2032
- Figure 41: Latin America Surface Mount Technology Industry Revenue Share (%), by End-user Industry 2024 & 2032
- Figure 42: Latin America Surface Mount Technology Industry Revenue (Million), by Country 2024 & 2032
- Figure 43: Latin America Surface Mount Technology Industry Revenue Share (%), by Country 2024 & 2032
- Figure 44: Middle East and Africa Surface Mount Technology Industry Revenue (Million), by Component 2024 & 2032
- Figure 45: Middle East and Africa Surface Mount Technology Industry Revenue Share (%), by Component 2024 & 2032
- Figure 46: Middle East and Africa Surface Mount Technology Industry Revenue (Million), by End-user Industry 2024 & 2032
- Figure 47: Middle East and Africa Surface Mount Technology Industry Revenue Share (%), by End-user Industry 2024 & 2032
- Figure 48: Middle East and Africa Surface Mount Technology Industry Revenue (Million), by Country 2024 & 2032
- Figure 49: Middle East and Africa Surface Mount Technology Industry Revenue Share (%), by Country 2024 & 2032
List of Tables
- Table 1: Global Surface Mount Technology Industry Revenue Million Forecast, by Region 2019 & 2032
- Table 2: Global Surface Mount Technology Industry Revenue Million Forecast, by Component 2019 & 2032
- Table 3: Global Surface Mount Technology Industry Revenue Million Forecast, by End-user Industry 2019 & 2032
- Table 4: Global Surface Mount Technology Industry Revenue Million Forecast, by Region 2019 & 2032
- Table 5: Global Surface Mount Technology Industry Revenue Million Forecast, by Country 2019 & 2032
- Table 6: United States Surface Mount Technology Industry Revenue (Million) Forecast, by Application 2019 & 2032
- Table 7: Canada Surface Mount Technology Industry Revenue (Million) Forecast, by Application 2019 & 2032
- Table 8: Mexico Surface Mount Technology Industry Revenue (Million) Forecast, by Application 2019 & 2032
- Table 9: Global Surface Mount Technology Industry Revenue Million Forecast, by Country 2019 & 2032
- Table 10: Germany Surface Mount Technology Industry Revenue (Million) Forecast, by Application 2019 & 2032
- Table 11: United Kingdom Surface Mount Technology Industry Revenue (Million) Forecast, by Application 2019 & 2032
- Table 12: France Surface Mount Technology Industry Revenue (Million) Forecast, by Application 2019 & 2032
- Table 13: Spain Surface Mount Technology Industry Revenue (Million) Forecast, by Application 2019 & 2032
- Table 14: Italy Surface Mount Technology Industry Revenue (Million) Forecast, by Application 2019 & 2032
- Table 15: Spain Surface Mount Technology Industry Revenue (Million) Forecast, by Application 2019 & 2032
- Table 16: Belgium Surface Mount Technology Industry Revenue (Million) Forecast, by Application 2019 & 2032
- Table 17: Netherland Surface Mount Technology Industry Revenue (Million) Forecast, by Application 2019 & 2032
- Table 18: Nordics Surface Mount Technology Industry Revenue (Million) Forecast, by Application 2019 & 2032
- Table 19: Rest of Europe Surface Mount Technology Industry Revenue (Million) Forecast, by Application 2019 & 2032
- Table 20: Global Surface Mount Technology Industry Revenue Million Forecast, by Country 2019 & 2032
- Table 21: China Surface Mount Technology Industry Revenue (Million) Forecast, by Application 2019 & 2032
- Table 22: Japan Surface Mount Technology Industry Revenue (Million) Forecast, by Application 2019 & 2032
- Table 23: India Surface Mount Technology Industry Revenue (Million) Forecast, by Application 2019 & 2032
- Table 24: South Korea Surface Mount Technology Industry Revenue (Million) Forecast, by Application 2019 & 2032
- Table 25: Southeast Asia Surface Mount Technology Industry Revenue (Million) Forecast, by Application 2019 & 2032
- Table 26: Australia Surface Mount Technology Industry Revenue (Million) Forecast, by Application 2019 & 2032
- Table 27: Indonesia Surface Mount Technology Industry Revenue (Million) Forecast, by Application 2019 & 2032
- Table 28: Phillipes Surface Mount Technology Industry Revenue (Million) Forecast, by Application 2019 & 2032
- Table 29: Singapore Surface Mount Technology Industry Revenue (Million) Forecast, by Application 2019 & 2032
- Table 30: Thailandc Surface Mount Technology Industry Revenue (Million) Forecast, by Application 2019 & 2032
- Table 31: Rest of Asia Pacific Surface Mount Technology Industry Revenue (Million) Forecast, by Application 2019 & 2032
- Table 32: Global Surface Mount Technology Industry Revenue Million Forecast, by Country 2019 & 2032
- Table 33: Brazil Surface Mount Technology Industry Revenue (Million) Forecast, by Application 2019 & 2032
- Table 34: Argentina Surface Mount Technology Industry Revenue (Million) Forecast, by Application 2019 & 2032
- Table 35: Peru Surface Mount Technology Industry Revenue (Million) Forecast, by Application 2019 & 2032
- Table 36: Chile Surface Mount Technology Industry Revenue (Million) Forecast, by Application 2019 & 2032
- Table 37: Colombia Surface Mount Technology Industry Revenue (Million) Forecast, by Application 2019 & 2032
- Table 38: Ecuador Surface Mount Technology Industry Revenue (Million) Forecast, by Application 2019 & 2032
- Table 39: Venezuela Surface Mount Technology Industry Revenue (Million) Forecast, by Application 2019 & 2032
- Table 40: Rest of South America Surface Mount Technology Industry Revenue (Million) Forecast, by Application 2019 & 2032
- Table 41: Global Surface Mount Technology Industry Revenue Million Forecast, by Country 2019 & 2032
- Table 42: United States Surface Mount Technology Industry Revenue (Million) Forecast, by Application 2019 & 2032
- Table 43: Canada Surface Mount Technology Industry Revenue (Million) Forecast, by Application 2019 & 2032
- Table 44: Mexico Surface Mount Technology Industry Revenue (Million) Forecast, by Application 2019 & 2032
- Table 45: Global Surface Mount Technology Industry Revenue Million Forecast, by Country 2019 & 2032
- Table 46: United Arab Emirates Surface Mount Technology Industry Revenue (Million) Forecast, by Application 2019 & 2032
- Table 47: Saudi Arabia Surface Mount Technology Industry Revenue (Million) Forecast, by Application 2019 & 2032
- Table 48: South Africa Surface Mount Technology Industry Revenue (Million) Forecast, by Application 2019 & 2032
- Table 49: Rest of Middle East and Africa Surface Mount Technology Industry Revenue (Million) Forecast, by Application 2019 & 2032
- Table 50: Global Surface Mount Technology Industry Revenue Million Forecast, by Component 2019 & 2032
- Table 51: Global Surface Mount Technology Industry Revenue Million Forecast, by End-user Industry 2019 & 2032
- Table 52: Global Surface Mount Technology Industry Revenue Million Forecast, by Country 2019 & 2032
- Table 53: Global Surface Mount Technology Industry Revenue Million Forecast, by Component 2019 & 2032
- Table 54: Global Surface Mount Technology Industry Revenue Million Forecast, by End-user Industry 2019 & 2032
- Table 55: Global Surface Mount Technology Industry Revenue Million Forecast, by Country 2019 & 2032
- Table 56: Global Surface Mount Technology Industry Revenue Million Forecast, by Component 2019 & 2032
- Table 57: Global Surface Mount Technology Industry Revenue Million Forecast, by End-user Industry 2019 & 2032
- Table 58: Global Surface Mount Technology Industry Revenue Million Forecast, by Country 2019 & 2032
- Table 59: Global Surface Mount Technology Industry Revenue Million Forecast, by Component 2019 & 2032
- Table 60: Global Surface Mount Technology Industry Revenue Million Forecast, by End-user Industry 2019 & 2032
- Table 61: Global Surface Mount Technology Industry Revenue Million Forecast, by Country 2019 & 2032
- Table 62: Global Surface Mount Technology Industry Revenue Million Forecast, by Component 2019 & 2032
- Table 63: Global Surface Mount Technology Industry Revenue Million Forecast, by End-user Industry 2019 & 2032
- Table 64: Global Surface Mount Technology Industry Revenue Million Forecast, by Country 2019 & 2032
- Table 65: Global Surface Mount Technology Industry Revenue Million Forecast, by Component 2019 & 2032
- Table 66: Global Surface Mount Technology Industry Revenue Million Forecast, by End-user Industry 2019 & 2032
- Table 67: Global Surface Mount Technology Industry Revenue Million Forecast, by Country 2019 & 2032
Frequently Asked Questions
1. What is the projected Compound Annual Growth Rate (CAGR) of the Surface Mount Technology Industry?
The projected CAGR is approximately 7.60%.
2. Which companies are prominent players in the Surface Mount Technology Industry?
Key companies in the market include Mycronic AB, Yamaha Motor Co Ltd, Nordson Corporation, Hanwa Precision Machinery Co Ltd, Viscom S, Juki Corporation, Zhejiang Neoden Technology Co Ltd, Fuji Corporation, Europlacer Limited, ASMPT, Panasonic Corporation.
3. What are the main segments of the Surface Mount Technology Industry?
The market segments include Component, End-user Industry.
4. Can you provide details about the market size?
The market size is estimated to be USD 6.14 Million as of 2022.
5. What are some drivers contributing to market growth?
Increase in Defense Budgets Across Geographies.
6. What are the notable trends driving market growth?
Consumer Electronics End-user Industry Segment is Expected to Hold Significant Market Share.
7. Are there any restraints impacting market growth?
Highly Consolidated Market.
8. Can you provide examples of recent developments in the market?
June 2024 - Beifu Electronic Technology Co. Ltd, based in Shanghai, has recently integrated Europlacer's cutting-edge pick-and-place technology into its operations. Beifu Electronic has significantly ramped up its production efficiency in the last two years, courtesy of Europlacer's Atom pick-and-place range. With a pressing need for swift changeovers and enhanced flexibility, Beifu Electronic turned to Europlacer's Atom technology, finding it the ideal fit. Due to the Atom range, Beifu Electric has bolstered its production capabilities and slashed turnaround times while upholding its stringent quality benchmarks.
9. What pricing options are available for accessing the report?
Pricing options include single-user, multi-user, and enterprise licenses priced at USD 4750, USD 5250, and USD 8750 respectively.
10. Is the market size provided in terms of value or volume?
The market size is provided in terms of value, measured in Million.
11. Are there any specific market keywords associated with the report?
Yes, the market keyword associated with the report is "Surface Mount Technology Industry," which aids in identifying and referencing the specific market segment covered.
12. How do I determine which pricing option suits my needs best?
The pricing options vary based on user requirements and access needs. Individual users may opt for single-user licenses, while businesses requiring broader access may choose multi-user or enterprise licenses for cost-effective access to the report.
13. Are there any additional resources or data provided in the Surface Mount Technology Industry report?
While the report offers comprehensive insights, it's advisable to review the specific contents or supplementary materials provided to ascertain if additional resources or data are available.
14. How can I stay updated on further developments or reports in the Surface Mount Technology Industry?
To stay informed about further developments, trends, and reports in the Surface Mount Technology Industry, consider subscribing to industry newsletters, following relevant companies and organizations, or regularly checking reputable industry news sources and publications.
Methodology
Step 1 - Identification of Relevant Samples Size from Population Database


Step 2 - Approaches for Defining Global Market Size (Value, Volume* & Price*)

Note*: In applicable scenarios
Step 3 - Data Sources
Primary Research
- Web Analytics
- Survey Reports
- Research Institute
- Latest Research Reports
- Opinion Leaders
Secondary Research
- Annual Reports
- White Paper
- Latest Press Release
- Industry Association
- Paid Database
- Investor Presentations

Step 4 - Data Triangulation
Involves using different sources of information in order to increase the validity of a study
These sources are likely to be stakeholders in a program - participants, other researchers, program staff, other community members, and so on.
Then we put all data in single framework & apply various statistical tools to find out the dynamic on the market.
During the analysis stage, feedback from the stakeholder groups would be compared to determine areas of agreement as well as areas of divergence


