

Key Insights
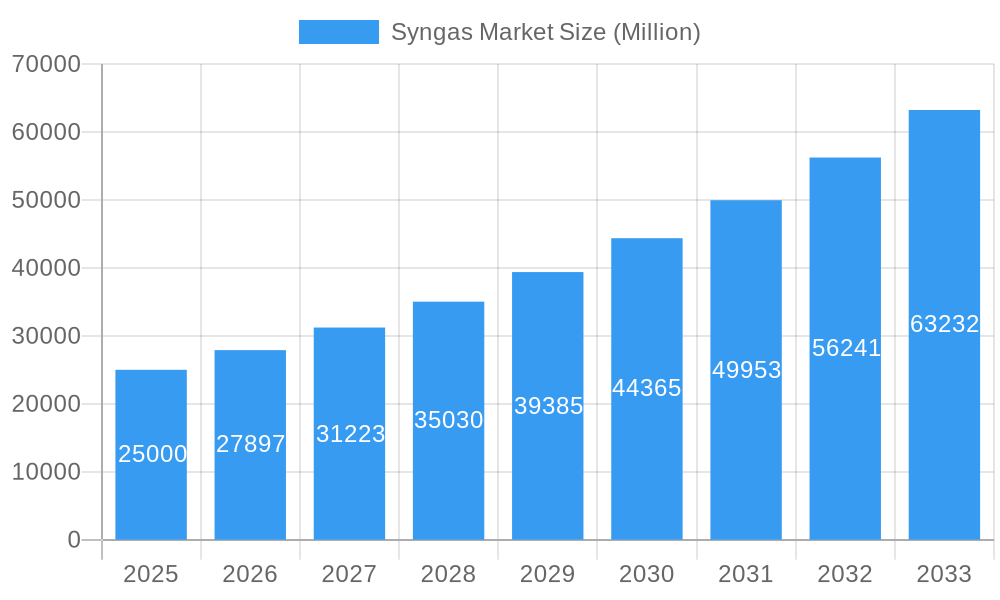
The global syngas market is experiencing robust growth, projected to reach a substantial size driven by increasing demand for its diverse applications. The market's 11.45% CAGR from 2019 to 2024 indicates a significant upward trajectory, expected to continue throughout the forecast period (2025-2033). Key drivers include the rising adoption of syngas in the production of methanol, ammonia, and other vital chemicals, alongside the growing focus on cleaner energy sources and the burgeoning renewable energy sector. The shift towards sustainable practices is fueling demand for syngas derived from renewable feedstocks like biomass, contributing to the overall market expansion. Technological advancements in syngas production, particularly in gasification technologies like entrained flow and fluidized bed systems, are further enhancing efficiency and reducing production costs. The market is segmented by technology (steam reforming, gasification), gasifier type (fixed bed, entrained flow, fluidized bed), application (methanol, ammonia, hydrogen, liquid fuels, direct reduced iron, synthetic natural gas, electricity), and feedstock (pet coke, coal, natural gas). Geographic regions like North America, Europe, and Asia Pacific are leading the market, with China and the United States representing significant consumption hubs. However, the market also faces certain restraints, such as fluctuating feedstock prices and stringent environmental regulations, which necessitate continuous innovation and sustainable practices within the industry.
Syngas Market Market Size (In Billion)
The competitive landscape is characterized by the presence of major players including Linde PLC, Shell PLC, Air Products and Chemicals Inc., and others, constantly striving for innovation and market share. Future market growth will be influenced by government policies promoting renewable energy and carbon capture technologies. Increased investment in research and development focused on improving gasification efficiency and reducing greenhouse gas emissions will likely shape the market's trajectory. The expansion into emerging economies, particularly in Asia Pacific, presents significant opportunities for growth, while navigating regulatory hurdles and ensuring sustainable practices remains crucial for long-term market success. Considering the market's growth trajectory and the diverse applications of syngas, the prospects for continued expansion appear promising in the years to come. Precise market sizing for 2025 and beyond requires specific data points unavailable in the provided information. However, reasonable estimations can be made leveraging the provided CAGR and considering the general upward trend in the sector, accounting for potential fluctuations due to geopolitical or economic factors.
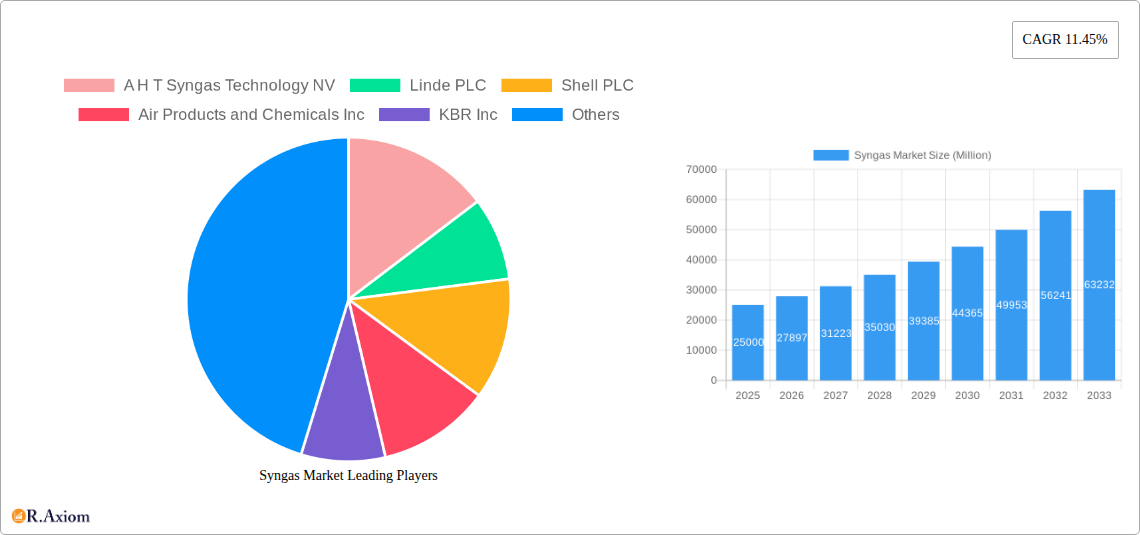
Syngas Market Company Market Share
Syngas Market: A Comprehensive Report (2019-2033)
This in-depth report provides a comprehensive analysis of the global syngas market, offering valuable insights for industry stakeholders, investors, and researchers. Covering the period 2019-2033, with a focus on 2025, this report unveils market dynamics, growth drivers, challenges, and emerging opportunities within the syngas production and utilization landscape. The study meticulously segments the market by technology, gasifier type, application, and feedstock, providing granular data and projections for informed decision-making.
Syngas Market Concentration & Innovation
The syngas market exhibits a moderately concentrated landscape, with several multinational corporations holding significant market share. Key players, including Linde PLC, Shell PLC, Air Products and Chemicals Inc, KBR Inc, and Technip Energies NV, dominate the market, leveraging their technological expertise and global reach. However, smaller players and innovative startups are also contributing to market growth, particularly in niche applications and emerging technologies.
Market share distribution is dynamic, influenced by technological advancements, M&A activities, and evolving regulatory landscapes. While precise market share figures are proprietary to this report, the analysis indicates a concentration among the top 10 players accounting for approximately xx% of the total market revenue in 2024.
Recent M&A activities have significantly reshaped the competitive landscape. The total value of M&A deals in the syngas sector during the historical period (2019-2024) is estimated to be approximately $xx Million. These transactions have facilitated technology transfer, expanded market access, and accelerated innovation. Furthermore, regulatory frameworks, particularly those focused on emission reduction and environmental sustainability, significantly influence innovation and market development. The shift towards renewable feedstocks and carbon capture, utilization, and storage (CCUS) technologies drives substantial innovation, shaping the future trajectory of the syngas industry. Product substitutes, such as direct use of natural gas and other renewable energy sources, pose a moderate threat to syngas in specific applications, but the versatility and established infrastructure for syngas production often provide a competitive advantage. End-user trends reflect a growing demand for sustainable fuels and chemicals, prompting increased investments in syngas production from renewable sources.
Syngas Market Industry Trends & Insights
The global syngas market is projected to witness substantial growth, with a Compound Annual Growth Rate (CAGR) of xx% during the forecast period (2025-2033). This growth is primarily fueled by the rising demand for methanol, ammonia, and hydrogen, which are key syngas-derived products. The increasing focus on decarbonization and the transition to a low-carbon economy is a significant catalyst, driving investments in technologies that utilize renewable feedstocks and implement CCUS strategies. Market penetration of syngas in various applications is steadily increasing, particularly in the power generation and chemical industries. Technological advancements in gasification and purification processes, enhancing efficiency and reducing costs, further contribute to market expansion. Consumer preferences are also shifting towards sustainable products, creating a favorable environment for syngas-based solutions. However, the competitive landscape remains dynamic, with existing players and new entrants constantly vying for market share through product innovation and strategic partnerships. The pricing dynamics of syngas are influenced by fluctuating feedstock costs and the competitive pressures from alternative fuels and chemicals.
Dominant Markets & Segments in Syngas Market
Leading Region: Asia-Pacific is projected to dominate the syngas market throughout the forecast period due to rapid industrialization, increasing energy demand, and significant investments in petrochemical and fertilizer industries. China and India are key growth drivers in this region.
Leading Country: China, with its extensive coal reserves and burgeoning chemical industry, is poised to remain the largest syngas market globally.
Dominant Technology: Steam reforming currently holds the largest market share in syngas production due to its established technology and relatively lower capital costs. However, gasification technologies are gaining traction, especially those utilizing biomass and waste materials, driven by sustainability concerns.
Dominant Gasifier Type: Entrained flow gasifiers are favored for their high throughput and suitability for various feedstocks, while fixed-bed gasifiers maintain a strong presence in smaller-scale applications.
Dominant Application: The production of methanol and ammonia consumes the largest proportion of syngas globally.
Dominant Feedstock: Natural gas is currently the dominant feedstock for syngas production, but the increasing focus on sustainability is driving the adoption of coal and other alternative feedstocks, including biomass and waste materials.
Key Drivers:
- Economic Policies: Government incentives and subsidies promoting renewable energy and industrial development, especially in emerging economies.
- Infrastructure Development: Investments in gas pipelines and processing facilities enhancing syngas distribution and utilization.
- Technological Advancements: Innovations in gasification and purification technologies, improving efficiency and reducing costs.
Syngas Market Product Developments
Recent product innovations focus on enhancing the efficiency and sustainability of syngas production and utilization. New gasification technologies, utilizing renewable feedstocks and integrated CCUS systems, are gaining prominence. Advances in syngas purification processes are also improving product quality and minimizing environmental impact. These innovations are driving the wider adoption of syngas in various applications, particularly in the production of sustainable fuels and chemicals. The competitive advantage is increasingly linked to the cost-effectiveness, environmental performance, and versatility of the syngas production and processing technology.
Report Scope & Segmentation Analysis
This report segments the syngas market across several key dimensions:
Technology: Steam Reforming, Gasification (each with projected market size and growth rate for 2025-2033). Steam reforming is expected to retain a substantial share in 2033, while gasification technologies will see strong growth due to environmental considerations.
Gasifier Type: Fixed Bed, Entrained Flow, Fluidized Bed (each with projected market size and growth rate for 2025-2033). Entrained flow is projected to maintain significant market dominance throughout the forecast period.
Application: Methanol, Ammonia, Hydrogen, Liquid Fuels, Direct Reduced Iron, Synthetic Natural Gas, Electricity, Other Applications (each with projected market size and growth rate for 2025-2033). Methanol and ammonia will remain significant drivers, but hydrogen and other sustainable fuel applications are likely to exhibit rapid growth.
Feedstock: Pet Coke, Coal, Natural Gas, Other Feedstock Types (each with projected market size and growth rate for 2025-2033). Natural gas will remain dominant, however, the utilization of other feedstocks, particularly biomass, is expected to grow significantly in the coming years due to environmental and sustainability concerns.
Key Drivers of Syngas Market Growth
The syngas market is propelled by several key factors: the increasing demand for hydrogen, a key component of fuel cells and emerging green technologies; the growth of the chemical industry's reliance on syngas for the production of crucial chemicals; and government policies promoting renewable energy and carbon reduction. The continuous innovation of more efficient and sustainable syngas production techniques also serves as a major driver.
Challenges in the Syngas Market Sector
Significant challenges exist within the syngas market. Stringent environmental regulations regarding emissions and feedstock sustainability impose substantial compliance costs. Fluctuations in feedstock prices, primarily natural gas, introduce significant cost volatility, impacting overall profitability. Furthermore, competition from alternative energy sources and the production of hydrogen using electrolysis poses a potential threat to syngas’ market share in some applications.
Emerging Opportunities in Syngas Market
The syngas market presents exciting opportunities. The growing demand for sustainable fuels and chemicals, coupled with advancements in carbon capture technologies, opens new avenues for growth. The utilization of waste biomass and other unconventional feedstocks offers a cost-effective and environmentally friendly approach to syngas production. Moreover, integration with power generation systems enhances overall efficiency and value proposition.
Leading Players in the Syngas Market Market
- A H T Syngas Technology NV
- Linde PLC
- Shell PLC
- Air Products and Chemicals Inc
- KBR Inc
- Airpower Technologies Limited
- Sasol
- Technip Energies NV
- Maire Tecnimont Spa
- John Wood Group PLC
- Topsoe AS
- Air Liquide
Key Developments in Syngas Market Industry
July 2022: Maire Tecnimont SpA's NextChem secured a contract from Storengy to study a waste wood and solid recovered fuel conversion plant for biomethane production in France. This highlights the growing interest in utilizing waste materials for syngas production.
June 2022: Shell PLC's decarbonization agreement with Tokyo Gas and Osaka Gas signifies the increasing role of syngas in achieving carbon neutrality targets within the natural gas sector.
May 2022: The collaboration between Pertamina and Air Liquide Indonesia on carbon capture and utilization technology at the Balikpapan refinery demonstrates the potential for integrating syngas production with existing industrial processes to reduce emissions.
Strategic Outlook for Syngas Market Market
The syngas market is poised for substantial growth, driven by the increasing demand for sustainable fuels and chemicals and the ongoing advancements in gasification and purification technologies. The integration of CCUS technologies will play a critical role in mitigating the environmental impact of syngas production. The continued development and adoption of renewable feedstocks will shape the future trajectory of the market, ensuring its long-term sustainability and growth.
Syngas Market Segmentation
-
1. Feedstock
- 1.1. Pet Coke
- 1.2. Coal
- 1.3. Natural Gas
- 1.4. Other Feedstock Types
-
2. Technology
- 2.1. Steam Reforming
- 2.2. Gasification
-
3. Gasifier Type
- 3.1. Fixed Bed
- 3.2. Entrained Flow
- 3.3. Fluidized Bed
-
4. Application
- 4.1. Methanol
- 4.2. Ammonia
- 4.3. Hydrogen
- 4.4. Liquid Fuels
- 4.5. Direct Reduced Iron
- 4.6. Synthetic Natural Gas
- 4.7. Electricity
- 4.8. Other Applications
Syngas Market Segmentation By Geography
-
1. Asia Pacific
- 1.1. China
- 1.2. India
- 1.3. Rest of Asia Pacific
-
2. North America
- 2.1. United States
- 2.2. Canada
- 2.3. Trinidad and Tobago
-
3. Europe
- 3.1. Russia
- 3.2. Rest of Europe
-
4. South America
- 4.1. Venezuela
- 4.2. Brazil
- 4.3. Rest of South America
-
5. Middle East and Africa
- 5.1. Saudi Arabia
- 5.2. Qatar
- 5.3. South Africa
- 5.4. Iran
- 5.5. Rest of Middle East and Africa
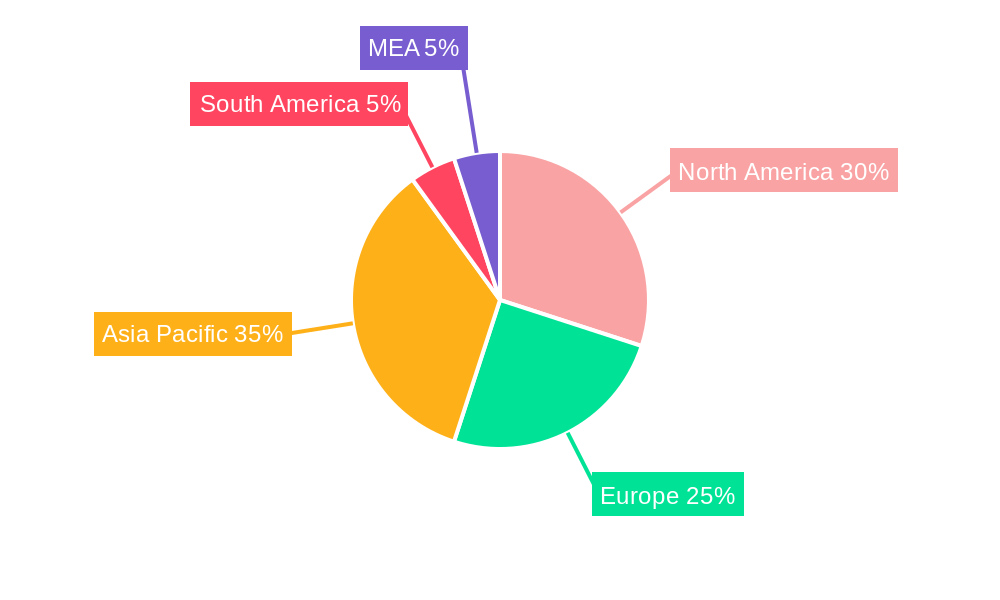
Syngas Market Regional Market Share
Geographic Coverage of Syngas Market
Syngas Market REPORT HIGHLIGHTS
| Aspects | Details |
|---|---|
| Study Period | 2020-2034 |
| Base Year | 2025 |
| Estimated Year | 2026 |
| Forecast Period | 2026-2034 |
| Historical Period | 2020-2025 |
| Growth Rate | CAGR of 11.3% from 2020-2034 |
| Segmentation |
|
Table of Contents
- 1. Introduction
- 1.1. Research Scope
- 1.2. Market Segmentation
- 1.3. Research Objective
- 1.4. Definitions and Assumptions
- 2. Executive Summary
- 2.1. Market Snapshot
- 3. Market Dynamics
- 3.1. Market Drivers
- 3.2. Market Restrains
- 3.3. Market Trends
- 3.4. Market Opportunities
- 4. Market Factor Analysis
- 4.1. Porters Five Forces
- 4.1.1. Bargaining Power of Suppliers
- 4.1.2. Bargaining Power of Buyers
- 4.1.3. Threat of New Entrants
- 4.1.4. Threat of Substitutes
- 4.1.5. Competitive Rivalry
- 4.2. PESTEL analysis
- 4.3. BCG Analysis
- 4.3.1. Stars (High Growth, High Market Share)
- 4.3.2. Cash Cows (Low Growth, High Market Share)
- 4.3.3. Question Mark (High Growth, Low Market Share)
- 4.3.4. Dogs (Low Growth, Low Market Share)
- 4.4. Ansoff Matrix Analysis
- 4.5. Supply Chain Analysis
- 4.6. Regulatory Landscape
- 4.7. Current Market Potential and Opportunity Assessment (TAM–SAM–SOM Framework)
- 4.8. RAX Analyst Note
- 4.1. Porters Five Forces
- 5. Market Analysis, Insights and Forecast 2021-2033
- 5.1. Market Analysis, Insights and Forecast - by Feedstock
- 5.1.1. Pet Coke
- 5.1.2. Coal
- 5.1.3. Natural Gas
- 5.1.4. Other Feedstock Types
- 5.2. Market Analysis, Insights and Forecast - by Technology
- 5.2.1. Steam Reforming
- 5.2.2. Gasification
- 5.3. Market Analysis, Insights and Forecast - by Gasifier Type
- 5.3.1. Fixed Bed
- 5.3.2. Entrained Flow
- 5.3.3. Fluidized Bed
- 5.4. Market Analysis, Insights and Forecast - by Application
- 5.4.1. Methanol
- 5.4.2. Ammonia
- 5.4.3. Hydrogen
- 5.4.4. Liquid Fuels
- 5.4.5. Direct Reduced Iron
- 5.4.6. Synthetic Natural Gas
- 5.4.7. Electricity
- 5.4.8. Other Applications
- 5.5. Market Analysis, Insights and Forecast - by Region
- 5.5.1. Asia Pacific
- 5.5.2. North America
- 5.5.3. Europe
- 5.5.4. South America
- 5.5.5. Middle East and Africa
- 5.1. Market Analysis, Insights and Forecast - by Feedstock
- 6. Global Syngas Market Analysis, Insights and Forecast, 2021-2033
- 6.1. Market Analysis, Insights and Forecast - by Feedstock
- 6.1.1. Pet Coke
- 6.1.2. Coal
- 6.1.3. Natural Gas
- 6.1.4. Other Feedstock Types
- 6.2. Market Analysis, Insights and Forecast - by Technology
- 6.2.1. Steam Reforming
- 6.2.2. Gasification
- 6.3. Market Analysis, Insights and Forecast - by Gasifier Type
- 6.3.1. Fixed Bed
- 6.3.2. Entrained Flow
- 6.3.3. Fluidized Bed
- 6.4. Market Analysis, Insights and Forecast - by Application
- 6.4.1. Methanol
- 6.4.2. Ammonia
- 6.4.3. Hydrogen
- 6.4.4. Liquid Fuels
- 6.4.5. Direct Reduced Iron
- 6.4.6. Synthetic Natural Gas
- 6.4.7. Electricity
- 6.4.8. Other Applications
- 6.1. Market Analysis, Insights and Forecast - by Feedstock
- 7. Asia Pacific Syngas Market Analysis, Insights and Forecast, 2020-2032
- 7.1. Market Analysis, Insights and Forecast - by Feedstock
- 7.1.1. Pet Coke
- 7.1.2. Coal
- 7.1.3. Natural Gas
- 7.1.4. Other Feedstock Types
- 7.2. Market Analysis, Insights and Forecast - by Technology
- 7.2.1. Steam Reforming
- 7.2.2. Gasification
- 7.3. Market Analysis, Insights and Forecast - by Gasifier Type
- 7.3.1. Fixed Bed
- 7.3.2. Entrained Flow
- 7.3.3. Fluidized Bed
- 7.4. Market Analysis, Insights and Forecast - by Application
- 7.4.1. Methanol
- 7.4.2. Ammonia
- 7.4.3. Hydrogen
- 7.4.4. Liquid Fuels
- 7.4.5. Direct Reduced Iron
- 7.4.6. Synthetic Natural Gas
- 7.4.7. Electricity
- 7.4.8. Other Applications
- 7.1. Market Analysis, Insights and Forecast - by Feedstock
- 8. North America Syngas Market Analysis, Insights and Forecast, 2020-2032
- 8.1. Market Analysis, Insights and Forecast - by Feedstock
- 8.1.1. Pet Coke
- 8.1.2. Coal
- 8.1.3. Natural Gas
- 8.1.4. Other Feedstock Types
- 8.2. Market Analysis, Insights and Forecast - by Technology
- 8.2.1. Steam Reforming
- 8.2.2. Gasification
- 8.3. Market Analysis, Insights and Forecast - by Gasifier Type
- 8.3.1. Fixed Bed
- 8.3.2. Entrained Flow
- 8.3.3. Fluidized Bed
- 8.4. Market Analysis, Insights and Forecast - by Application
- 8.4.1. Methanol
- 8.4.2. Ammonia
- 8.4.3. Hydrogen
- 8.4.4. Liquid Fuels
- 8.4.5. Direct Reduced Iron
- 8.4.6. Synthetic Natural Gas
- 8.4.7. Electricity
- 8.4.8. Other Applications
- 8.1. Market Analysis, Insights and Forecast - by Feedstock
- 9. Europe Syngas Market Analysis, Insights and Forecast, 2020-2032
- 9.1. Market Analysis, Insights and Forecast - by Feedstock
- 9.1.1. Pet Coke
- 9.1.2. Coal
- 9.1.3. Natural Gas
- 9.1.4. Other Feedstock Types
- 9.2. Market Analysis, Insights and Forecast - by Technology
- 9.2.1. Steam Reforming
- 9.2.2. Gasification
- 9.3. Market Analysis, Insights and Forecast - by Gasifier Type
- 9.3.1. Fixed Bed
- 9.3.2. Entrained Flow
- 9.3.3. Fluidized Bed
- 9.4. Market Analysis, Insights and Forecast - by Application
- 9.4.1. Methanol
- 9.4.2. Ammonia
- 9.4.3. Hydrogen
- 9.4.4. Liquid Fuels
- 9.4.5. Direct Reduced Iron
- 9.4.6. Synthetic Natural Gas
- 9.4.7. Electricity
- 9.4.8. Other Applications
- 9.1. Market Analysis, Insights and Forecast - by Feedstock
- 10. South America Syngas Market Analysis, Insights and Forecast, 2020-2032
- 10.1. Market Analysis, Insights and Forecast - by Feedstock
- 10.1.1. Pet Coke
- 10.1.2. Coal
- 10.1.3. Natural Gas
- 10.1.4. Other Feedstock Types
- 10.2. Market Analysis, Insights and Forecast - by Technology
- 10.2.1. Steam Reforming
- 10.2.2. Gasification
- 10.3. Market Analysis, Insights and Forecast - by Gasifier Type
- 10.3.1. Fixed Bed
- 10.3.2. Entrained Flow
- 10.3.3. Fluidized Bed
- 10.4. Market Analysis, Insights and Forecast - by Application
- 10.4.1. Methanol
- 10.4.2. Ammonia
- 10.4.3. Hydrogen
- 10.4.4. Liquid Fuels
- 10.4.5. Direct Reduced Iron
- 10.4.6. Synthetic Natural Gas
- 10.4.7. Electricity
- 10.4.8. Other Applications
- 10.1. Market Analysis, Insights and Forecast - by Feedstock
- 11. Middle East and Africa Syngas Market Analysis, Insights and Forecast, 2020-2032
- 11.1. Market Analysis, Insights and Forecast - by Feedstock
- 11.1.1. Pet Coke
- 11.1.2. Coal
- 11.1.3. Natural Gas
- 11.1.4. Other Feedstock Types
- 11.2. Market Analysis, Insights and Forecast - by Technology
- 11.2.1. Steam Reforming
- 11.2.2. Gasification
- 11.3. Market Analysis, Insights and Forecast - by Gasifier Type
- 11.3.1. Fixed Bed
- 11.3.2. Entrained Flow
- 11.3.3. Fluidized Bed
- 11.4. Market Analysis, Insights and Forecast - by Application
- 11.4.1. Methanol
- 11.4.2. Ammonia
- 11.4.3. Hydrogen
- 11.4.4. Liquid Fuels
- 11.4.5. Direct Reduced Iron
- 11.4.6. Synthetic Natural Gas
- 11.4.7. Electricity
- 11.4.8. Other Applications
- 11.1. Market Analysis, Insights and Forecast - by Feedstock
- 12. Competitive Analysis
- 12.1. Company Profiles
- 12.1.1 A H T Syngas Technology NV
- 12.1.1.1. Company Overview
- 12.1.1.2. Products
- 12.1.1.3. Company Financials
- 12.1.1.4. SWOT Analysis
- 12.1.2 Linde PLC
- 12.1.2.1. Company Overview
- 12.1.2.2. Products
- 12.1.2.3. Company Financials
- 12.1.2.4. SWOT Analysis
- 12.1.3 Shell PLC
- 12.1.3.1. Company Overview
- 12.1.3.2. Products
- 12.1.3.3. Company Financials
- 12.1.3.4. SWOT Analysis
- 12.1.4 Air Products and Chemicals Inc
- 12.1.4.1. Company Overview
- 12.1.4.2. Products
- 12.1.4.3. Company Financials
- 12.1.4.4. SWOT Analysis
- 12.1.5 KBR Inc
- 12.1.5.1. Company Overview
- 12.1.5.2. Products
- 12.1.5.3. Company Financials
- 12.1.5.4. SWOT Analysis
- 12.1.6 Airpower Technologies Limited
- 12.1.6.1. Company Overview
- 12.1.6.2. Products
- 12.1.6.3. Company Financials
- 12.1.6.4. SWOT Analysis
- 12.1.7 Sasol
- 12.1.7.1. Company Overview
- 12.1.7.2. Products
- 12.1.7.3. Company Financials
- 12.1.7.4. SWOT Analysis
- 12.1.8 Technip Energies NV
- 12.1.8.1. Company Overview
- 12.1.8.2. Products
- 12.1.8.3. Company Financials
- 12.1.8.4. SWOT Analysis
- 12.1.9 Maire Tecnimont Spa
- 12.1.9.1. Company Overview
- 12.1.9.2. Products
- 12.1.9.3. Company Financials
- 12.1.9.4. SWOT Analysis
- 12.1.10 John Wood Group PLC
- 12.1.10.1. Company Overview
- 12.1.10.2. Products
- 12.1.10.3. Company Financials
- 12.1.10.4. SWOT Analysis
- 12.1.11 Topsoe AS*List Not Exhaustive
- 12.1.11.1. Company Overview
- 12.1.11.2. Products
- 12.1.11.3. Company Financials
- 12.1.11.4. SWOT Analysis
- 12.1.12 Air Liquide
- 12.1.12.1. Company Overview
- 12.1.12.2. Products
- 12.1.12.3. Company Financials
- 12.1.12.4. SWOT Analysis
- 12.1.1 A H T Syngas Technology NV
- 12.2. Market Entropy
- 12.2.1 Company's Key Areas Served
- 12.2.2 Recent Developments
- 12.3. Company Market Share Analysis 2025
- 12.3.1 Top 5 Companies Market Share Analysis
- 12.3.2 Top 3 Companies Market Share Analysis
- 12.4. List of Potential Customers
- 13. Research Methodology
List of Figures
- Figure 1: Global Syngas Market Revenue Breakdown (million, %) by Region 2025 & 2033
- Figure 2: Global Syngas Market Volume Breakdown (Million, %) by Region 2025 & 2033
- Figure 3: Asia Pacific Syngas Market Revenue (million), by Feedstock 2025 & 2033
- Figure 4: Asia Pacific Syngas Market Volume (Million), by Feedstock 2025 & 2033
- Figure 5: Asia Pacific Syngas Market Revenue Share (%), by Feedstock 2025 & 2033
- Figure 6: Asia Pacific Syngas Market Volume Share (%), by Feedstock 2025 & 2033
- Figure 7: Asia Pacific Syngas Market Revenue (million), by Technology 2025 & 2033
- Figure 8: Asia Pacific Syngas Market Volume (Million), by Technology 2025 & 2033
- Figure 9: Asia Pacific Syngas Market Revenue Share (%), by Technology 2025 & 2033
- Figure 10: Asia Pacific Syngas Market Volume Share (%), by Technology 2025 & 2033
- Figure 11: Asia Pacific Syngas Market Revenue (million), by Gasifier Type 2025 & 2033
- Figure 12: Asia Pacific Syngas Market Volume (Million), by Gasifier Type 2025 & 2033
- Figure 13: Asia Pacific Syngas Market Revenue Share (%), by Gasifier Type 2025 & 2033
- Figure 14: Asia Pacific Syngas Market Volume Share (%), by Gasifier Type 2025 & 2033
- Figure 15: Asia Pacific Syngas Market Revenue (million), by Application 2025 & 2033
- Figure 16: Asia Pacific Syngas Market Volume (Million), by Application 2025 & 2033
- Figure 17: Asia Pacific Syngas Market Revenue Share (%), by Application 2025 & 2033
- Figure 18: Asia Pacific Syngas Market Volume Share (%), by Application 2025 & 2033
- Figure 19: Asia Pacific Syngas Market Revenue (million), by Country 2025 & 2033
- Figure 20: Asia Pacific Syngas Market Volume (Million), by Country 2025 & 2033
- Figure 21: Asia Pacific Syngas Market Revenue Share (%), by Country 2025 & 2033
- Figure 22: Asia Pacific Syngas Market Volume Share (%), by Country 2025 & 2033
- Figure 23: North America Syngas Market Revenue (million), by Feedstock 2025 & 2033
- Figure 24: North America Syngas Market Volume (Million), by Feedstock 2025 & 2033
- Figure 25: North America Syngas Market Revenue Share (%), by Feedstock 2025 & 2033
- Figure 26: North America Syngas Market Volume Share (%), by Feedstock 2025 & 2033
- Figure 27: North America Syngas Market Revenue (million), by Technology 2025 & 2033
- Figure 28: North America Syngas Market Volume (Million), by Technology 2025 & 2033
- Figure 29: North America Syngas Market Revenue Share (%), by Technology 2025 & 2033
- Figure 30: North America Syngas Market Volume Share (%), by Technology 2025 & 2033
- Figure 31: North America Syngas Market Revenue (million), by Gasifier Type 2025 & 2033
- Figure 32: North America Syngas Market Volume (Million), by Gasifier Type 2025 & 2033
- Figure 33: North America Syngas Market Revenue Share (%), by Gasifier Type 2025 & 2033
- Figure 34: North America Syngas Market Volume Share (%), by Gasifier Type 2025 & 2033
- Figure 35: North America Syngas Market Revenue (million), by Application 2025 & 2033
- Figure 36: North America Syngas Market Volume (Million), by Application 2025 & 2033
- Figure 37: North America Syngas Market Revenue Share (%), by Application 2025 & 2033
- Figure 38: North America Syngas Market Volume Share (%), by Application 2025 & 2033
- Figure 39: North America Syngas Market Revenue (million), by Country 2025 & 2033
- Figure 40: North America Syngas Market Volume (Million), by Country 2025 & 2033
- Figure 41: North America Syngas Market Revenue Share (%), by Country 2025 & 2033
- Figure 42: North America Syngas Market Volume Share (%), by Country 2025 & 2033
- Figure 43: Europe Syngas Market Revenue (million), by Feedstock 2025 & 2033
- Figure 44: Europe Syngas Market Volume (Million), by Feedstock 2025 & 2033
- Figure 45: Europe Syngas Market Revenue Share (%), by Feedstock 2025 & 2033
- Figure 46: Europe Syngas Market Volume Share (%), by Feedstock 2025 & 2033
- Figure 47: Europe Syngas Market Revenue (million), by Technology 2025 & 2033
- Figure 48: Europe Syngas Market Volume (Million), by Technology 2025 & 2033
- Figure 49: Europe Syngas Market Revenue Share (%), by Technology 2025 & 2033
- Figure 50: Europe Syngas Market Volume Share (%), by Technology 2025 & 2033
- Figure 51: Europe Syngas Market Revenue (million), by Gasifier Type 2025 & 2033
- Figure 52: Europe Syngas Market Volume (Million), by Gasifier Type 2025 & 2033
- Figure 53: Europe Syngas Market Revenue Share (%), by Gasifier Type 2025 & 2033
- Figure 54: Europe Syngas Market Volume Share (%), by Gasifier Type 2025 & 2033
- Figure 55: Europe Syngas Market Revenue (million), by Application 2025 & 2033
- Figure 56: Europe Syngas Market Volume (Million), by Application 2025 & 2033
- Figure 57: Europe Syngas Market Revenue Share (%), by Application 2025 & 2033
- Figure 58: Europe Syngas Market Volume Share (%), by Application 2025 & 2033
- Figure 59: Europe Syngas Market Revenue (million), by Country 2025 & 2033
- Figure 60: Europe Syngas Market Volume (Million), by Country 2025 & 2033
- Figure 61: Europe Syngas Market Revenue Share (%), by Country 2025 & 2033
- Figure 62: Europe Syngas Market Volume Share (%), by Country 2025 & 2033
- Figure 63: South America Syngas Market Revenue (million), by Feedstock 2025 & 2033
- Figure 64: South America Syngas Market Volume (Million), by Feedstock 2025 & 2033
- Figure 65: South America Syngas Market Revenue Share (%), by Feedstock 2025 & 2033
- Figure 66: South America Syngas Market Volume Share (%), by Feedstock 2025 & 2033
- Figure 67: South America Syngas Market Revenue (million), by Technology 2025 & 2033
- Figure 68: South America Syngas Market Volume (Million), by Technology 2025 & 2033
- Figure 69: South America Syngas Market Revenue Share (%), by Technology 2025 & 2033
- Figure 70: South America Syngas Market Volume Share (%), by Technology 2025 & 2033
- Figure 71: South America Syngas Market Revenue (million), by Gasifier Type 2025 & 2033
- Figure 72: South America Syngas Market Volume (Million), by Gasifier Type 2025 & 2033
- Figure 73: South America Syngas Market Revenue Share (%), by Gasifier Type 2025 & 2033
- Figure 74: South America Syngas Market Volume Share (%), by Gasifier Type 2025 & 2033
- Figure 75: South America Syngas Market Revenue (million), by Application 2025 & 2033
- Figure 76: South America Syngas Market Volume (Million), by Application 2025 & 2033
- Figure 77: South America Syngas Market Revenue Share (%), by Application 2025 & 2033
- Figure 78: South America Syngas Market Volume Share (%), by Application 2025 & 2033
- Figure 79: South America Syngas Market Revenue (million), by Country 2025 & 2033
- Figure 80: South America Syngas Market Volume (Million), by Country 2025 & 2033
- Figure 81: South America Syngas Market Revenue Share (%), by Country 2025 & 2033
- Figure 82: South America Syngas Market Volume Share (%), by Country 2025 & 2033
- Figure 83: Middle East and Africa Syngas Market Revenue (million), by Feedstock 2025 & 2033
- Figure 84: Middle East and Africa Syngas Market Volume (Million), by Feedstock 2025 & 2033
- Figure 85: Middle East and Africa Syngas Market Revenue Share (%), by Feedstock 2025 & 2033
- Figure 86: Middle East and Africa Syngas Market Volume Share (%), by Feedstock 2025 & 2033
- Figure 87: Middle East and Africa Syngas Market Revenue (million), by Technology 2025 & 2033
- Figure 88: Middle East and Africa Syngas Market Volume (Million), by Technology 2025 & 2033
- Figure 89: Middle East and Africa Syngas Market Revenue Share (%), by Technology 2025 & 2033
- Figure 90: Middle East and Africa Syngas Market Volume Share (%), by Technology 2025 & 2033
- Figure 91: Middle East and Africa Syngas Market Revenue (million), by Gasifier Type 2025 & 2033
- Figure 92: Middle East and Africa Syngas Market Volume (Million), by Gasifier Type 2025 & 2033
- Figure 93: Middle East and Africa Syngas Market Revenue Share (%), by Gasifier Type 2025 & 2033
- Figure 94: Middle East and Africa Syngas Market Volume Share (%), by Gasifier Type 2025 & 2033
- Figure 95: Middle East and Africa Syngas Market Revenue (million), by Application 2025 & 2033
- Figure 96: Middle East and Africa Syngas Market Volume (Million), by Application 2025 & 2033
- Figure 97: Middle East and Africa Syngas Market Revenue Share (%), by Application 2025 & 2033
- Figure 98: Middle East and Africa Syngas Market Volume Share (%), by Application 2025 & 2033
- Figure 99: Middle East and Africa Syngas Market Revenue (million), by Country 2025 & 2033
- Figure 100: Middle East and Africa Syngas Market Volume (Million), by Country 2025 & 2033
- Figure 101: Middle East and Africa Syngas Market Revenue Share (%), by Country 2025 & 2033
- Figure 102: Middle East and Africa Syngas Market Volume Share (%), by Country 2025 & 2033
List of Tables
- Table 1: Global Syngas Market Revenue million Forecast, by Feedstock 2020 & 2033
- Table 2: Global Syngas Market Volume Million Forecast, by Feedstock 2020 & 2033
- Table 3: Global Syngas Market Revenue million Forecast, by Technology 2020 & 2033
- Table 4: Global Syngas Market Volume Million Forecast, by Technology 2020 & 2033
- Table 5: Global Syngas Market Revenue million Forecast, by Gasifier Type 2020 & 2033
- Table 6: Global Syngas Market Volume Million Forecast, by Gasifier Type 2020 & 2033
- Table 7: Global Syngas Market Revenue million Forecast, by Application 2020 & 2033
- Table 8: Global Syngas Market Volume Million Forecast, by Application 2020 & 2033
- Table 9: Global Syngas Market Revenue million Forecast, by Region 2020 & 2033
- Table 10: Global Syngas Market Volume Million Forecast, by Region 2020 & 2033
- Table 11: Global Syngas Market Revenue million Forecast, by Feedstock 2020 & 2033
- Table 12: Global Syngas Market Volume Million Forecast, by Feedstock 2020 & 2033
- Table 13: Global Syngas Market Revenue million Forecast, by Technology 2020 & 2033
- Table 14: Global Syngas Market Volume Million Forecast, by Technology 2020 & 2033
- Table 15: Global Syngas Market Revenue million Forecast, by Gasifier Type 2020 & 2033
- Table 16: Global Syngas Market Volume Million Forecast, by Gasifier Type 2020 & 2033
- Table 17: Global Syngas Market Revenue million Forecast, by Application 2020 & 2033
- Table 18: Global Syngas Market Volume Million Forecast, by Application 2020 & 2033
- Table 19: Global Syngas Market Revenue million Forecast, by Country 2020 & 2033
- Table 20: Global Syngas Market Volume Million Forecast, by Country 2020 & 2033
- Table 21: China Syngas Market Revenue (million) Forecast, by Application 2020 & 2033
- Table 22: China Syngas Market Volume (Million) Forecast, by Application 2020 & 2033
- Table 23: India Syngas Market Revenue (million) Forecast, by Application 2020 & 2033
- Table 24: India Syngas Market Volume (Million) Forecast, by Application 2020 & 2033
- Table 25: Rest of Asia Pacific Syngas Market Revenue (million) Forecast, by Application 2020 & 2033
- Table 26: Rest of Asia Pacific Syngas Market Volume (Million) Forecast, by Application 2020 & 2033
- Table 27: Global Syngas Market Revenue million Forecast, by Feedstock 2020 & 2033
- Table 28: Global Syngas Market Volume Million Forecast, by Feedstock 2020 & 2033
- Table 29: Global Syngas Market Revenue million Forecast, by Technology 2020 & 2033
- Table 30: Global Syngas Market Volume Million Forecast, by Technology 2020 & 2033
- Table 31: Global Syngas Market Revenue million Forecast, by Gasifier Type 2020 & 2033
- Table 32: Global Syngas Market Volume Million Forecast, by Gasifier Type 2020 & 2033
- Table 33: Global Syngas Market Revenue million Forecast, by Application 2020 & 2033
- Table 34: Global Syngas Market Volume Million Forecast, by Application 2020 & 2033
- Table 35: Global Syngas Market Revenue million Forecast, by Country 2020 & 2033
- Table 36: Global Syngas Market Volume Million Forecast, by Country 2020 & 2033
- Table 37: United States Syngas Market Revenue (million) Forecast, by Application 2020 & 2033
- Table 38: United States Syngas Market Volume (Million) Forecast, by Application 2020 & 2033
- Table 39: Canada Syngas Market Revenue (million) Forecast, by Application 2020 & 2033
- Table 40: Canada Syngas Market Volume (Million) Forecast, by Application 2020 & 2033
- Table 41: Trinidad and Tobago Syngas Market Revenue (million) Forecast, by Application 2020 & 2033
- Table 42: Trinidad and Tobago Syngas Market Volume (Million) Forecast, by Application 2020 & 2033
- Table 43: Global Syngas Market Revenue million Forecast, by Feedstock 2020 & 2033
- Table 44: Global Syngas Market Volume Million Forecast, by Feedstock 2020 & 2033
- Table 45: Global Syngas Market Revenue million Forecast, by Technology 2020 & 2033
- Table 46: Global Syngas Market Volume Million Forecast, by Technology 2020 & 2033
- Table 47: Global Syngas Market Revenue million Forecast, by Gasifier Type 2020 & 2033
- Table 48: Global Syngas Market Volume Million Forecast, by Gasifier Type 2020 & 2033
- Table 49: Global Syngas Market Revenue million Forecast, by Application 2020 & 2033
- Table 50: Global Syngas Market Volume Million Forecast, by Application 2020 & 2033
- Table 51: Global Syngas Market Revenue million Forecast, by Country 2020 & 2033
- Table 52: Global Syngas Market Volume Million Forecast, by Country 2020 & 2033
- Table 53: Russia Syngas Market Revenue (million) Forecast, by Application 2020 & 2033
- Table 54: Russia Syngas Market Volume (Million) Forecast, by Application 2020 & 2033
- Table 55: Rest of Europe Syngas Market Revenue (million) Forecast, by Application 2020 & 2033
- Table 56: Rest of Europe Syngas Market Volume (Million) Forecast, by Application 2020 & 2033
- Table 57: Global Syngas Market Revenue million Forecast, by Feedstock 2020 & 2033
- Table 58: Global Syngas Market Volume Million Forecast, by Feedstock 2020 & 2033
- Table 59: Global Syngas Market Revenue million Forecast, by Technology 2020 & 2033
- Table 60: Global Syngas Market Volume Million Forecast, by Technology 2020 & 2033
- Table 61: Global Syngas Market Revenue million Forecast, by Gasifier Type 2020 & 2033
- Table 62: Global Syngas Market Volume Million Forecast, by Gasifier Type 2020 & 2033
- Table 63: Global Syngas Market Revenue million Forecast, by Application 2020 & 2033
- Table 64: Global Syngas Market Volume Million Forecast, by Application 2020 & 2033
- Table 65: Global Syngas Market Revenue million Forecast, by Country 2020 & 2033
- Table 66: Global Syngas Market Volume Million Forecast, by Country 2020 & 2033
- Table 67: Venezuela Syngas Market Revenue (million) Forecast, by Application 2020 & 2033
- Table 68: Venezuela Syngas Market Volume (Million) Forecast, by Application 2020 & 2033
- Table 69: Brazil Syngas Market Revenue (million) Forecast, by Application 2020 & 2033
- Table 70: Brazil Syngas Market Volume (Million) Forecast, by Application 2020 & 2033
- Table 71: Rest of South America Syngas Market Revenue (million) Forecast, by Application 2020 & 2033
- Table 72: Rest of South America Syngas Market Volume (Million) Forecast, by Application 2020 & 2033
- Table 73: Global Syngas Market Revenue million Forecast, by Feedstock 2020 & 2033
- Table 74: Global Syngas Market Volume Million Forecast, by Feedstock 2020 & 2033
- Table 75: Global Syngas Market Revenue million Forecast, by Technology 2020 & 2033
- Table 76: Global Syngas Market Volume Million Forecast, by Technology 2020 & 2033
- Table 77: Global Syngas Market Revenue million Forecast, by Gasifier Type 2020 & 2033
- Table 78: Global Syngas Market Volume Million Forecast, by Gasifier Type 2020 & 2033
- Table 79: Global Syngas Market Revenue million Forecast, by Application 2020 & 2033
- Table 80: Global Syngas Market Volume Million Forecast, by Application 2020 & 2033
- Table 81: Global Syngas Market Revenue million Forecast, by Country 2020 & 2033
- Table 82: Global Syngas Market Volume Million Forecast, by Country 2020 & 2033
- Table 83: Saudi Arabia Syngas Market Revenue (million) Forecast, by Application 2020 & 2033
- Table 84: Saudi Arabia Syngas Market Volume (Million) Forecast, by Application 2020 & 2033
- Table 85: Qatar Syngas Market Revenue (million) Forecast, by Application 2020 & 2033
- Table 86: Qatar Syngas Market Volume (Million) Forecast, by Application 2020 & 2033
- Table 87: South Africa Syngas Market Revenue (million) Forecast, by Application 2020 & 2033
- Table 88: South Africa Syngas Market Volume (Million) Forecast, by Application 2020 & 2033
- Table 89: Iran Syngas Market Revenue (million) Forecast, by Application 2020 & 2033
- Table 90: Iran Syngas Market Volume (Million) Forecast, by Application 2020 & 2033
- Table 91: Rest of Middle East and Africa Syngas Market Revenue (million) Forecast, by Application 2020 & 2033
- Table 92: Rest of Middle East and Africa Syngas Market Volume (Million) Forecast, by Application 2020 & 2033
Frequently Asked Questions
1. What is the projected Compound Annual Growth Rate (CAGR) of the Syngas Market?
The projected CAGR is approximately 11.3%.
2. Which companies are prominent players in the Syngas Market?
Key companies in the market include A H T Syngas Technology NV, Linde PLC, Shell PLC, Air Products and Chemicals Inc, KBR Inc, Airpower Technologies Limited, Sasol, Technip Energies NV, Maire Tecnimont Spa, John Wood Group PLC, Topsoe AS*List Not Exhaustive, Air Liquide.
3. What are the main segments of the Syngas Market?
The market segments include Feedstock, Technology, Gasifier Type, Application.
4. Can you provide details about the market size?
The market size is estimated to be USD 477.97 million as of 2022.
5. What are some drivers contributing to market growth?
Growing Demand in the Electricity and Chemical Industry; Increasing Environmental Awareness and Government Regulations on the Use of Renewable Fuel; Increasing Hydrogen Demand for Fertilizers.
6. What are the notable trends driving market growth?
Ammonia Segment to Dominate the Market.
7. Are there any restraints impacting market growth?
High Capital Investment and Funding.
8. Can you provide examples of recent developments in the market?
July 2022: Maire Tecnimont SpA announced that NextChem was awarded a contract by Storengy to study waste wood and solid recovered fuel conversion plant to produce biomethane in France. NextChem is expected to be responsible for the engineering services and cost estimating for the syngas purification, methanation unit, and methane upgrading.
9. What pricing options are available for accessing the report?
Pricing options include single-user, multi-user, and enterprise licenses priced at USD 4750, USD 5250, and USD 8750 respectively.
10. Is the market size provided in terms of value or volume?
The market size is provided in terms of value, measured in million and volume, measured in Million.
11. Are there any specific market keywords associated with the report?
Yes, the market keyword associated with the report is "Syngas Market," which aids in identifying and referencing the specific market segment covered.
12. How do I determine which pricing option suits my needs best?
The pricing options vary based on user requirements and access needs. Individual users may opt for single-user licenses, while businesses requiring broader access may choose multi-user or enterprise licenses for cost-effective access to the report.
13. Are there any additional resources or data provided in the Syngas Market report?
While the report offers comprehensive insights, it's advisable to review the specific contents or supplementary materials provided to ascertain if additional resources or data are available.
14. How can I stay updated on further developments or reports in the Syngas Market?
To stay informed about further developments, trends, and reports in the Syngas Market, consider subscribing to industry newsletters, following relevant companies and organizations, or regularly checking reputable industry news sources and publications.
Methodology
Step 1 - Identification of Relevant Samples Size from Population Database


Step 2 - Approaches for Defining Global Market Size (Value, Volume* & Price*)

Note*: In applicable scenarios
Step 3 - Data Sources
Primary Research
- Web Analytics
- Survey Reports
- Research Institute
- Latest Research Reports
- Opinion Leaders
Secondary Research
- Annual Reports
- White Paper
- Latest Press Release
- Industry Association
- Paid Database
- Investor Presentations

Step 4 - Data Triangulation
Involves using different sources of information in order to increase the validity of a study
These sources are likely to be stakeholders in a program - participants, other researchers, program staff, other community members, and so on.
Then we put all data in single framework & apply various statistical tools to find out the dynamic on the market.
During the analysis stage, feedback from the stakeholder groups would be compared to determine areas of agreement as well as areas of divergence