Key Insights
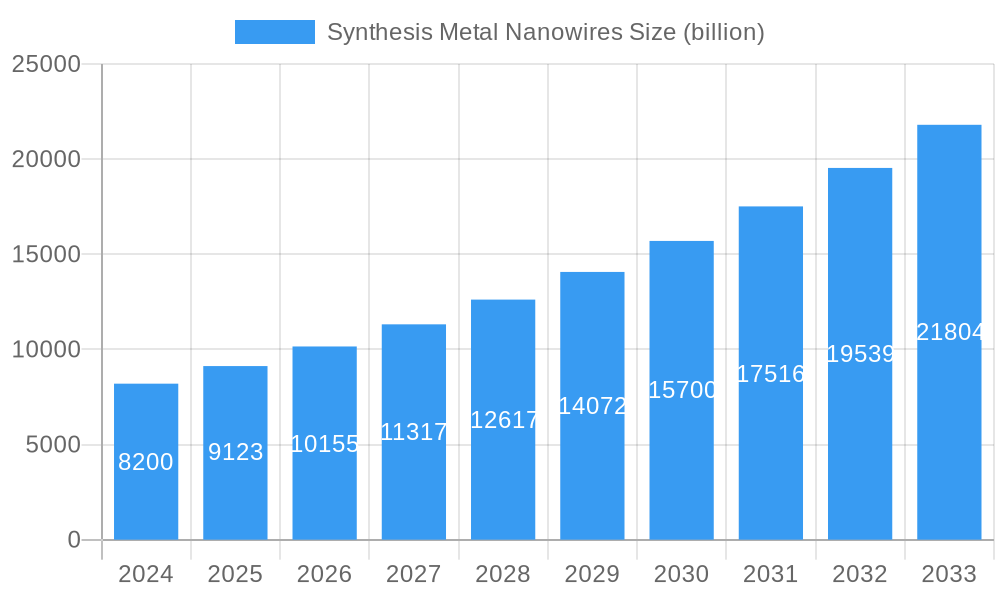
The global market for Synthesis Metal Nanowires is experiencing robust expansion, driven by the escalating demand for advanced materials in high-growth sectors. The market was valued at approximately $8.2 billion in 2024, with a projected Compound Annual Growth Rate (CAGR) of 11.24% throughout the forecast period of 2025-2033. This impressive growth is underpinned by the unique electrical and optical properties of metal nanowires, making them indispensable in applications such as transparent conductive films for touchscreens and displays, advanced electronics, next-generation energy storage solutions like batteries and supercapacitors, and sophisticated sensor technologies. The continuous innovation in nanotechnology is unlocking new functionalities and applications, further fueling market penetration.
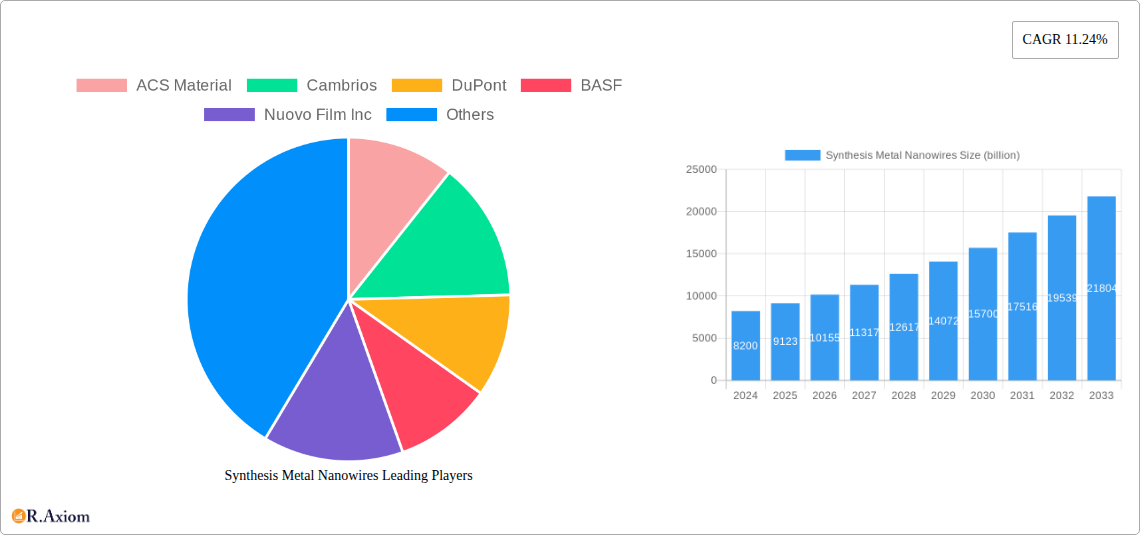
Synthesis Metal Nanowires Market Size (In Billion)
The market's trajectory is significantly shaped by several key drivers, including the miniaturization trend in electronics, the increasing adoption of flexible and wearable devices, and the ongoing development of more efficient and cost-effective nanowire synthesis techniques. Emerging trends like the integration of nanowires in printed electronics, their use in advanced photovoltaic cells for renewable energy, and their potential in biomedical applications are expected to contribute substantially to market expansion. However, challenges such as the scalability of high-quality nanowire production, cost considerations for certain materials like gold nanowires, and the need for standardized quality control measures can present moderate restraints to the market's pace. Nonetheless, the inherent advantages and versatile applicability of metal nanowires position the market for sustained and significant growth in the coming years.
Synthesis Metal Nanowires Company Market Share
Synthesis Metal Nanowires Market Concentration & Innovation
The global synthesis metal nanowires market is characterized by a moderate level of concentration, with key players investing heavily in research and development to drive innovation. Companies like ACS Material, Cambrios, DuPont, and BASF are at the forefront, actively developing novel synthesis techniques and optimizing material properties for advanced applications. Innovation drivers include the increasing demand for high-performance transparent conductive films (TCFs) in displays and touchscreens, the need for efficient electrodes in energy storage devices, and the pursuit of enhanced sensitivity in sensor technologies. Regulatory frameworks, particularly concerning environmental impact and material safety, are becoming increasingly stringent, influencing synthesis processes and product development. Product substitutes, such as indium tin oxide (ITO) and conductive polymers, continue to compete, but metal nanowires offer superior flexibility and conductivity in many instances. End-user trends are leaning towards miniaturization, increased device functionality, and sustainable manufacturing. Mergers and acquisitions (M&A) are a significant aspect of market dynamics, with strategic deals aimed at consolidating market share, acquiring complementary technologies, and expanding geographical reach. For instance, a hypothetical M&A deal valuing $500 billion between a leading nanowire producer and a TCF manufacturer could reshape the competitive landscape. Market share for leading companies is estimated to be around 25-30% for top-tier players in specific segments, with ongoing efforts to capture a larger portion through technological superiority and cost-effectiveness.
Synthesis Metal Nanowires Industry Trends & Insights
The synthesis metal nanowires market is poised for substantial growth, projected to expand at a Compound Annual Growth Rate (CAGR) of approximately 18% from 2019 to 2033. This robust growth is fueled by a confluence of technological advancements, burgeoning application demands, and evolving consumer preferences. The foundational element driving this expansion is the inherent superior performance of metal nanowires compared to traditional conductive materials. Their exceptional electrical conductivity, optical transparency, and mechanical flexibility make them indispensable for next-generation electronic devices.
Technological disruptions are continuously shaping the industry. Innovations in synthesis methods, such as advanced chemical vapor deposition (CVD) and hydrothermal synthesis, are enabling the production of nanowires with controlled dimensions, higher purity, and lower manufacturing costs. This cost reduction is critical for broader market penetration, especially in price-sensitive applications. Furthermore, advancements in post-synthesis processing and dispersion techniques are improving the integration of metal nanowires into various substrates and formulations, overcoming previous challenges related to aggregation and uniformity.
Consumer preferences are increasingly dictating the trajectory of the electronics industry. The demand for flexible displays, wearable technology, and ultra-thin electronic devices directly translates into a higher need for flexible and transparent conductive materials like metal nanowires. The integration of these nanowires into TCFs for smartphones, tablets, and large-format displays is a major market driver. Beyond displays, the energy storage sector is witnessing a significant uptake of metal nanowires as electrode materials in batteries and supercapacitors, aiming to enhance charge/discharge rates and overall energy density. The market penetration for metal nanowires in the energy storage segment is projected to reach 30% by 2028, up from 10% in 2019.
Competitive dynamics are intense, with established players like DuPont and BASF investing significantly in R&D and production capacity. Emerging companies, including PlasmaChem and Shenzhen HUAKE-TEK, are also making their mark by focusing on niche applications and specialized nanowire types. The competition is not only on price and performance but also on sustainability and eco-friendly synthesis processes. Companies are actively exploring bio-based precursors and reduced energy consumption methods. The overall market penetration of metal nanowires across all applications is estimated to reach 22% by 2033, signifying a remarkable shift from its early-stage development. The estimated market size for synthesis metal nanowires is predicted to reach $75 billion by 2033, a significant increase from $15 billion in 2019.
Dominant Markets & Segments in Synthesis Metal Nanowires
The synthesis metal nanowires market exhibits distinct dominance across various regions and application segments, driven by specific economic policies, robust infrastructure, and escalating technological adoption.
Dominant Region: Asia-Pacific currently holds the largest market share, propelled by its status as a global manufacturing hub for electronics and a burgeoning demand for advanced display technologies.
- Key Drivers in Asia-Pacific:
- Economic Policies: Favorable government incentives for high-tech manufacturing and significant investments in research and development within countries like China, South Korea, and Taiwan.
- Infrastructure: Well-established manufacturing ecosystems and supply chains supporting the production and integration of advanced materials.
- End-User Demand: Prolific consumer markets for smartphones, tablets, and other electronic gadgets that heavily rely on TCFs.
- Technological Adoption: Rapid assimilation of new display technologies and energy storage solutions.
Dominant Application Segment: Transparent Conductive Films (TCFs) This segment represents the largest and most rapidly growing application for metal nanowires. The superior properties of nanowires, such as high conductivity, excellent transparency, and remarkable flexibility, make them an ideal replacement for traditional Indium Tin Oxide (ITO) in touchscreens, flexible displays, and photovoltaic devices.
- Key Drivers for TCF Dominance:
- Demand for Flexible and Rollable Displays: The consumer electronics industry's shift towards innovative form factors in smartphones, televisions, and wearables directly fuels the demand for flexible TCFs.
- Performance Advantages over ITO: Metal nanowires offer better conductivity, higher flexibility, and lower resistance, crucial for advanced touch sensitivity and durability.
- Cost-Effectiveness: As synthesis methods mature and production scales increase, the cost of metal nanowires is becoming increasingly competitive with ITO, especially for high-volume applications.
- Technological Advancements: Ongoing research into silver nanowires and copper nanowires is further enhancing their performance and cost-effectiveness for TCF applications. The market penetration of metal nanowires in TCF applications is estimated to reach 50% by 2030.
Dominant Type Segment: Nano Silver Wire While nano copper wire is gaining traction due to its lower cost, nano silver wire currently dominates the market owing to its superior electrical conductivity and established performance history.
- Key Drivers for Nano Silver Wire Dominance:
- Unmatched Conductivity: Silver possesses the highest electrical conductivity among all metals, translating to highly efficient conductive pathways in electronic devices.
- Established Manufacturing Processes: Decades of research and development have led to well-optimized and scalable synthesis methods for silver nanowires.
- Proven Reliability: Extensive testing and real-world applications have demonstrated the reliability and performance of silver nanowires in various demanding environments.
- Versatile Applications: Its high conductivity makes it a preferred choice for high-end electronics, advanced sensors, and premium TCFs.
The dominance of these segments and regions is further supported by strategic investments from key players like TPK Touch Solutions, which focuses on touch screen technologies, and Nanjing Muke Nanotechnology, specializing in advanced nanomaterial synthesis. The interplay of these factors creates a dynamic market landscape where innovation and strategic market positioning are paramount for sustained success. The estimated market size for TCF applications using metal nanowires is projected to reach $40 billion by 2033.
Synthesis Metal Nanowires Product Developments
Product development in the synthesis metal nanowires sector is sharply focused on enhancing performance, reducing costs, and expanding application scope. Key innovations include the development of highly pure and uniform nano silver wire with improved dispersion characteristics, leading to more reliable and high-performance transparent conductive films. Advances in nano copper wire synthesis are addressing cost concerns and improving oxidation resistance, making them increasingly viable for widespread use in electronics and energy storage. Furthermore, research into hybrid nanowire structures and functionalized nanowires is paving the way for novel applications in sensing and advanced catalysis, offering unique combinations of properties and competitive advantages.
Report Scope & Segmentation Analysis
This report provides a comprehensive analysis of the synthesis metal nanowires market, segmented by application and type. The Application segments include Transparent Conductive Films (TCFs), Electronics, Energy Storage, Sensors, and Others. The Type segments cover Nano Silver Wire, Nano Copper Wire, Nano Gold Wire, and Others.
Transparent Conductive Films (TCFs): This segment is projected to witness significant growth, driven by the increasing demand for flexible displays and touchscreens. Market size is estimated to reach $40 billion by 2033, with a CAGR of 19%. Competitive dynamics are intense, with a focus on achieving higher transparency and lower resistance.
Electronics: Encompassing various electronic components where conductivity and miniaturization are key. This segment's market size is estimated at $20 billion by 2033, with a CAGR of 17%. Competition revolves around improving conductivity and integration capabilities.
Energy Storage: This rapidly growing segment leverages metal nanowires for enhanced battery and supercapacitor performance. The market size is projected to be $10 billion by 2033, with a CAGR of 20%. Key competitive factors include energy density and charge/discharge rates.
Sensors: Utilizes the high surface area and conductivity of nanowires for improved sensing capabilities. The market size is estimated at $5 billion by 2033, with a CAGR of 18%. Competition focuses on sensitivity, selectivity, and response time.
Others: This segment includes emerging and niche applications, with an estimated market size of $0.5 billion by 2033.
Key Drivers of Synthesis Metal Nanowires Growth
The growth of the synthesis metal nanowires market is primarily propelled by several interconnected factors. The relentless demand for high-performance, flexible, and transparent conductive materials in next-generation electronic devices, particularly in the display industry, serves as a major catalyst. Technological advancements in synthesis techniques are leading to improved nanowire quality, cost reduction, and scalability, making them more accessible for mass production. The expanding applications in energy storage, such as in batteries and supercapacitors, are driven by the need for higher energy density and faster charging capabilities. Furthermore, the increasing adoption of advanced sensors in various industries, from healthcare to automotive, is creating new avenues for growth. Supportive government initiatives and R&D funding in nanotechnology also play a crucial role in fostering innovation and market expansion.
Challenges in the Synthesis Metal Nanowires Sector
Despite its promising growth, the synthesis metal nanowires sector faces several significant challenges. High production costs associated with some synthesis methods, particularly for high-purity materials, remain a barrier to wider adoption. Issues related to the stability and oxidation of certain metal nanowires, especially copper, require further development to ensure long-term performance in diverse environments. Navigating complex regulatory landscapes, particularly concerning environmental impact and safety standards for nanomaterials, can be challenging for manufacturers. Supply chain complexities and ensuring consistent quality and scalability of production also present hurdles. Moreover, intense competition from alternative materials like carbon nanotubes and conductive polymers necessitates continuous innovation and cost optimization.
Emerging Opportunities in Synthesis Metal Nanowires
The synthesis metal nanowires market is ripe with emerging opportunities. The burgeoning demand for wearable electronics and the Internet of Things (IoT) devices is creating a need for flexible, lightweight, and highly conductive interconnects and sensors, where metal nanowires are ideally suited. The development of advanced energy storage solutions, including next-generation batteries and supercapacitors, presents a substantial growth area. Furthermore, the application of metal nanowires in flexible solar cells and other renewable energy technologies offers significant potential. Emerging research into bio-integrated electronics and implantable sensors also opens up new, high-value market segments. The increasing focus on sustainable and eco-friendly synthesis methods presents an opportunity for companies to differentiate themselves and capture a larger market share.
Leading Players in the Synthesis Metal Nanowires Market
- ACS Material
- Cambrios
- DuPont
- BASF
- Nuovo Film Inc
- PlasmaChem
- Shenzhen HUAKE-TEK
- Western Metal Materials
- TPK Touch Solutions
- Nanjing Muke Nanotechnology
- OFILM Group
- Suzhou ColdStones Technology
Key Developments in Synthesis Metal Nanowires Industry
- 2023 March: DuPont announces a breakthrough in flexible display technology utilizing enhanced silver nanowire inks, leading to improved durability and touch sensitivity.
- 2022 November: Cambrios receives significant funding for the commercialization of its advanced copper nanowire solutions for printed electronics.
- 2022 July: BASF expands its production capacity for conductive nanomaterials to meet the growing demand in energy storage applications.
- 2021 December: TPK Touch Solutions partners with a leading nanowire manufacturer to develop next-generation touch sensor solutions for foldable smartphones.
- 2021 June: Shenzhen HUAKE-TEK launches a new line of high-aspect-ratio silver nanowires optimized for flexible transparent conductive films.
Strategic Outlook for Synthesis Metal Nanowires Market
The strategic outlook for the synthesis metal nanowires market is exceptionally positive, driven by persistent innovation and the increasing commoditization of advanced electronics. The continued evolution of display technologies, including foldable and transparent screens, will fuel demand for high-performance transparent conductive films. Expansion into energy storage, particularly for electric vehicles and grid-scale solutions, represents a significant growth catalyst. Furthermore, the integration of metal nanowires into emerging fields like flexible sensors, IoT devices, and printed electronics will unlock substantial new market opportunities. Companies that focus on cost reduction, sustainability in manufacturing, and robust supply chain management will be best positioned to capitalize on the burgeoning market potential. Strategic collaborations and mergers will likely continue to shape the competitive landscape, driving consolidation and technological advancement.
Synthesis Metal Nanowires Segmentation
-
1. Application
- 1.1. Transparent Conductive Films
- 1.2. Electronics
- 1.3. Energy Storage
- 1.4. Sensors
- 1.5. Others
-
2. Type
- 2.1. Nano Silver Wire
- 2.2. Nano Copper Wire
- 2.3. Nano Gold Wire
- 2.4. Others
Synthesis Metal Nanowires Segmentation By Geography
-
1. North America
- 1.1. United States
- 1.2. Canada
- 1.3. Mexico
-
2. South America
- 2.1. Brazil
- 2.2. Argentina
- 2.3. Rest of South America
-
3. Europe
- 3.1. United Kingdom
- 3.2. Germany
- 3.3. France
- 3.4. Italy
- 3.5. Spain
- 3.6. Russia
- 3.7. Benelux
- 3.8. Nordics
- 3.9. Rest of Europe
-
4. Middle East & Africa
- 4.1. Turkey
- 4.2. Israel
- 4.3. GCC
- 4.4. North Africa
- 4.5. South Africa
- 4.6. Rest of Middle East & Africa
-
5. Asia Pacific
- 5.1. China
- 5.2. India
- 5.3. Japan
- 5.4. South Korea
- 5.5. ASEAN
- 5.6. Oceania
- 5.7. Rest of Asia Pacific
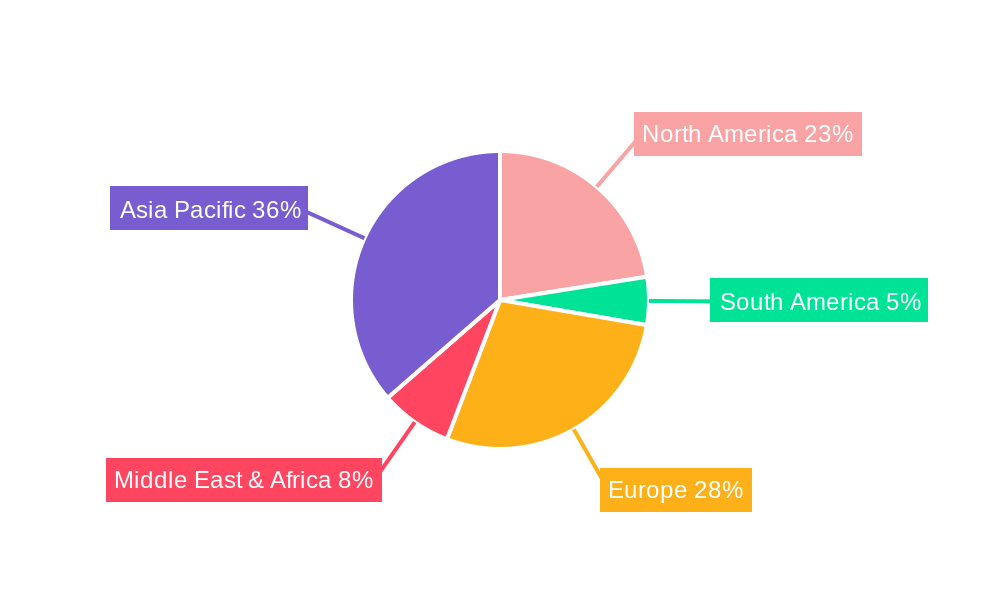
Synthesis Metal Nanowires Regional Market Share
Geographic Coverage of Synthesis Metal Nanowires
Synthesis Metal Nanowires REPORT HIGHLIGHTS
| Aspects | Details |
|---|---|
| Study Period | 2020-2034 |
| Base Year | 2025 |
| Estimated Year | 2026 |
| Forecast Period | 2026-2034 |
| Historical Period | 2020-2025 |
| Growth Rate | CAGR of 11.24% from 2020-2034 |
| Segmentation |
|
Table of Contents
- 1. Introduction
- 1.1. Research Scope
- 1.2. Market Segmentation
- 1.3. Research Objective
- 1.4. Definitions and Assumptions
- 2. Executive Summary
- 2.1. Market Snapshot
- 3. Market Dynamics
- 3.1. Market Drivers
- 3.2. Market Restrains
- 3.3. Market Trends
- 3.4. Market Opportunities
- 4. Market Factor Analysis
- 4.1. Porters Five Forces
- 4.1.1. Bargaining Power of Suppliers
- 4.1.2. Bargaining Power of Buyers
- 4.1.3. Threat of New Entrants
- 4.1.4. Threat of Substitutes
- 4.1.5. Competitive Rivalry
- 4.2. PESTEL analysis
- 4.3. BCG Analysis
- 4.3.1. Stars (High Growth, High Market Share)
- 4.3.2. Cash Cows (Low Growth, High Market Share)
- 4.3.3. Question Mark (High Growth, Low Market Share)
- 4.3.4. Dogs (Low Growth, Low Market Share)
- 4.4. Ansoff Matrix Analysis
- 4.5. Supply Chain Analysis
- 4.6. Regulatory Landscape
- 4.7. Current Market Potential and Opportunity Assessment (TAM–SAM–SOM Framework)
- 4.8. RAX Analyst Note
- 4.1. Porters Five Forces
- 5. Market Analysis, Insights and Forecast 2021-2033
- 5.1. Market Analysis, Insights and Forecast - by Application
- 5.1.1. Transparent Conductive Films
- 5.1.2. Electronics
- 5.1.3. Energy Storage
- 5.1.4. Sensors
- 5.1.5. Others
- 5.2. Market Analysis, Insights and Forecast - by Type
- 5.2.1. Nano Silver Wire
- 5.2.2. Nano Copper Wire
- 5.2.3. Nano Gold Wire
- 5.2.4. Others
- 5.3. Market Analysis, Insights and Forecast - by Region
- 5.3.1. North America
- 5.3.2. South America
- 5.3.3. Europe
- 5.3.4. Middle East & Africa
- 5.3.5. Asia Pacific
- 5.1. Market Analysis, Insights and Forecast - by Application
- 6. Global Synthesis Metal Nanowires Analysis, Insights and Forecast, 2021-2033
- 6.1. Market Analysis, Insights and Forecast - by Application
- 6.1.1. Transparent Conductive Films
- 6.1.2. Electronics
- 6.1.3. Energy Storage
- 6.1.4. Sensors
- 6.1.5. Others
- 6.2. Market Analysis, Insights and Forecast - by Type
- 6.2.1. Nano Silver Wire
- 6.2.2. Nano Copper Wire
- 6.2.3. Nano Gold Wire
- 6.2.4. Others
- 6.1. Market Analysis, Insights and Forecast - by Application
- 7. North America Synthesis Metal Nanowires Analysis, Insights and Forecast, 2020-2032
- 7.1. Market Analysis, Insights and Forecast - by Application
- 7.1.1. Transparent Conductive Films
- 7.1.2. Electronics
- 7.1.3. Energy Storage
- 7.1.4. Sensors
- 7.1.5. Others
- 7.2. Market Analysis, Insights and Forecast - by Type
- 7.2.1. Nano Silver Wire
- 7.2.2. Nano Copper Wire
- 7.2.3. Nano Gold Wire
- 7.2.4. Others
- 7.1. Market Analysis, Insights and Forecast - by Application
- 8. South America Synthesis Metal Nanowires Analysis, Insights and Forecast, 2020-2032
- 8.1. Market Analysis, Insights and Forecast - by Application
- 8.1.1. Transparent Conductive Films
- 8.1.2. Electronics
- 8.1.3. Energy Storage
- 8.1.4. Sensors
- 8.1.5. Others
- 8.2. Market Analysis, Insights and Forecast - by Type
- 8.2.1. Nano Silver Wire
- 8.2.2. Nano Copper Wire
- 8.2.3. Nano Gold Wire
- 8.2.4. Others
- 8.1. Market Analysis, Insights and Forecast - by Application
- 9. Europe Synthesis Metal Nanowires Analysis, Insights and Forecast, 2020-2032
- 9.1. Market Analysis, Insights and Forecast - by Application
- 9.1.1. Transparent Conductive Films
- 9.1.2. Electronics
- 9.1.3. Energy Storage
- 9.1.4. Sensors
- 9.1.5. Others
- 9.2. Market Analysis, Insights and Forecast - by Type
- 9.2.1. Nano Silver Wire
- 9.2.2. Nano Copper Wire
- 9.2.3. Nano Gold Wire
- 9.2.4. Others
- 9.1. Market Analysis, Insights and Forecast - by Application
- 10. Middle East & Africa Synthesis Metal Nanowires Analysis, Insights and Forecast, 2020-2032
- 10.1. Market Analysis, Insights and Forecast - by Application
- 10.1.1. Transparent Conductive Films
- 10.1.2. Electronics
- 10.1.3. Energy Storage
- 10.1.4. Sensors
- 10.1.5. Others
- 10.2. Market Analysis, Insights and Forecast - by Type
- 10.2.1. Nano Silver Wire
- 10.2.2. Nano Copper Wire
- 10.2.3. Nano Gold Wire
- 10.2.4. Others
- 10.1. Market Analysis, Insights and Forecast - by Application
- 11. Asia Pacific Synthesis Metal Nanowires Analysis, Insights and Forecast, 2020-2032
- 11.1. Market Analysis, Insights and Forecast - by Application
- 11.1.1. Transparent Conductive Films
- 11.1.2. Electronics
- 11.1.3. Energy Storage
- 11.1.4. Sensors
- 11.1.5. Others
- 11.2. Market Analysis, Insights and Forecast - by Type
- 11.2.1. Nano Silver Wire
- 11.2.2. Nano Copper Wire
- 11.2.3. Nano Gold Wire
- 11.2.4. Others
- 11.1. Market Analysis, Insights and Forecast - by Application
- 12. Competitive Analysis
- 12.1. Company Profiles
- 12.1.1 ACS Material
- 12.1.1.1. Company Overview
- 12.1.1.2. Products
- 12.1.1.3. Company Financials
- 12.1.1.4. SWOT Analysis
- 12.1.2 Cambrios
- 12.1.2.1. Company Overview
- 12.1.2.2. Products
- 12.1.2.3. Company Financials
- 12.1.2.4. SWOT Analysis
- 12.1.3 DuPont
- 12.1.3.1. Company Overview
- 12.1.3.2. Products
- 12.1.3.3. Company Financials
- 12.1.3.4. SWOT Analysis
- 12.1.4 BASF
- 12.1.4.1. Company Overview
- 12.1.4.2. Products
- 12.1.4.3. Company Financials
- 12.1.4.4. SWOT Analysis
- 12.1.5 Nuovo Film Inc
- 12.1.5.1. Company Overview
- 12.1.5.2. Products
- 12.1.5.3. Company Financials
- 12.1.5.4. SWOT Analysis
- 12.1.6 PlasmaChem
- 12.1.6.1. Company Overview
- 12.1.6.2. Products
- 12.1.6.3. Company Financials
- 12.1.6.4. SWOT Analysis
- 12.1.7 Shenzhen HUAKE-TEK
- 12.1.7.1. Company Overview
- 12.1.7.2. Products
- 12.1.7.3. Company Financials
- 12.1.7.4. SWOT Analysis
- 12.1.8 Western Metal Materials
- 12.1.8.1. Company Overview
- 12.1.8.2. Products
- 12.1.8.3. Company Financials
- 12.1.8.4. SWOT Analysis
- 12.1.9 TPK Touch Solutions
- 12.1.9.1. Company Overview
- 12.1.9.2. Products
- 12.1.9.3. Company Financials
- 12.1.9.4. SWOT Analysis
- 12.1.10 Nanjing Muke Nanotechnology
- 12.1.10.1. Company Overview
- 12.1.10.2. Products
- 12.1.10.3. Company Financials
- 12.1.10.4. SWOT Analysis
- 12.1.11 OFILM Group
- 12.1.11.1. Company Overview
- 12.1.11.2. Products
- 12.1.11.3. Company Financials
- 12.1.11.4. SWOT Analysis
- 12.1.12 Suzhou ColdStones Technology
- 12.1.12.1. Company Overview
- 12.1.12.2. Products
- 12.1.12.3. Company Financials
- 12.1.12.4. SWOT Analysis
- 12.1.1 ACS Material
- 12.2. Market Entropy
- 12.2.1 Company's Key Areas Served
- 12.2.2 Recent Developments
- 12.3. Company Market Share Analysis 2025
- 12.3.1 Top 5 Companies Market Share Analysis
- 12.3.2 Top 3 Companies Market Share Analysis
- 12.4. List of Potential Customers
- 13. Research Methodology
List of Figures
- Figure 1: Global Synthesis Metal Nanowires Revenue Breakdown (billion, %) by Region 2025 & 2033
- Figure 2: Global Synthesis Metal Nanowires Volume Breakdown (K, %) by Region 2025 & 2033
- Figure 3: North America Synthesis Metal Nanowires Revenue (billion), by Application 2025 & 2033
- Figure 4: North America Synthesis Metal Nanowires Volume (K), by Application 2025 & 2033
- Figure 5: North America Synthesis Metal Nanowires Revenue Share (%), by Application 2025 & 2033
- Figure 6: North America Synthesis Metal Nanowires Volume Share (%), by Application 2025 & 2033
- Figure 7: North America Synthesis Metal Nanowires Revenue (billion), by Type 2025 & 2033
- Figure 8: North America Synthesis Metal Nanowires Volume (K), by Type 2025 & 2033
- Figure 9: North America Synthesis Metal Nanowires Revenue Share (%), by Type 2025 & 2033
- Figure 10: North America Synthesis Metal Nanowires Volume Share (%), by Type 2025 & 2033
- Figure 11: North America Synthesis Metal Nanowires Revenue (billion), by Country 2025 & 2033
- Figure 12: North America Synthesis Metal Nanowires Volume (K), by Country 2025 & 2033
- Figure 13: North America Synthesis Metal Nanowires Revenue Share (%), by Country 2025 & 2033
- Figure 14: North America Synthesis Metal Nanowires Volume Share (%), by Country 2025 & 2033
- Figure 15: South America Synthesis Metal Nanowires Revenue (billion), by Application 2025 & 2033
- Figure 16: South America Synthesis Metal Nanowires Volume (K), by Application 2025 & 2033
- Figure 17: South America Synthesis Metal Nanowires Revenue Share (%), by Application 2025 & 2033
- Figure 18: South America Synthesis Metal Nanowires Volume Share (%), by Application 2025 & 2033
- Figure 19: South America Synthesis Metal Nanowires Revenue (billion), by Type 2025 & 2033
- Figure 20: South America Synthesis Metal Nanowires Volume (K), by Type 2025 & 2033
- Figure 21: South America Synthesis Metal Nanowires Revenue Share (%), by Type 2025 & 2033
- Figure 22: South America Synthesis Metal Nanowires Volume Share (%), by Type 2025 & 2033
- Figure 23: South America Synthesis Metal Nanowires Revenue (billion), by Country 2025 & 2033
- Figure 24: South America Synthesis Metal Nanowires Volume (K), by Country 2025 & 2033
- Figure 25: South America Synthesis Metal Nanowires Revenue Share (%), by Country 2025 & 2033
- Figure 26: South America Synthesis Metal Nanowires Volume Share (%), by Country 2025 & 2033
- Figure 27: Europe Synthesis Metal Nanowires Revenue (billion), by Application 2025 & 2033
- Figure 28: Europe Synthesis Metal Nanowires Volume (K), by Application 2025 & 2033
- Figure 29: Europe Synthesis Metal Nanowires Revenue Share (%), by Application 2025 & 2033
- Figure 30: Europe Synthesis Metal Nanowires Volume Share (%), by Application 2025 & 2033
- Figure 31: Europe Synthesis Metal Nanowires Revenue (billion), by Type 2025 & 2033
- Figure 32: Europe Synthesis Metal Nanowires Volume (K), by Type 2025 & 2033
- Figure 33: Europe Synthesis Metal Nanowires Revenue Share (%), by Type 2025 & 2033
- Figure 34: Europe Synthesis Metal Nanowires Volume Share (%), by Type 2025 & 2033
- Figure 35: Europe Synthesis Metal Nanowires Revenue (billion), by Country 2025 & 2033
- Figure 36: Europe Synthesis Metal Nanowires Volume (K), by Country 2025 & 2033
- Figure 37: Europe Synthesis Metal Nanowires Revenue Share (%), by Country 2025 & 2033
- Figure 38: Europe Synthesis Metal Nanowires Volume Share (%), by Country 2025 & 2033
- Figure 39: Middle East & Africa Synthesis Metal Nanowires Revenue (billion), by Application 2025 & 2033
- Figure 40: Middle East & Africa Synthesis Metal Nanowires Volume (K), by Application 2025 & 2033
- Figure 41: Middle East & Africa Synthesis Metal Nanowires Revenue Share (%), by Application 2025 & 2033
- Figure 42: Middle East & Africa Synthesis Metal Nanowires Volume Share (%), by Application 2025 & 2033
- Figure 43: Middle East & Africa Synthesis Metal Nanowires Revenue (billion), by Type 2025 & 2033
- Figure 44: Middle East & Africa Synthesis Metal Nanowires Volume (K), by Type 2025 & 2033
- Figure 45: Middle East & Africa Synthesis Metal Nanowires Revenue Share (%), by Type 2025 & 2033
- Figure 46: Middle East & Africa Synthesis Metal Nanowires Volume Share (%), by Type 2025 & 2033
- Figure 47: Middle East & Africa Synthesis Metal Nanowires Revenue (billion), by Country 2025 & 2033
- Figure 48: Middle East & Africa Synthesis Metal Nanowires Volume (K), by Country 2025 & 2033
- Figure 49: Middle East & Africa Synthesis Metal Nanowires Revenue Share (%), by Country 2025 & 2033
- Figure 50: Middle East & Africa Synthesis Metal Nanowires Volume Share (%), by Country 2025 & 2033
- Figure 51: Asia Pacific Synthesis Metal Nanowires Revenue (billion), by Application 2025 & 2033
- Figure 52: Asia Pacific Synthesis Metal Nanowires Volume (K), by Application 2025 & 2033
- Figure 53: Asia Pacific Synthesis Metal Nanowires Revenue Share (%), by Application 2025 & 2033
- Figure 54: Asia Pacific Synthesis Metal Nanowires Volume Share (%), by Application 2025 & 2033
- Figure 55: Asia Pacific Synthesis Metal Nanowires Revenue (billion), by Type 2025 & 2033
- Figure 56: Asia Pacific Synthesis Metal Nanowires Volume (K), by Type 2025 & 2033
- Figure 57: Asia Pacific Synthesis Metal Nanowires Revenue Share (%), by Type 2025 & 2033
- Figure 58: Asia Pacific Synthesis Metal Nanowires Volume Share (%), by Type 2025 & 2033
- Figure 59: Asia Pacific Synthesis Metal Nanowires Revenue (billion), by Country 2025 & 2033
- Figure 60: Asia Pacific Synthesis Metal Nanowires Volume (K), by Country 2025 & 2033
- Figure 61: Asia Pacific Synthesis Metal Nanowires Revenue Share (%), by Country 2025 & 2033
- Figure 62: Asia Pacific Synthesis Metal Nanowires Volume Share (%), by Country 2025 & 2033
List of Tables
- Table 1: Global Synthesis Metal Nanowires Revenue billion Forecast, by Application 2020 & 2033
- Table 2: Global Synthesis Metal Nanowires Volume K Forecast, by Application 2020 & 2033
- Table 3: Global Synthesis Metal Nanowires Revenue billion Forecast, by Type 2020 & 2033
- Table 4: Global Synthesis Metal Nanowires Volume K Forecast, by Type 2020 & 2033
- Table 5: Global Synthesis Metal Nanowires Revenue billion Forecast, by Region 2020 & 2033
- Table 6: Global Synthesis Metal Nanowires Volume K Forecast, by Region 2020 & 2033
- Table 7: Global Synthesis Metal Nanowires Revenue billion Forecast, by Application 2020 & 2033
- Table 8: Global Synthesis Metal Nanowires Volume K Forecast, by Application 2020 & 2033
- Table 9: Global Synthesis Metal Nanowires Revenue billion Forecast, by Type 2020 & 2033
- Table 10: Global Synthesis Metal Nanowires Volume K Forecast, by Type 2020 & 2033
- Table 11: Global Synthesis Metal Nanowires Revenue billion Forecast, by Country 2020 & 2033
- Table 12: Global Synthesis Metal Nanowires Volume K Forecast, by Country 2020 & 2033
- Table 13: United States Synthesis Metal Nanowires Revenue (billion) Forecast, by Application 2020 & 2033
- Table 14: United States Synthesis Metal Nanowires Volume (K) Forecast, by Application 2020 & 2033
- Table 15: Canada Synthesis Metal Nanowires Revenue (billion) Forecast, by Application 2020 & 2033
- Table 16: Canada Synthesis Metal Nanowires Volume (K) Forecast, by Application 2020 & 2033
- Table 17: Mexico Synthesis Metal Nanowires Revenue (billion) Forecast, by Application 2020 & 2033
- Table 18: Mexico Synthesis Metal Nanowires Volume (K) Forecast, by Application 2020 & 2033
- Table 19: Global Synthesis Metal Nanowires Revenue billion Forecast, by Application 2020 & 2033
- Table 20: Global Synthesis Metal Nanowires Volume K Forecast, by Application 2020 & 2033
- Table 21: Global Synthesis Metal Nanowires Revenue billion Forecast, by Type 2020 & 2033
- Table 22: Global Synthesis Metal Nanowires Volume K Forecast, by Type 2020 & 2033
- Table 23: Global Synthesis Metal Nanowires Revenue billion Forecast, by Country 2020 & 2033
- Table 24: Global Synthesis Metal Nanowires Volume K Forecast, by Country 2020 & 2033
- Table 25: Brazil Synthesis Metal Nanowires Revenue (billion) Forecast, by Application 2020 & 2033
- Table 26: Brazil Synthesis Metal Nanowires Volume (K) Forecast, by Application 2020 & 2033
- Table 27: Argentina Synthesis Metal Nanowires Revenue (billion) Forecast, by Application 2020 & 2033
- Table 28: Argentina Synthesis Metal Nanowires Volume (K) Forecast, by Application 2020 & 2033
- Table 29: Rest of South America Synthesis Metal Nanowires Revenue (billion) Forecast, by Application 2020 & 2033
- Table 30: Rest of South America Synthesis Metal Nanowires Volume (K) Forecast, by Application 2020 & 2033
- Table 31: Global Synthesis Metal Nanowires Revenue billion Forecast, by Application 2020 & 2033
- Table 32: Global Synthesis Metal Nanowires Volume K Forecast, by Application 2020 & 2033
- Table 33: Global Synthesis Metal Nanowires Revenue billion Forecast, by Type 2020 & 2033
- Table 34: Global Synthesis Metal Nanowires Volume K Forecast, by Type 2020 & 2033
- Table 35: Global Synthesis Metal Nanowires Revenue billion Forecast, by Country 2020 & 2033
- Table 36: Global Synthesis Metal Nanowires Volume K Forecast, by Country 2020 & 2033
- Table 37: United Kingdom Synthesis Metal Nanowires Revenue (billion) Forecast, by Application 2020 & 2033
- Table 38: United Kingdom Synthesis Metal Nanowires Volume (K) Forecast, by Application 2020 & 2033
- Table 39: Germany Synthesis Metal Nanowires Revenue (billion) Forecast, by Application 2020 & 2033
- Table 40: Germany Synthesis Metal Nanowires Volume (K) Forecast, by Application 2020 & 2033
- Table 41: France Synthesis Metal Nanowires Revenue (billion) Forecast, by Application 2020 & 2033
- Table 42: France Synthesis Metal Nanowires Volume (K) Forecast, by Application 2020 & 2033
- Table 43: Italy Synthesis Metal Nanowires Revenue (billion) Forecast, by Application 2020 & 2033
- Table 44: Italy Synthesis Metal Nanowires Volume (K) Forecast, by Application 2020 & 2033
- Table 45: Spain Synthesis Metal Nanowires Revenue (billion) Forecast, by Application 2020 & 2033
- Table 46: Spain Synthesis Metal Nanowires Volume (K) Forecast, by Application 2020 & 2033
- Table 47: Russia Synthesis Metal Nanowires Revenue (billion) Forecast, by Application 2020 & 2033
- Table 48: Russia Synthesis Metal Nanowires Volume (K) Forecast, by Application 2020 & 2033
- Table 49: Benelux Synthesis Metal Nanowires Revenue (billion) Forecast, by Application 2020 & 2033
- Table 50: Benelux Synthesis Metal Nanowires Volume (K) Forecast, by Application 2020 & 2033
- Table 51: Nordics Synthesis Metal Nanowires Revenue (billion) Forecast, by Application 2020 & 2033
- Table 52: Nordics Synthesis Metal Nanowires Volume (K) Forecast, by Application 2020 & 2033
- Table 53: Rest of Europe Synthesis Metal Nanowires Revenue (billion) Forecast, by Application 2020 & 2033
- Table 54: Rest of Europe Synthesis Metal Nanowires Volume (K) Forecast, by Application 2020 & 2033
- Table 55: Global Synthesis Metal Nanowires Revenue billion Forecast, by Application 2020 & 2033
- Table 56: Global Synthesis Metal Nanowires Volume K Forecast, by Application 2020 & 2033
- Table 57: Global Synthesis Metal Nanowires Revenue billion Forecast, by Type 2020 & 2033
- Table 58: Global Synthesis Metal Nanowires Volume K Forecast, by Type 2020 & 2033
- Table 59: Global Synthesis Metal Nanowires Revenue billion Forecast, by Country 2020 & 2033
- Table 60: Global Synthesis Metal Nanowires Volume K Forecast, by Country 2020 & 2033
- Table 61: Turkey Synthesis Metal Nanowires Revenue (billion) Forecast, by Application 2020 & 2033
- Table 62: Turkey Synthesis Metal Nanowires Volume (K) Forecast, by Application 2020 & 2033
- Table 63: Israel Synthesis Metal Nanowires Revenue (billion) Forecast, by Application 2020 & 2033
- Table 64: Israel Synthesis Metal Nanowires Volume (K) Forecast, by Application 2020 & 2033
- Table 65: GCC Synthesis Metal Nanowires Revenue (billion) Forecast, by Application 2020 & 2033
- Table 66: GCC Synthesis Metal Nanowires Volume (K) Forecast, by Application 2020 & 2033
- Table 67: North Africa Synthesis Metal Nanowires Revenue (billion) Forecast, by Application 2020 & 2033
- Table 68: North Africa Synthesis Metal Nanowires Volume (K) Forecast, by Application 2020 & 2033
- Table 69: South Africa Synthesis Metal Nanowires Revenue (billion) Forecast, by Application 2020 & 2033
- Table 70: South Africa Synthesis Metal Nanowires Volume (K) Forecast, by Application 2020 & 2033
- Table 71: Rest of Middle East & Africa Synthesis Metal Nanowires Revenue (billion) Forecast, by Application 2020 & 2033
- Table 72: Rest of Middle East & Africa Synthesis Metal Nanowires Volume (K) Forecast, by Application 2020 & 2033
- Table 73: Global Synthesis Metal Nanowires Revenue billion Forecast, by Application 2020 & 2033
- Table 74: Global Synthesis Metal Nanowires Volume K Forecast, by Application 2020 & 2033
- Table 75: Global Synthesis Metal Nanowires Revenue billion Forecast, by Type 2020 & 2033
- Table 76: Global Synthesis Metal Nanowires Volume K Forecast, by Type 2020 & 2033
- Table 77: Global Synthesis Metal Nanowires Revenue billion Forecast, by Country 2020 & 2033
- Table 78: Global Synthesis Metal Nanowires Volume K Forecast, by Country 2020 & 2033
- Table 79: China Synthesis Metal Nanowires Revenue (billion) Forecast, by Application 2020 & 2033
- Table 80: China Synthesis Metal Nanowires Volume (K) Forecast, by Application 2020 & 2033
- Table 81: India Synthesis Metal Nanowires Revenue (billion) Forecast, by Application 2020 & 2033
- Table 82: India Synthesis Metal Nanowires Volume (K) Forecast, by Application 2020 & 2033
- Table 83: Japan Synthesis Metal Nanowires Revenue (billion) Forecast, by Application 2020 & 2033
- Table 84: Japan Synthesis Metal Nanowires Volume (K) Forecast, by Application 2020 & 2033
- Table 85: South Korea Synthesis Metal Nanowires Revenue (billion) Forecast, by Application 2020 & 2033
- Table 86: South Korea Synthesis Metal Nanowires Volume (K) Forecast, by Application 2020 & 2033
- Table 87: ASEAN Synthesis Metal Nanowires Revenue (billion) Forecast, by Application 2020 & 2033
- Table 88: ASEAN Synthesis Metal Nanowires Volume (K) Forecast, by Application 2020 & 2033
- Table 89: Oceania Synthesis Metal Nanowires Revenue (billion) Forecast, by Application 2020 & 2033
- Table 90: Oceania Synthesis Metal Nanowires Volume (K) Forecast, by Application 2020 & 2033
- Table 91: Rest of Asia Pacific Synthesis Metal Nanowires Revenue (billion) Forecast, by Application 2020 & 2033
- Table 92: Rest of Asia Pacific Synthesis Metal Nanowires Volume (K) Forecast, by Application 2020 & 2033
Frequently Asked Questions
1. What is the projected Compound Annual Growth Rate (CAGR) of the Synthesis Metal Nanowires?
The projected CAGR is approximately 11.24%.
2. Which companies are prominent players in the Synthesis Metal Nanowires?
Key companies in the market include ACS Material, Cambrios, DuPont, BASF, Nuovo Film Inc, PlasmaChem, Shenzhen HUAKE-TEK, Western Metal Materials, TPK Touch Solutions, Nanjing Muke Nanotechnology, OFILM Group, Suzhou ColdStones Technology.
3. What are the main segments of the Synthesis Metal Nanowires?
The market segments include Application, Type.
4. Can you provide details about the market size?
The market size is estimated to be USD 8.2 billion as of 2022.
5. What are some drivers contributing to market growth?
N/A
6. What are the notable trends driving market growth?
N/A
7. Are there any restraints impacting market growth?
N/A
8. Can you provide examples of recent developments in the market?
N/A
9. What pricing options are available for accessing the report?
Pricing options include single-user, multi-user, and enterprise licenses priced at USD 3950.00, USD 5925.00, and USD 7900.00 respectively.
10. Is the market size provided in terms of value or volume?
The market size is provided in terms of value, measured in billion and volume, measured in K.
11. Are there any specific market keywords associated with the report?
Yes, the market keyword associated with the report is "Synthesis Metal Nanowires," which aids in identifying and referencing the specific market segment covered.
12. How do I determine which pricing option suits my needs best?
The pricing options vary based on user requirements and access needs. Individual users may opt for single-user licenses, while businesses requiring broader access may choose multi-user or enterprise licenses for cost-effective access to the report.
13. Are there any additional resources or data provided in the Synthesis Metal Nanowires report?
While the report offers comprehensive insights, it's advisable to review the specific contents or supplementary materials provided to ascertain if additional resources or data are available.
14. How can I stay updated on further developments or reports in the Synthesis Metal Nanowires?
To stay informed about further developments, trends, and reports in the Synthesis Metal Nanowires, consider subscribing to industry newsletters, following relevant companies and organizations, or regularly checking reputable industry news sources and publications.
Methodology
Step 1 - Identification of Relevant Samples Size from Population Database


Step 2 - Approaches for Defining Global Market Size (Value, Volume* & Price*)

Note*: In applicable scenarios
Step 3 - Data Sources
Primary Research
- Web Analytics
- Survey Reports
- Research Institute
- Latest Research Reports
- Opinion Leaders
Secondary Research
- Annual Reports
- White Paper
- Latest Press Release
- Industry Association
- Paid Database
- Investor Presentations

Step 4 - Data Triangulation
Involves using different sources of information in order to increase the validity of a study
These sources are likely to be stakeholders in a program - participants, other researchers, program staff, other community members, and so on.
Then we put all data in single framework & apply various statistical tools to find out the dynamic on the market.
During the analysis stage, feedback from the stakeholder groups would be compared to determine areas of agreement as well as areas of divergence

